WAVES II by WestmontWAVES II by Westmont is a next-generation evolution of the original WAVES indicator, designed to offer improved responsiveness , enhanced functionality , and clearer visual clarity . By incorporating advanced momentum filtering and smoother transitions in the VWAP (Volume Weighted Average Price) area , WAVES II provides users with a more dynamic and actionable tool for market analysis.
This indicator introduces new methodologies , visual enhancements , and advanced forecasting capabilities , making it an ideal tool for traders seeking faster insights and sharper reactions to market movements.
Key Features of WAVES II
WaveTrend Calculation
The core of WAVES II is the WaveTrend , which is calculated using the HLC3 (High + Low + Close) price .
The WaveTrend is smoothed through two processes:
EMA (Exponential Moving Average): Applied to the HLC3 to capture faster price movements .
SMA (Simple Moving Average): Applied to the first wave to smooth out shorter-term fluctuations.
VWAP Area Crossover
WAVES II calculates the VWAP area by subtracting the second wave from the first .
The indicator detects when this VWAP area crosses key levels :
Bullish Signal : When the VWAP area crosses upward with positive momentum.
Bearish Signal : When the VWAP area crosses downward with negative momentum.
Momentum Detection
Momentum is calculated by measuring the price change between bars and smoothing this change over a short period .
Positive momentum signals increasing price movement , while negative momentum indicates a slowing or reversing trend .
This momentum detection filters out weaker price movements , highlighting only the significant trend shifts and giving users confirmation of market movements.
Visual Enhancements
Glowing VWAP Lines : The VWAP area is plotted with multiple layers of colors, gradually fading in opacity. This highlights areas of strong price movement and reversals.
Fading Gradient Effect : The VWAP line is filled with a gradient that adjusts its opacity based on the distance from the center line, visually indicating market strength and reinforcing key levels.
VWAP Projection
WAVES II projects the VWAP area forward , based on its recent slope, to offer a forward-looking view of potential price movements. This projection helps traders anticipate short-term market direction and react faster to potential trend changes.
Key Differences Between WAVES and WAVES II
Smoothing and WaveTrend Calculation Adjustments
WAVES : Uses fixed smoothing parameters for WaveTrend calculation, resulting in a relatively stable and slower response to market changes.
The first smoothing (wavetrend1) uses an EMA with a fixed length.
The second smoothing (wavetrend2) uses a simple moving average (SMA) with a fixed length.
WAVES II : Introduces more responsive settings like smoothing_length, deviation_length, first_wave_length, and second_wave_length for faster reaction times to market movements. These adjustments make WAVES II ideal for traders who need quicker feedback and sharper market transitions.
Momentum Detection
WAVES : Does not incorporate momentum-based logic, relying only on the VWAP area and its relationship to historical values.
WAVES II : Adds momentum detection, which calculates the difference between current and previous price movements, smoothed over a defined period. This helps identify bullish and bearish trends more accurately, providing additional confirmation and improving signal reliability.
VWAP Area Cross Detection
WAVES : Detects VWAP area crossovers based on recent high and low values.
WAVES II : Refines cross detection by incorporating a momentum filter. A Bullish cross is confirmed when the VWAP area crosses upwards with positive momentum, while a Bearish cross is confirmed when it crosses down with negative momentum. This dual-condition approach enhances signal accuracy and offers better context for trade decisions.
Plotting and Visualization
WAVES : Plots the VWAP line, center line, and uses color transitions for VWAP area fills to represent market conditions.
WAVES II : Introduces a multi-layer glow effect for the VWAP line, with varying opacities, creating a visually dynamic experience. The gradient glow effect provides a clearer representation of market strength and proximity to the center line, making it easier to spot market shifts and interpret momentum at a glance.
Why WAVES II Was Created as a Separate Indicator
New Features and Functionality :
WAVES II introduces key features like momentum detection and VWAP projections , which significantly alter how the indicator operates. These are not minor updates but represent a shift in how the tool functions , providing faster and more detailed insights for traders. WAVES II gives traders sharper market feedback with improved responsiveness to price changes.
Targeted for Different Trading Styles :
WAVES II is aimed at traders who need faster reactions and more dynamic , reliable signals . While WAVES remains a solid choice for those who prefer a more stable, traditional approach, WAVES II caters to traders who require quicker feedback and more granular market insights. By offering both tools, traders can select the one that aligns with their style, whether that’s for faster decision-making or a more conservative approach .
Visual Clarity :
The enhanced visual effects in WAVES II, such as the multi-layer glow and gradient VWAP transitions , offer greater clarity and a more intuitive charting experience . These visual improvements allow traders to quickly interpret changes in the market, making WAVES II a more effective tool for detailed and actionable market analysis.
Clear Value for Traders :
WAVES II brings significant enhancements over the original WAVES, including more advanced features , faster momentum detection , and better visual representation of market dynamics . This makes WAVES II a more powerful tool for traders seeking dynamic market insights . It is an ideal choice for those who need quicker and more reliable feedback than traditional tools can provide.
How to Use WAVES II
Users can watch for WaveTrend crossovers (when the line crosses 0) and VWAP area dots (bullish or bearish) to spot potential buy or sell signals.
Users can use momentum to confirm signals, helping you identify whether the market is gaining or losing strength.
WAVES II offers advanced features , faster responsiveness , and clearer visuals compared to the original WAVES indicator. By introducing momentum detection and refining the handling of VWAP crossovers , WAVES II enhances the overall trading experience, providing more dynamic, actionable insights for traders. While WAVES remains an excellent tool for those who prefer a simpler, more stable approach, WAVES II is designed for traders who seek a more detailed , faster-reacting tool for market analysis.
DOT

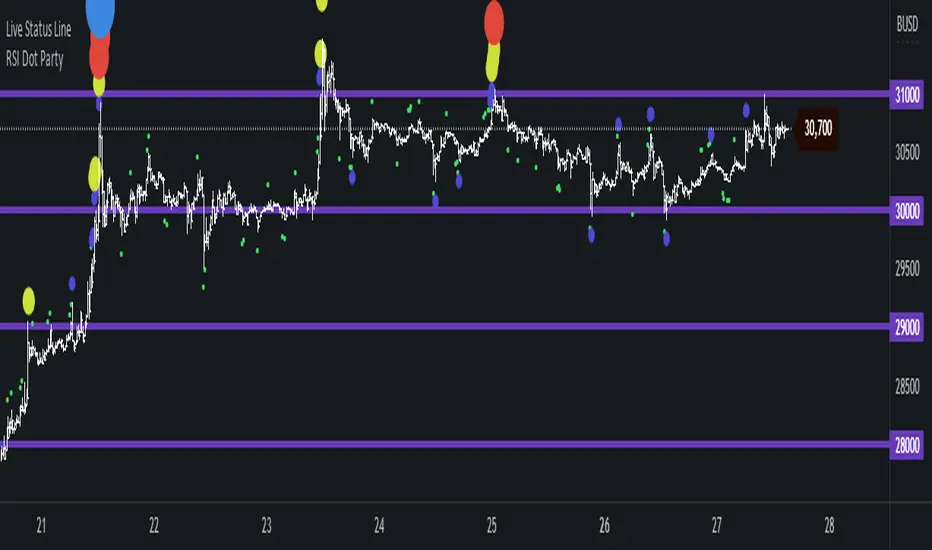
RSI Dot Party - All Lengths From 1 To 120The RSI Dot Party indicator displays all RSI lengths from 1 to 120 as different colored dots on the chart.
🔶 Purpose
Show the reversal point of price action to time entries and exits.
🔶 USAGE
When a dot displays it is a indication of the reversal of the price/trend. The larger the dot the more likely it is to reverse.
The Default settings generates dots for extreme cases where the RSI is over = 90 or under = 10 for every RSI length in the range of 1-120.
Example if the RSI of length 1 or 2 or 3 or 4 or ... or 15 or 16 or 17 or ... or 80 or 81 or 82 or ... if any of does RSI crosses a boundary a dot is shown.
A boundary is the over/under the RSI oscillates in.
Customize the settings until the dots match up with the high and lows of past price action.
🔶 SETTINGS
🔹 Source
Source 1: Is the First Source RSI is calculated from
Source 2: Is the Second Source RSI is calculated from
🔹 Meta Settings
Hours back to draw: To speed up the script calculate it only draws a set number of hours back, default is 300 hours back in time to draw then it cuts off.
Show Dots: Show or disable dots
Show Bar Color: Color the bars for each RSI incident
Filter Cross: Filters and only shows dots when the RSI crosses above or bellow a boundary. If not all candles above or bellow the boundaries will display a dot.
Dots Location Absolute: Instead of showing the dots above or bellow the candle, the dots will show up on the top and bottom of the window.
🔹 7 RSI Groups
There are a total of 7 RSI colors.
Range Very Tiny: Default Color Green
Range Tiny: Default Color Purple
Range Small: Default Color Yellow
Range Normal: Default Color Red
Range Large: Default Color Blue
Range Huge: Default Color Dark Purple
Range Very Huge: Default Color White
🔹 RSI Group Settings
Hi/Low Color: Change the Color of that group.
Start/End: The Start and End range of this RSI color. Example if start = 5 and end = 10 the RSI of 5,6,7,8,9,10 will be displayed on the chart for that color, if any of does RSI goes above or bellow the boundary a dot is displayed on that candle.
Delay: The RSI needs to be above or bellow a boundary for x number of candles before displaying a dot. For example if delay = 2 and the RSI is over = 70 for 2 candles then it will display a dot.
Under/Over: Boundaries that indicate when to draw a dot, if over = 70 and RSI crosses above 70 a dot is displayed.
🔹 Show
Section that allows you to disable RSI grounds you dont want to see, this also removes them from the alert signal generated.
Show Low: Show or disable Low RSI dots
Show High: Show or disable High RSI dots
🔶 ALERTS
Alert for all New RSIs Dots Created in real time
The alert generated depends on what groups are showing or not, if the green group is disabled for example the alert will not be generated.
🔶 Warning
When a dot shows up it can continue moving. For example if a purple dot shows itself above a 15 minute candle, if that candle/price continue to extend up the dot will move up with it.
Dots can also disappear occasionally if the RSI moves in and out of a boundary within that candles life span.
🔶 Community
I hope you guys find this useful, if you have any questions or feature requests leave me a comment! Take care :D
InvictusHello,
I introduce my strategy that provide signals for entering in the market and signal for exit.
This indicator attempts to show a trader when is the best time to open a long or short position. The calculations are partially based on volatility, SMA, EMA and predefined values depending on used timeframe.
We collect data from comparing the current price, calculating the average move of the market, top, bottom and close of the latest bars. The middle line is an adaptive moving average, which is the base of the signals and we also use it as a Trend Line to determine if we are in long or short "condition". The basic idea of this indicator is to show the best place to open a Long or Short position and when to close it.
It is very simple - there are 2 type of signals - LONG (in green) and SHORT (in red). You can close your position when a TP (Take profit) shows up or based on your calculations.
You can chose from several options which strategy you want (there is a "Strategy" select in the settings). The strategies that are proving better according to our tests are marked with a diamond.
Don't forget to always trade with caution, trading is dangerous don't trade more than you can afford to lose.
Please contact me via personal message if you want to test the strategy or for more information.
Thank you.

Carpe Diem 2.0 [Alerts]Carpe Diem 2.0 Alerts, Still automating the original Carpe Diem scripts, now the V2 uses heavy Volume based filtering to help only trade in bullish markets,
Search for Carpe diem 2.0 to see backtest results
This Alerts script has been created to help with bot Automation allowing you to create custom alerts
This script has 10 variations built within it which are fitted for the coins differnt coinditions
The coins included are
DOGE/USDT 4H
XRP/USDT 4H
LINK/USDT 4H
MATIC/USDT 2H
SRM /USDT 6H
COTI/USDT 4H
DOT/USDT 3H
TRX /USDT 4H
RSR/USDT 4H
ATOM/USDT 4H
How to use the Indicator
You can change what plots are shown in the settings Cog, I toggle all plots off apart from the coin I am trading
When the Volume Average line is green, the market is up trending and will be looking for a trade whereas when they are red, the market is in a sideways or downtrend.
You can ignore the color of the line and just base the bullish / bearish bias based of the Volume line being above/below 0
The script is written in version 4
When you go to create an alert with this script you will see 20 options, 10 for opening longs on certain conis and then 10 to close them
This strategy performs best on the Binance listings

Crypto Derivatives Sentiment HeatmapWhat?
This is a heatmap that shows derivatives sentiment for some of the most prominent coins in crypto.
Content
Coins included:
BTC
ETH
LTC
DOT
LINK
YFI
The indicator takes the Binance USDT perpetual swaps of these coins and compares them to their respective spot indices.
Binance is the exchange of choice because their perps have the highest volume in the market.
For the spot indices I've used the indices created by Bitmex.
These are very intricate and weighted indices with compositions of the most important and trustworthy spot markets.
For more information check the Bitmex website.
The heatmap shows red coloring if the perp is trading above spot (bearish).
It shows green coloring if the perp is trading below spot (bullish).
The lighter the color the less wide the gap is between perps & spot.
The darker (brighter) the coloring the more extreme the difference.
Trading
It's quite simple.
When you see a lot of green, preferably dark green, you should have a bullish bias because it means that perps are oversold or that spot is bidding hard.
Vice versa a lot of red should give a bearish bias.
It's very practical for a quick sentiment check.
This indicator is free so you can just add it to your favorites.
Shout-out to zzzcrypto123 for inspiring me.
