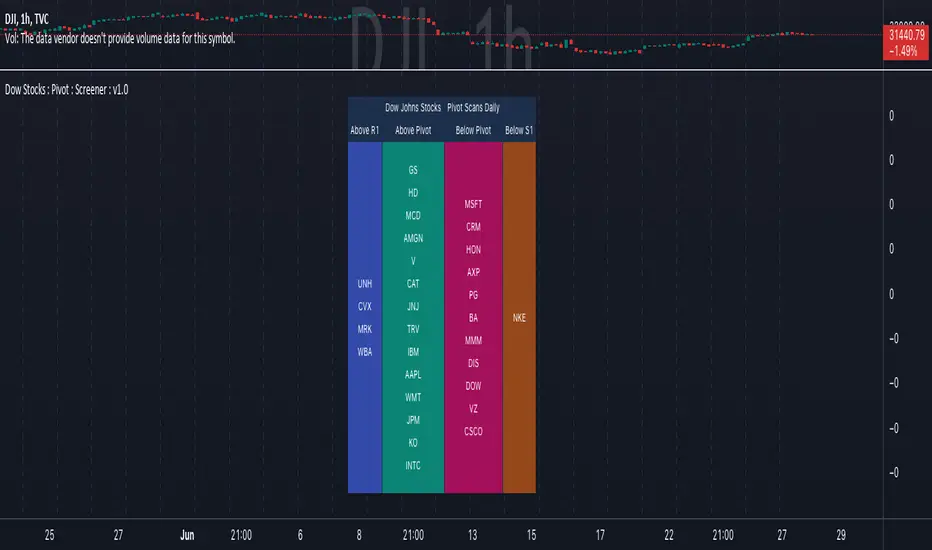
Dow Jones Stocks : Pivot : ScreenerWith the Dow Jones Stocks Pivot Screener, you can scan a list of the 30 stocks / companies included in the Dow Jones Industrial Average index in real-time.
By using the indicator, you can monitor pivot breakouts and enter trades based on them.
As soon as the DJIA Index list is updated, I will update this List
The indicator includes three types of pivots . Classic, Fibonacci, and Standard.
You have the option to select between Daily, Weekly, and Monthly time frames as well
Djia
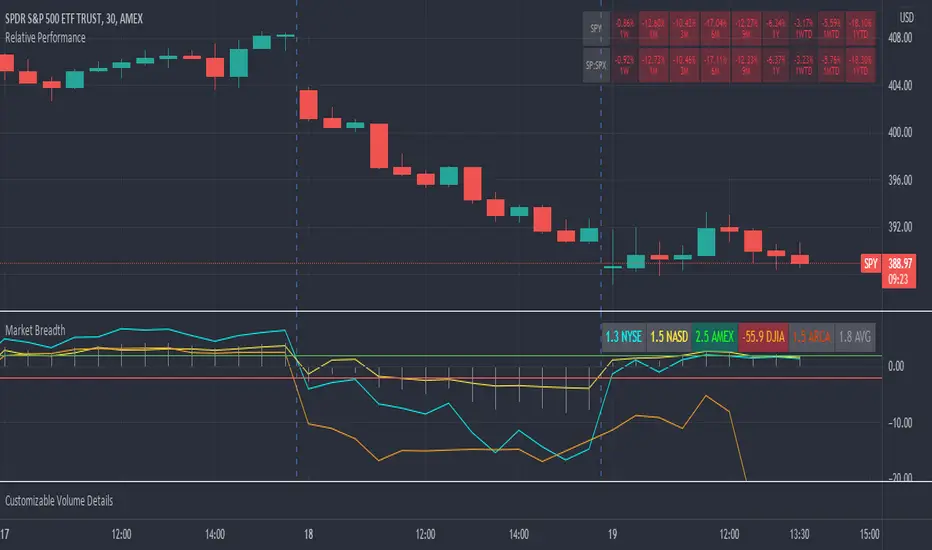
Market Breadth RatiosThis indicator provides breadth ratios for various indices/exchanges based on the up/down volume.
Breadth ratios included for NYSE, NASDAQ, AMEX, DJIA, ARCA, and and average.
Very straight forward to use, if the ratios is above 2, stocks should be in uptrend, below -2 stocks should trend down. In between 2 and -2 is going to be a choppy market.
Stock Market Indices Correlations HeatmapHello friends,
I'm excited to share one of my insightful tools. This indicator visualizes how major global stock indices move relative to your selected instrument, helping you instantly spot market-wide strength, weakness, or divergence.
🛠 How It Works
The indicator calculates Pearson correlation coefficients between your selected symbol and 28 major stock indices , including S&P 500, NASDAQ, DAX, NIKKEI, and many more. Each color is selected according to the correlation value:
Green hues show positive correlations (instruments moving together).
Red hues show negative correlations (instruments moving in opposite directions).
Lighter or transparent colors indicate weak or no correlation.
You can customize the correlation lookback period (default 14 bars ), select your preferred data source (close, open, etc.), and choose from multiple professional color palettes to best match your charting style.
🔥 Key Features
Comprehensive Global Coverage — Correlations across 28 major indices from North America, Europe, and Asia.
Multiple Palettes — Choose from 8 professional color palettes (Blue/Red, Spectral, Viridis, etc.) for better visual clarity.
Adjustable Lookback — Set correlation calculation period from 1 to any number of bars.
Dynamic Data Requests — Real-time updates for all tracked indices using TradingView's request.security.
Smart Alerts — Receive alerts when all indices align positively or negatively — a sign of broad market sentiment extremes.
Performance Optimized — Efficient data handling ensures smooth operation even with multiple requests per bar.
Enhanced UI — Streamlined settings panel for fast palette and source adjustments.
Non-Repainting — Uses only historical data, ensuring stable readings.
If you'd like access or have any questions, feel free to reach out to me directly via DM.
👋 Good luck and happy trading!
Script pago

Simple RSI-MA Algo Beats DOW By Huge Margin Over Past 100 Years!This simple RSI-MA long/short algorithm beats the Dow by a FREAKING HUGE margin over the past century (excluding dividends and trading costs).
The algorithm uses a fast SMA of the RSI as a buy/cover signal and a slow SMA of the RSI as a sell/short signal.
Backtest period = 09/17/1916 - 11/02/2015
Dow = 98 --> 17,830 = +18,094% = 5.38% CAGR
Algorithm = net profit + open P/L = +43,349% = 6.31% CAGR
Notice how the algorithm dodged both the 30s' Great Depression and the 2008 Crisis. Pretty cool huh? :)
ALGORITHM'S FORMULA (use weekly chart):
Buy/Cover = MA10(RSI10) cross> 50
Sell/Short = MA50(RSI10) cross< 50
STRATEGY TESTER'S SETTINGS:
- Initial cash = $10,000
- Pyramiding disabled
- Re-investment enabled (order size = 100% of equity )
- Trade re-calculations disabled
DISCLAIMER: None of my ideas and posts are investment advice. Past performance is not an indication of future results. This strategy was constructed with the benefit of hindsight and its future performance cannot be guaranteed.
