Market Cipher B by WeloTradesMarket Cipher B by WeloTrades: Detailed Script Description
//Overview//
"Market Cipher B by WeloTrades" is an advanced trading tool that combines multiple technical indicators to provide a comprehensive market analysis framework. By integrating WaveTrend, RSI, and MoneyFlow indicators, this script helps traders to better identify market trends, potential reversals, and trading opportunities. The script is designed to offer a holistic view of the market by combining the strengths of these individual indicators.
//Key Features and Originality//
WaveTrend Analysis:
WaveTrend Channel (WT1 and WT2): The core of this script is the WaveTrend indicator, which uses the smoothed average of typical price to identify overbought and oversold conditions. WT1 and WT2 are calculated to track market momentum and cyclical price movements.
Major Divergences (🐮/🐻): The script detects and highlights major bullish and bearish divergences automatically, providing traders with visual cues for potential reversals. This helps in making informed decisions based on divergence patterns.
Relative Strength Index (RSI):
RSI Levels: RSI is used to measure the speed and change of price movements, with specific levels indicating overbought and oversold conditions.
Customizable Levels: Users can configure the overbought and oversold thresholds, allowing for a tailored analysis based on individual trading strategies.
MoneyFlow Indicator:
Fast and Slow MoneyFlow: This indicator tracks the flow of capital into and out of the market, offering insights into the underlying market strength. It includes configurable periods and multipliers for both fast and slow MoneyFlow.
Vertical Positioning: The script allows users to adjust the vertical position of MoneyFlow plots to maintain a clear and uncluttered chart.
Stochastic RSI:
Stochastic RSI Levels: This combines the RSI and Stochastic indicators to provide a momentum oscillator that is sensitive to price changes. It is used to identify overbought and oversold conditions within a specified period.
Customizable Levels: Traders can set specific levels for more precise analysis.
//How It Works//
The script integrates these indicators through advanced algorithms, creating a synergistic effect that enhances market analysis. Here’s a detailed explanation of the underlying concepts and calculations:
WaveTrend Indicator:
Calculation: WaveTrend is based on the typical price (average of high, low, and close) smoothed over a specified channel length. WT1 and WT2 are derived from this typical price and further smoothed using the Average Channel Length. The difference between WT1 and WT2 indicates momentum, helping to identify cyclical market trends.
RSI (Relative Strength Index):
Calculation: RSI calculates the average gains and losses over a specified period to measure the speed and change of price movements. It oscillates between 0 and 100, with levels set to identify overbought (>70) and oversold (<30) conditions.
MoneyFlow Indicator:
Calculation: MoneyFlow is derived by multiplying price changes by volume and smoothing the results over specified periods. Fast MoneyFlow reacts quickly to price changes, while Slow MoneyFlow offers a broader view of capital movement trends.
Stochastic RSI:
Calculation: Stochastic RSI is computed by applying the Stochastic formula to RSI values, which highlights the RSI’s relative position within its range over a given period. This helps in identifying momentum shifts more precisely.
//How to Use the Script//
Display Settings:
Users can enable or disable various components like WaveTrend OB & OS levels, MoneyFlow plots, and divergence alerts through checkboxes.
Example: Turn on "Show Major Divergence" to see major bullish and bearish divergence signals directly on the chart.
Adjust Channel Settings:
Customize the data source, channel length, and smoothing periods in the "WaveTrend Channel SETTINGS" group.
Example: Set the "Channel Length" to 10 for a more responsive WaveTrend line or adjust the "Average Channel Length" to 21 for smoother trends.
Set Overbought & Oversold Levels:
Configure levels for WaveTrend, RSI, and Stochastic RSI in their respective settings groups.
Example: Set the WaveTrend Overbought Level to 60 and Oversold Level to -60 to define critical thresholds.
Money Flow Settings:
Adjust the periods and multipliers for Fast and Slow MoneyFlow indicators, and set their vertical positions for better visualization.
Example: Set the Fast Money Flow Period to 9 and Slow Money Flow Period to 12 to capture both short-term and long-term capital movements.
//Justification for Combining Indicators//
Enhanced Market Analysis:
Combining WaveTrend, RSI, and MoneyFlow provides a more comprehensive view of market conditions. Each indicator brings a unique perspective, making the analysis more robust.
WaveTrend identifies cyclical trends, RSI measures momentum, and MoneyFlow tracks capital movement. Together, they provide a multi-dimensional analysis of the market.
Improved Decision-Making:
By integrating these indicators, the script helps traders make more informed decisions. For example, a bullish divergence detected by WaveTrend might be validated by an RSI moving out of oversold territory and supported by increasing MoneyFlow.
Customization and Flexibility:
The script offers extensive customization options, allowing traders to tailor it to their specific needs and strategies. This flexibility makes it suitable for different trading styles and timeframes.
//Conclusion//
The indicator stands out due to its innovative combination of WaveTrend, RSI, and MoneyFlow indicators, offering a well-rounded tool for market analysis. By understanding how each component works and how they complement each other, traders can leverage this script to enhance their market analysis and trading strategies, making more informed and confident decisions.
Remember to always backtest the indicator first before implying it to your strategy.
Divergences

MACD 4C with DivergenceMACD 4C Indicator with Divergence
This indicator, named MACD 4C, enhances the traditional MACD (Moving Average Convergence Divergence) by providing a visually intuitive representation with four distinct colors for the histogram bars. It offers a clear interpretation of market momentum and potential trend reversals.
Key Features:
Customizable Parameters: Users can adjust the fast and slow moving average periods along with the signal smoothing parameter to tailor the indicator to their preferred trading style and market conditions.
Four-color Histogram: The histogram bars are color-coded for easy interpretation. Lime and green bars indicate increasing bullish momentum, while maroon and red bars signify increasing bearish momentum.
Bullish and Bearish Divergence Detection: The indicator identifies bullish and bearish divergences between the MACD histogram and price action. Bullish divergence occurs when the price makes a lower low while the MACD histogram forms a higher low, indicating potential bullish reversal. Conversely, bearish divergence occurs when the price makes a higher high while the MACD histogram forms a lower high, suggesting a potential bearish reversal.
How to Use:
Trend Confirmation: Monitor the color of the histogram bars. A series of green (or lime) bars suggests a strengthening bullish trend, while a series of red (or maroon) bars indicates a strengthening bearish trend.
Divergence Identification: Watch for divergences between the MACD histogram and price action. Bullish divergence may signal a potential bullish reversal, while bearish divergence may indicate a potential bearish reversal. These signals can be used in conjunction with other technical analysis tools to confirm trade entries and exits.
The MACD 4C indicator was developed by user vkno422 You can find the original author and their work on their TradingView profile: www.tradingview.com

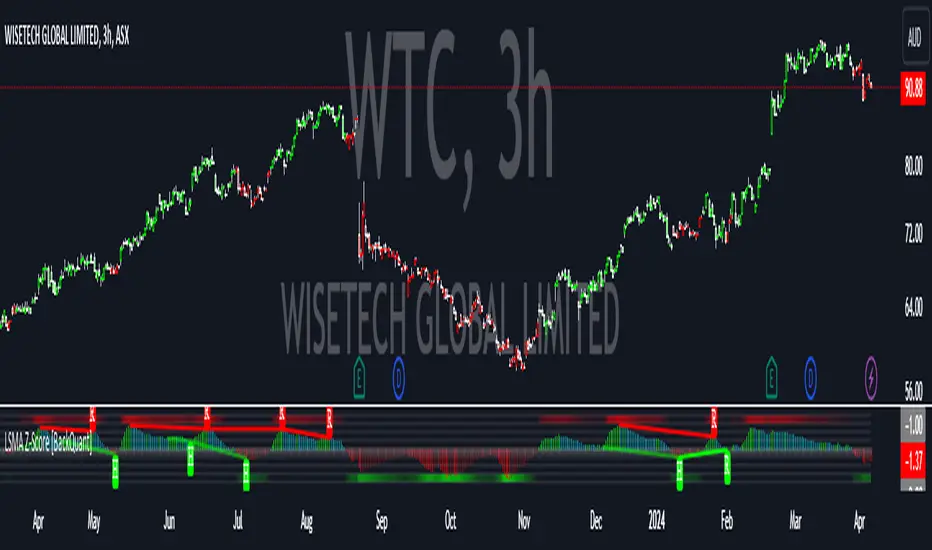
LSMA Z-Score [BackQuant]LSMA Z-Score
Main Features and Use in the Trading Strategy
- The indicator normalizes the LSMA into a detrended Z-Score, creating an oscillator with standard deviation levels to indicate trend strength.
- Adaptive coloring highlights the rate of change and potential reversals, with different colors for positive and negative changes above and below the midline.
- Extreme levels with adaptive coloring indicate the probability of a reversion, providing strategic entry or exit points.
- Alert conditions for crossing the midline or significant shifts in trend direction enhance its utility within a trading strategy.
1. What is an LSMA?
The Least Squares Moving Average (LSMA) is a technical indicator that smoothens price data to help identify trends. It uses the least squares regression method to fit a straight line through the selected price points over a specified period. This approach minimizes the sum of the squares of the distances between the line and the price points, providing a more statistically grounded moving average that can adapt more smoothly to price changes.
2. What is a Z-Score?
A Z-Score is a statistical measurement that describes a value's relationship to the mean of a group of values, measured in terms of standard deviations from the mean. If a Z-Score is 0, it indicates that the data point's score is identical to the mean score. A Z-Score helps in understanding if a data point is typical for a given data set or if it is atypical. In finance, a Z-Score is often used to measure how far a piece of data is from the average of a set, which can be helpful in identifying outliers or unusual data points.
3. Why Turning LSMA into a Z-Score is Innovative and Its Benefits
Converting LSMA into a Z-Score is innovative because it combines the trend identification capabilities of the LSMA with the statistical significance testing of Z-Scores. This transformation normalizes the LSMA, creating a detrended oscillator that oscillates around a mean (zero line), with standard deviation levels to show trend strength. This method offers several benefits:
Enhanced Trend Detection:
- By normalizing the LSMA, traders can more easily identify when the price is deviating significantly from its trend, which can signal potential trading opportunities.
Standardization:
- The Z-Score transformation allows for comparisons across different assets or time frames, as the score is standardized.
Objective Measurement of Trend Strength:
- The use of standard deviation levels provides an objective measure of trend strength and volatility.
4. How It Can Be Used in the Context of a Trading System
This indicator can serve as a versatile tool within a trading system for a range of things:
Trend Confirmation:
- A positive Z-Score can confirm an uptrend, while a negative Z-Score can confirm a downtrend, providing traders with signals to enter or exit trades.
Oversold/Overbought Conditions:
- Extreme Z-Score levels can indicate overbought or oversold conditions, suggesting potential reversals or pullbacks.
Volatility Assessment:
- The standard deviation levels can help traders assess market volatility, with wider bands indicating higher volatility.
5. How It Can Be Used for Trend Following
For trend following strategies, this indicator can be particularly useful:
Trend Strength Indicator:
- By monitoring the Z-Score's distance from zero, traders can gauge the strength of the current trend, with larger absolute values indicating stronger trends.
Directional Bias:
- Positive Z-Scores can be used to establish a bullish bias, while negative Z-Scores can establish a bearish bias, guiding trend following entries and exits.
Color-Coding for Trend Changes :
- The adaptive coloring of the indicator based on the rate of change and extreme levels provides visual cues for potential trend reversals or continuations.
Thus following all of the key points here are some sample backtests on the 1D Chart
Disclaimer: Backtests are based off past results, and are not indicative of the future.
This is using the Midline Crossover:
INDEX:BTCUSD
INDEX:ETHUSD
BINANCE:SOLUSD
Divergence Toolkit (Real-Time)The Divergence Toolkit is designed to automatically detect divergences between the price of an underlying asset and any other @TradingView built-in or community-built indicator or script. This algorithm provides a comprehensive solution for identifying both regular and hidden divergences, empowering traders with valuable insights into potential trend reversals.
🔲 Methodology
Divergences occur when there is a disagreement between the price action of an asset and the corresponding indicator. Let's review the conditions for regular and hidden divergences.
Regular divergences indicate a potential reversal in the current trend.
Regular Bullish Divergence
Price Action - Forms a lower low.
Indicator - Forms a higher low.
Interpretation - Suggests that while the price is making new lows, the indicator is showing increasing strength, signaling a potential upward reversal.
Regular Bearish Divergence
Price Action - Forms a higher high.
Indicator - Forms a lower high.
Interpretation - Indicates that despite the price making new highs, the indicator is weakening, hinting at a potential downward reversal.
Hidden divergences indicate a potential continuation of the existing trend.
Hidden Bullish Divergence
Price Action - Forms a higher low.
Indicator - Forms a lower low.
Interpretation - Suggests that even though the price is retracing, the indicator shows increasing strength, indicating a potential continuation of the upward trend.
Hidden Bearish Divergence
Price Action - Forms a lower high.
Indicator - Forms a higher high.
Interpretation - Indicates that despite a retracement in price, the indicator is still strong, signaling a potential continuation of the downward trend.
In both regular and hidden divergences, the key is to observe the relationship between the price action and the indicator. Divergences can provide valuable insights into potential trend reversals or continuations.
The methodology employed in this script involves the detection of divergences through conditional price levels rather than relying on detected pivots. Traditionally, divergences are created by identifying pivots in both the underlying asset and the oscillator. However, this script employs a trailing stop on the oscillator to detect potential swings, providing a real-time approach to identifying divergences, you may find more info about it here (SuperTrend Toolkit) . We detect swings or pivots simply by testing for crosses between the indicator and its trailing stop.
type oscillator
float o = Oscillator Value
float s = Trailing Stop Value
oscillator osc = oscillator.new()
bool l = ta.crossunder(osc.o, osc.s) => Utilized as a formed high
bool h = ta.crossover (osc.o, osc.s) => Utilized as a formed low
// Note: these conditions alone could cause repainting when they are met but canceled at a later time before the bar closes. Hence, we wait for a confirmed bar.
// The script also includes the option to immediately alert when the conditions are met, if you choose so.
By testing for conditional price levels, the script achieves similar outcomes without the delays associated with pivot-based methods.
type bar
float o = open
float h = high
float l = low
float c = close
bar b = bar.new()
bool hi = b.h < b.h => A higher price level has been created
bool lo = b.l > b.l => A lower price level has been created
// Note: These conditions do not check for certain price swings hence they may seldom result in inaccurate detection.
🔲 Setup Guide
A simple example on one of my public scripts, Standardized MACD
🔲 Utility
We may auto-detect divergences to spot trend reversals & continuations.
🔲 Settings
Source - Choose an oscillator source of which to base the Toolkit on.
Zeroing - The Mid-Line value of the oscillator, for example RSI & MFI use 50.
Sensitivity - Calibrates the sensitivity of which Divergencies are detected, higher values result in more detections but less accuracy.
Lifetime - Maximum timespan to detect a Divergence.
Repaint - Switched on, the script will trigger Divergencies as they happen in Real-Time, could cause repainting when the conditions are met but canceled at a later time before bar closes.
🔲 Alerts
Bearish Divergence
Bullish Divergence
Bearish Hidden Divergence
Bullish Hidden Divergence
As well as the option to trigger 'any alert' call.
The Divergence Toolkit provides traders with a dynamic tool for spotting potential trend reversals and continuations. Its innovative approach to real-time divergence detection enhances the timeliness of identifying market opportunities.

Divergence Signal [TradingFinder] RSI & MACD Reversal On Swing🔵 Introduction
Sometimes in analyzing price charts using indicators, you may observe a discrepancy. For instance, while the price of stocks, currencies, or commodities is increasing, the indicator shows a decrease. Such a phenomenon in technical analysis is termed "divergence." Divergences are categorized into three types based on their formation and the prediction they make about the continuation of the price trend: "Regular Divergence," "Hidden Divergence," and "Time Divergence."
🟣 Important :
• This indicator exclusively identifies regular divergences since its primary function is to detect reversal points.
• This indicator identifies divergences using three indicators: "Moving Average Convergence Divergence" (MACD), "Relative Strength Index" (RSI), and "Awesome Oscillator" (AO). The user can choose each of these indicators in the settings using the "Divergence Detection Method" dropdown menu for identifying divergences. These settings are by default set to the MACD mode.
🔵Types of Divergence
Divergences, as mentioned, offer different predictions about the continuation of price trends. Hence, they have various types. We will focus on explaining regular divergences based on this indicator.
🟣 Regular Divergence(RD) :
Regular divergence is a situation arising from contradictory behavior between the indicator and the price chart at the end of a trend. By identifying regular divergences, we anticipate a change in trend direction resembling a reversal pattern.
Regular divergence has two types based on the trend and prediction:
Negative Regular Divergence (RD-) :
This type occurs between two price peaks at the end of an uptrend. Despite forming a new high, the indicator fails to recognize it, indicating a negative regular divergence. The likelihood of a subsequent downtrend is high. Negative divergence suggests strong selling pressure and weak buying power, portraying an unfavorable future for the stock.
Positive Regular Divergence (RD+) :
In contrast, positive regular divergence happens at the end of a downtrend and between two price troughs. As depicted in the chart, although the price forms a new low, the indicator doesn't acknowledge it. Positive regular divergence indicates robust buying pressure and weak selling power. Upon identifying positive divergence in the chart, we expect a price increase for the stock under review
🔵 How to Use
Information from the indicator is displayed in two ways: Table and Label.
🟣 Table : The table displays information about the latest divergence. This includes the type of divergence, existence or absence of divergence, consecutive divergences, divergence quality, and change in indicator phase.
Type Divergence : Indicates the type of divergence, which can be either "Bullish Divergence" or "Bearish Divergence."
Exist : Indicates the presence of divergence with a "+" sign and absence with a "-" sign. A green color is used for bullish divergence and red for bearish divergence.
Consecutive : Shows the number of consecutive divergences. For example, if there are 3 consecutive divergences, the number 3 is displayed.
Divergence Quality : Displays the quality of the divergence based on the number of consecutive divergences. If there is 1 divergence, the quality is "Normal"; for 2 divergences, it's "Good"; and for 3 or more divergences, it's "Strong."
Change Phase Indicator : Indicates whether a phase change in the indicator has occurred with "+" for yes and "-" for no.
🟣 Label : Unlike the table, which only shows information about the latest divergence, labels display information about each divergence at the point where it occurs. The information includes the type of divergence, detection method, divergence quality, consecutive divergences, and change in phase indicator. The selected method of detection is also displayed. For example, if the chosen method is the "AO" indicator, the label will show "Method: AO."
🔵 Settings
Fractal Period : Determines the period of swings. The minimum and default value is 2.
Divergence Detect Method : Selects the indicator (MACD, RSI, or AO) used for detecting divergences. The default indicator is MACD.
Show Fractal : Chooses whether to display fractals or not. The default is "No."
Show Table : Determines whether to display the table or not. The default is "Yes."
Show Label : Chooses whether to display labels or not. The default is "Yes."
Label Size : Adjusts the size of the labels from "Tiny" to "Large."

Squeeze Momentum DeluxeThe Squeeze Momentum Deluxe is a comprehensive trading toolkit built with features of momentum, volatility, and price action. This script offers a suite for both mean reversion and trend-following analysis. Developed based on the original TTM Squeeze implementation by @LazyBear, this indicator introduces several innovative components to enhance your trading insights.
🔲 Components and Features
Momentum Oscillator - as rooted in the TTM Squeeze, quantifies the relationship between price and its extremes over a defined period. By normalizing the calculation, the values become comparable throughout time and across securities, allowing for a nuanced assessment of Bullish and Bearish momentum. Furthermore, by presenting it as a ribbon with a signal line we gain additional information about the direction of price swings.
Squeeze Bars - The original squeeze concept is based on the relationship between the Bollinger Bands and Keltner Channel , once the BB resides inside the KC a squeeze occurs. By understanding their fundamentals a new form of calculation can be inferred.
method bb(float src, simple int len, simple float mult) => method kc(float src, simple int len, simple float mult) =>
float basis = ta.sma (src, len) float basis = ta.sma (src, len)
float dev = ta.stdev(src, len) float rng = ta.atr ( len)
float upper = basis + dev * mult float upper = basis + rng * mult
float lower = basis - dev * mult float lower = basis - rng * mult
Both BB and KC are constructed upon a moving average with the addition of Standard Deviation and Average True Range respectively. Therefore, the calculation can be transformed to when the Stdev is lower than the ATR a squeeze occurs.
method sqz(float src, simple int len) =>
float dev = ta.stdev(src, len)
float atr = ta.atr ( len)
dev < atr ? true : false
This indicator uses three different thresholds for the ATR to gain three levels of price "Squeeze" for further analysis.
Directional Flux- This component measures the overall direction of price volatility, offering insights into trend sentiment. Presented as waves in the background, it includes an OverFlux feature to signal extreme market bias in a particular direction which can signal either exhaustion or vital continuation. Additionally, the user can choose if to base the calculation on Heikin-Ashi Candles to bias the tool toward trend assessment.
Confluence Gauges - Placed at the top and bottom of the indicator, these gauges measure confluence in the relationship between the Momentum Oscillator and Directional Flux. They provide traders with an easily interpretable visual aid for detecting market sentiment. Reversal doritos displayed alongside them contribute to mean reversion analysis.
Divergences (Real-Time) - Equipped with a custom algorithm, the indicator detects real-time divergences between price and the oscillator. This dynamic feature enhances your ability to spot potential trend reversals as they occur.
🔲 Settings
Directional Flux Length - Adjusts the period of which the background volatility waves operate on.
Trend Bias - Bases the calculation of the Flux to HA candles to bias its behavior toward the trend of price action.
Squeeze Momentum Length - Calibrates the length of the main oscillator ribbon as well as the period for the squeeze algorithm.
Signal - Controls the width of the ribbon. Lower values result in faster responsiveness at the cost of premature positives.
Divergence Sensitivity - Adjusts a threshold to limit the amount of divergences detected based on strength. Higher values result in less detections, stronger structure.
🔲 Alerts
Sell Signal
Buy Signal
Bullish Momentum
Bearish Momentum
Bullish Flux
Bearish Flux
Bullish Swing
Bearish Swing
Strong Bull Gauge
Strong Bear Gauge
Weak Bull Gauge
Weak Bear Gauge
High Squeeze
Normal Squeeze
Low Squeeze
Bullish Divergence
Bearish Divergence
As well as the option to trigger 'any alert' call.
The Squeeze Momentum Deluxe is a comprehensive tool that goes beyond traditional momentum indicators, offering a rich set of features to elevate your trading strategy. I recommend using toolkit alongside other indicators to have a wide variety of confluence to therefore gain higher probabilistic and better informed decisions.

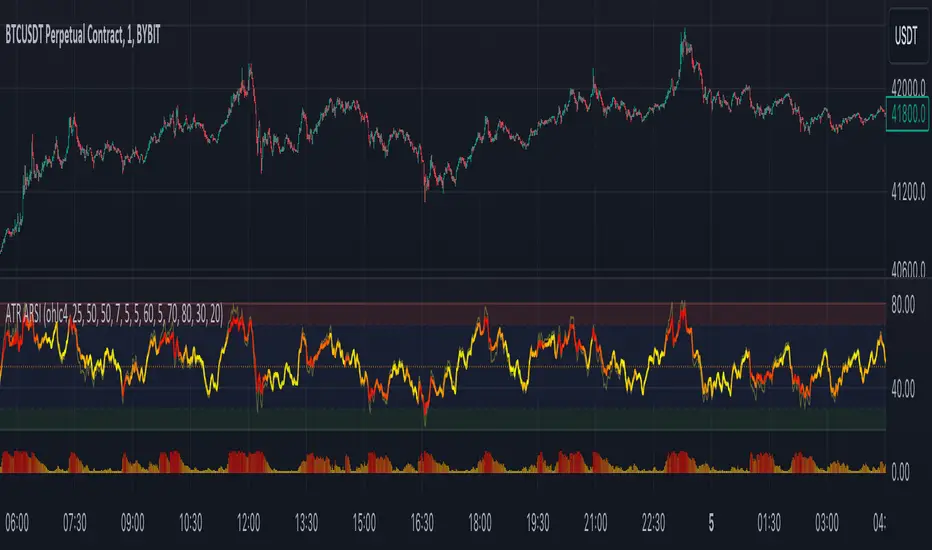
ATR Adaptive RSI OscillatorThe " ATR Adaptive RSI Oscillator " is a versatile technical analysis tool designed to help traders make informed decisions in dynamic market conditions. It combines the Relative Strength Index (RSI) with the Average True Range (ATR) to provide adaptive and responsive insights into price trends.
Key Features :
Adaptive RSI Periods : The indicator introduces the concept of adaptive RSI periods based on the ATR (Average True Range) of the market. When enabled, it dynamically adjusts the RSI calculation period, offering longer periods during high volatility and shorter periods during low volatility. This adaptability enhances the accuracy of RSI signals across varying market conditions.
Volume-Based Smoothing : The indicator includes a smoothing feature that computes a time-decayed weighted moving average of RSI values over the last two bars, using volume-based weights. This approach offers a time-sensitive smoothing effect, reducing noise for a clearer view of trend strength compared to the standard RSI.
Divergence Detection : Traders can enable divergence detection to identify potential reversal points in the market. The indicator highlights regular bullish and bearish divergences, providing valuable insights into market sentiment shifts.
Customizable Parameters : Traders have the flexibility to customize various parameters, including RSI length, adaptive mode, ATR length, and divergence settings, to tailor the indicator to their trading strategy.
Overbought and Oversold Levels : The indicator includes overbought (OB) and oversold (OS) boundary lines that can be adjusted to suit individual preferences. These levels help traders identify potential reversal zones.
The "ATR Adaptive RSI Oscillator" is a powerful tool for traders seeking to adapt their trading strategies to changing market dynamics. Whether you're a trend follower or a contrarian trader, this indicator provides valuable insights to support your decision-making process.
RSI + Divergences + Alerts [MisterMoTA]The indicator RSI + Divergences + Alerts by MisterMoTA is an RSI indicator that fills the RSI and RSI moving average with 4 different colors (growing up, falling up, falling down and rising down colors), users can customize colors from dashboard , also can be disabled the fill if the user want a standard RSI.
The dafault value of RSI is 14 and value of the moving average is 50 ( a dynamic 50 rsi line is better for trend identification than a standard 50 line) and users can change the values from indicator settings.
For detecting the divergences displayed in the indicator, I integrated in our script the default Divergences indicator from Tradingview, users can display, hide and change colors for regular and hidden divergences.
RSI indicator display also trend conditions for RSI and RSI MA, the RSI MA angle is calculated using ATR value, the slope of the RSI Noving Average can help to identify trend conditions too.
The script comes with 12 different alerts, if need different alerts please let me know in the comments and will update the script with your request:
Alert for Regular Bullish Divergence
Alert for Regular Bearish Divergence
Alert for Hidden Bullish Divergence
Alert for Hidden Bearish Divergence
Alert for RSI Overbought
Alert for RSI Extreme Overbought
"Alert for RSI Oversold
Alert for RSI Extreme Oversold
Alert for RSI Crossing Above RSI MA
Alert for RSI Crossing Bellow RSI MA
Alert for RSI Crossing Above 50
Alert for RSI Crossing Bellow 50
Please follow me for other script like this one.
Kind regards,
MisterMoTA

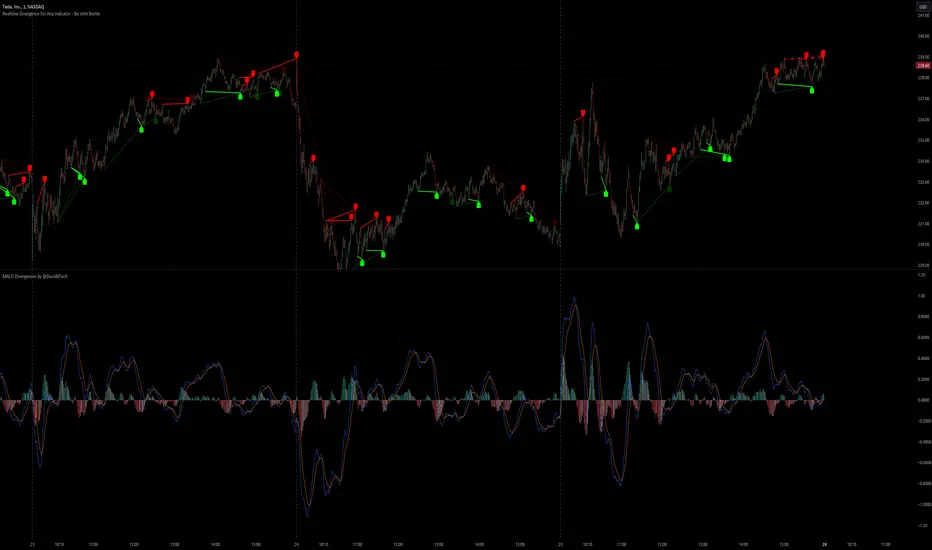
Realtime Divergence for Any Indicator - By John BartleThe main purpose of this script is to show historical and real-time divergences for any oscillating indicator. The secondary purpose is to give the user a lot of precise control over identifying divergences and determining what they are. This is an improved version of my other script which is similarly called "Realtime Divergence for Any Indicator"
There are four types of divergences that are offered:
Bull divergence
Hidden bull divergence
Bear divergence
Hidden Bear divergence
There are three types of potential(real-time) divergences which include:
1) Without right side bars for rightside pivots. Plus without waiting for the rightside pivot bar to complete
2) Without right side bars for rightside pivots. Plus with waiting for the rightside pivot bar to complete
3) With right side bars for rightside pivots. Plus without waiting for the rightside pivot right-most bar to complete
A definite divergence occurs when all specified bars are accounted for and fully formed.
Potential divergences use dashed lines and definite(historical) divergences use solid lines.
In addition to several other categories of settings to filter out unwanted divergences or manipulate the search process, this script also offers Alerts. Remember that alerts must not only be set within this scripts settings but also your "Alerts" panel on your right. It's strange but BOTH must be set for alerts to work...
Other interesting Things To Know:
1)I actually don't trade and so I have no need of a paid account. Unpaid accounts don't have the playback feature so I haven't really tested this script out very well. Sorry. Just let me know if something seems off and IF I have time I'll try to fix it.
2)Keep in mind that Pinescript limits the number of lines that can be shown at one time. This means that if your settings allow for a large number of divergence lines they will be removed from the leftward side of your chart but appear in the rightward side.
3) The time and the values for the price or oscillator are not the same things as each other nor are they physical things with physical space. This means that slopes of lines using the time as X and value as Y can not have definite angles. Consequently, under the setting "DIVERGENCES: SLOPE ANGLE EXCLUSION" YOU have to decide what slope equals what angle by using the setting called "Normalization Factor".
4) Remember that some individual settings apply to both the oscillator and price chart. This means that even if the setting's conditions are fulfilled in one they may not be fulfilled in the other.
5) Under the category "DIVERGENCES: INTERSECTION ALLOWANCE", if you set the "Measurement Type" to Relative Percentage then FYI any single given length will equate to an increasingly smaller percentage the further away from zero it is. Because of this, I think "Reletive Percentage" is probably only useful for price charts or oscillators with big values. Maybe >200 is OK ?
Errors:
1) If you get the error mentioning that the script must complete execution within X amount of time, this is because this is a big script and sometimes takes longer than your service plan's allotted time limit. You can just disable some of the settings to reduce the scripts amount of work and time. The biggest time savers will be to disable some lines and labels
2) If you get an error saying the script accessed a negative index(e.g. ) then try temporarily increasing the "Add More Array Elements" setting to 100-200. Sometimes it fixes the problem.
3) You may sometimes temporarily get an error that reads: "Pine cannot determine the referencing length of a series. Try using max_bars_back in the study or strategy function".
If this happens there are several things that you can do:
3A) Create a copy of my script. Then edit the section of code that looks like this ")//, max_bars_back = INSERT_YOUR_QUANTITY_HERE)" and transform it to look like this new code ", max_bars_back = INSERT_YOUR_QUANTITY_HERE)" then repeatedly try replacing "INSERT_YOUR_QUANTITY_HERE" with an increasingly larger number greater than 244 but less than 5000.
This method will increase your system resources and could cause other problems. Try changing the code back after a few hours and see if all is well again. It is a Pinescript limitation issue and happens when certain functions or variables don't get used at least once within the first 244 bars.
3B) Adjust your settings to hopefully find a divergence within the first 244 bars. If one is found then the problematic variables or functions should get used and the Pinescript 244 bar limitation should be temporarily resolved.
3C) Wait for X number of new bars to occur. If a divergence is eventually found within the first 244 bars that should solve the issue.
Tips:
1) If the amount that a setting changes value is undesirable for each time you click it then you can change that amount in the code. To do that, you'll need your own copy of my script. To make your own copy just click on "create a working copy" in the brown colored strip area above the code. Then within approximately the first 108 lines find the title of the setting you want to change. Then look to it's right to find the parameter called "step =". Change what the step equals to whatever you want. FYI, you can hover your mouse over the blue colored code and a popup will tell you what parameters(i.e. settings) that function(e.g. "input.int()") has available.
Divergance Based on Vortex IndicatorThe Vortex-Based Divergence Indicator represents a groundbreaking approach to analyzing market dynamics within the realm of technical analysis. Drawing inspiration from the concept of vortices and their cyclical patterns, this indicator strives to illuminate potential divergence points within financial markets, providing traders with valuable insights for informed decision-making.
At its foundation, the Vortex-Based Divergence Indicator builds upon the principles of the Vortex Indicator, a well-established tool for gauging momentum and identifying potential trend reversals. However, this innovative indicator goes a step further by focusing on the divergences that can occur between the Vortex Indicator and the actual price movements.
Divergences, which arise when the direction of an indicator's movement contradicts the direction of price action, hold paramount significance within the Vortex-Based Divergence Indicator. By integrating this indicator with other renowned oscillators, such as the Relative Strength Index (RSI) or the Moving Average Convergence Divergence (MACD), traders can augment their analytical capabilities significantly.
These complementary oscillators can corroborate or validate the signals generated by the Vortex-Based Divergence Indicator. For instance, when the Vortex-Based Divergence Indicator hints at a potential trend reversal, cross-referencing this insight with the RSI's overbought or oversold levels can enhance the accuracy of the prediction. Likewise, employing the MACD to confirm momentum shifts in conjunction with the Vortex Indicator's signals can provide a more comprehensive view of market dynamics.
It's crucial to emphasize the importance of synergy when combining these indicators. Rather than relying solely on the Vortex-Based Divergence Indicator, incorporating other oscillators acts as a checks-and-balances system, reducing false signals and enhancing the overall reliability of the trading strategy. However, prudent traders also recognize that no indicator or combination thereof is foolproof. Additional factors, such as fundamental analysis and market news, should also be considered to achieve well-rounded trading decisions.
In essence, the Vortex-Based Divergence Indicator's integration with established oscillators like RSI and MACD offers traders a powerful toolkit to navigate complex market landscapes. By leveraging the strengths of each indicator and cross-referencing their insights, traders can elevate their trading strategies to new heights of accuracy and effectiveness.

RSI Divergence Screener by zdmreThis screener tracks the following for up to 20 assets:
-All selected tickers will be screened in same timeframes (as in the chart).
-Values in table indicate that how many days passed after the last Bullish or Bearish of RSI Divergence.
For example, when BTCUSDT appears Bullish-Days Ago (15) , Bitcoin has switched to a Bullish Divergence signal 15 days ago.
Thanks to @QuantNomad and @MUQWISHI for building the base for this screener.
*Use it at your own risk
Note:
Screener shows the information about the RSI Divergence Scanner by zdmre with default settings.
Based indicator:

Momentum Oscillator, Divergences & Signals [TrendAlpha]The "Momentum, Real Time Divergences & Signals " indicator is designed to provide traders with insights into market momentum, identify potential divergences, and generate buy and sell signals. It offers a comprehensive set of features to assist traders in making informed trading decisions.
The indicator starts by calculating the momentum oscillator based on user-defined parameters.
- Traders can adjust the "Length" parameter to customize the sensitivity of the oscillator. The default value is set to 7, but it can be modified according to individual preferences.
- The "Source" parameter allows traders to select the input source for the oscillator calculation, with the default being the closing price of the asset.
- Traders have the option to display divergence lines by switching on the "Show Lines" parameter. This feature helps identify potential divergences between the oscillator and the price.
The oscillator is calculated using a two-step process. First, a smoothing function is applied to the source data using the "sma" (simple moving average) function. Then, the rate of change is computed over the specified length using the "mom" (momentum) function. Positive oscillator values indicate upward momentum, while negative values indicate downward momentum.
The indicator also generates buy and sell signals by identifying bullish and bearish divergences. A bullish divergence occurs when the oscillator is negative and crosses above zero, while a bearish divergence occurs when the oscillator is positive and crosses below zero. The indicator checks for specific conditions to confirm the divergences, such as comparing the current oscillator value with the previous value and validating the corresponding price action.
When a bullish or bearish divergence is detected, the indicator plots circles to highlight these signals on the chart. A green circle indicates a bullish signal, suggesting a potential buying opportunity, while a red circle indicates a bearish signal, suggesting a potential selling opportunity. In addition to circles, the indicator also displays labels to provide further clarity on the signals. A "Buy" label is shown for bullish signals, and a "Sell" label is shown for bearish signals.
To visually represent the divergences, the indicator plots lines connecting the corresponding points on the oscillator. A green line is drawn for bullish divergences, while a red line is drawn for bearish divergences. Traders can easily observe the divergence patterns and their relationships with the price action, aiding them in making trading decisions.
- The indicator also includes alert conditions for both bullish and bearish divergences. Traders can set up alerts to receive notifications when potential divergences occur, allowing them to take timely action.

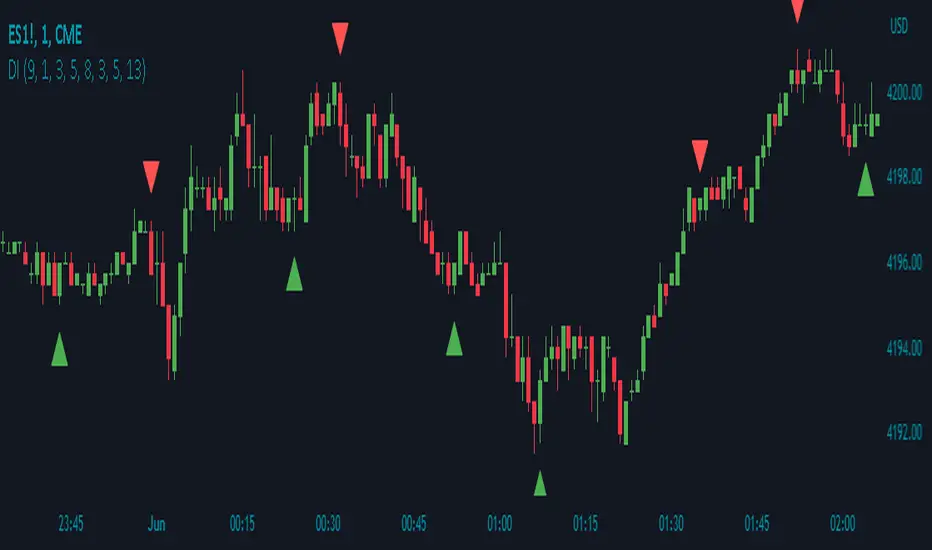
Divergence IndicatorDescription:
The Divergence Indicator (DI) is a powerful technical analysis tool designed to identify potential bullish and bearish signals based on multiple indicators, including RSI, Stochastic Oscillator, MACD, and EMA. It helps traders spot divergences between price and these indicators, indicating potential trend reversals or continuations.
How it Works:
The Divergence Indicator compares various indicators and their relationships with price to identify bullish and bearish signals. It considers conditions such as rising or falling values of the Stochastic Oscillator (%K), RSI, and MACD lines, as well as the crossover and crossunder of the MACD Line and Signal Line. Additionally, it evaluates the relationship between fast and slow Exponential Moving Averages (EMA) to detect divergences. When a bullish or bearish condition is met, circles are plotted on the chart to highlight the signals.
Usage:
To effectively utilize the Divergence Indicator, follow these steps:
1. Apply the DI indicator to your chart by adding it from the available indicators.
2. Customize the color settings to suit your preferences. The bullish and bearish colors determine the colors of the plotted circles.
3. Observe the circles plotted on the chart:
- Bullish circles indicate potential bullish signals.
- Bearish circles indicate potential bearish signals.
4. Interpret the signals provided by the indicator:
- A bullish signal may occur when there is price divergence accompanied by rising values of the Stochastic Oscillator (%K), RSI, and MACD lines, or when the MACD Line crosses above the Signal Line. Additionally, a histogram value close to zero may strengthen the signal.
- A bearish signal may occur when there is price divergence accompanied by falling values of the Stochastic Oscillator (%K), RSI, and MACD lines, or when the MACD Line crosses below the Signal Line. A histogram value close to zero may also strengthen the signal.
5. Be cautious of false signals by considering additional factors such as the relationship between the fast and slow Exponential Moving Averages (EMA). If the EMAs or MACD values do not support the identified divergence, the signal may be less reliable.
6. Combine the signals from the Divergence Indicator with other technical analysis tools, such as support and resistance levels, trend lines, or candlestick patterns, to confirm potential trade setups.
7. Implement appropriate risk management strategies, including setting stop-loss orders and position sizing, to manage your trades effectively and protect your capital.
Note: The Divergence Indicator provides valuable insights into potential trend reversals or continuations based on divergences between price and multiple indicators. However, it is recommended to use this indicator in conjunction with other technical analysis tools and perform thorough analysis before making trading decisions.
Triple RSI Indicator with ToggleThis script combines three relative strength index (RSI) indicators with different periods, and allows the user to toggle between them to generate overbought and oversold signals. The indicator is named "Triple RSI Indicator with Toggle" and has the short title "TRSI-T."
The input parameters for the RSI periods are set by the user and include a short RSI with a period of 5, a main RSI with a period of 14, and a long RSI with a period of 28. The overbought and oversold levels for each RSI can also be set by the user.
The script plots the three RSI lines on the chart and calculates a bar color based on the enabled RSI values. If all three RSI values are overbought, the bar color is set to fuchsia, if all three RSI values are oversold, the bar color is set to aqua, and if neither of these conditions is met, the bar color is set to not available.
The script also includes a fast RSI and an RSI exponential moving average (EMA) with adjustable periods. The RSI fast line is plotted along with the RSI EMA line, and a cloud fill is generated between the two lines. The fill color is based on whether the fast RSI line is above or below the RSI EMA line, with a blue color used for long signals and a pink color used for short signals.
This indicator can be used as part of a trading strategy in a number of ways. Here are a few examples:
Overbought and Oversold Signals: When the bar color of the indicator is fuchsia, it indicates that all three RSIs are overbought, and when the bar color is aqua, it indicates that all three RSIs are oversold. These signals can be used to enter a trade in the opposite direction, anticipating a reversal in price.
RSI Divergence: Traders can also look for divergences between the price and the RSI values. For example, if the price is making higher highs but the RSI values are making lower highs, it could indicate that the price trend is weakening and a reversal may be imminent. Conversely, if the price is making lower lows but the RSI values are making higher lows, it could indicate that the price trend is about to reverse.
RSI Cloud Signals: The cloud fill generated between the fast RSI and RSI EMA lines can be used to generate trading signals. When the fast RSI line is above the RSI EMA line and the fill color is blue, it can be a signal to go long. When the fast RSI line is below the RSI EMA line and the fill color is pink, it can be a signal to go short.
If anybody has some interesting thoughts on how to improve it, let me know!!

Divergence for Many [Dimkud - v5]Strategy is based on "Divergence for Many Indicators v4 ST" strategy by CannyTolany01
which is based on "Divergence for Many Indicator" indicator by LonesomeTheBlue
This strategy is searching for divergences on 18 indicators which you can select and optimise one by one.
Additionally you can connect any other External Indicator value. (just add this indicator the the chart and select option in settings)
To the original indicator/strategy I have added 9 additional indicators:
( Money Flow Index, Williams_Vix, Stochastic RSI , SMI Ergodic Oscillator, Volume Weighted MACD , Bull Bear Power, Balance of Power , Relative Volatility Index , Logistic Settings).
Converted strategy to v5 of Pine Script.
Added Static SL/TP in percents (%).
Added filters to filter enters:
1. Volume Weighted MACD - Multi-TimeFrame Filter
(It checks for histogram to falling or rising for a set periods of bars)
2. Money Flow Index - Multi-TimeFrame Filter
(It checks if MFI Oscillator is in the set diapason.
Also It checks if MFI is falling or rising for a set periods of bars )
3. ATR filter
(check changes in fast ATR to slow ATR )
Strategy shows good backtest results on many crypto tokens on 45m - 1h periods. (with parameters optimisation for every indicator)
To find best parameters - you can enable indicators one-by one, and optimise best parameters for each of them.
Then enable all indicators with successful results.
Optimise SL/TP.
Then try to enable and optimise filters (channels etc.)
The better is to optimise parameters separately for Short and Long trading. And run two separate bots (in settings enable only Long or only Short.)
Updates:
- Added visualisation for open trades (SL/TP)
- Added Volatility filter by ATR with many options for tests.
- Fixed some small bugs.
- Added second RSI filter (you can use two RSIs with different TF or settings)
- Updated ATR volatility and MFI filter. Removed non-effective options
- Added CCI filter
- Added option to Enable/Disable visualisation of TP/SL on chart
- Fixed one small quick bug. ("ATR filter short" was not working)
- Added Super Trend filter
- Added Momentum filter
- Added Volume Filter
- All "request.security" MultiTimeFrame calls changed to 100% non-repait function "f_security()"

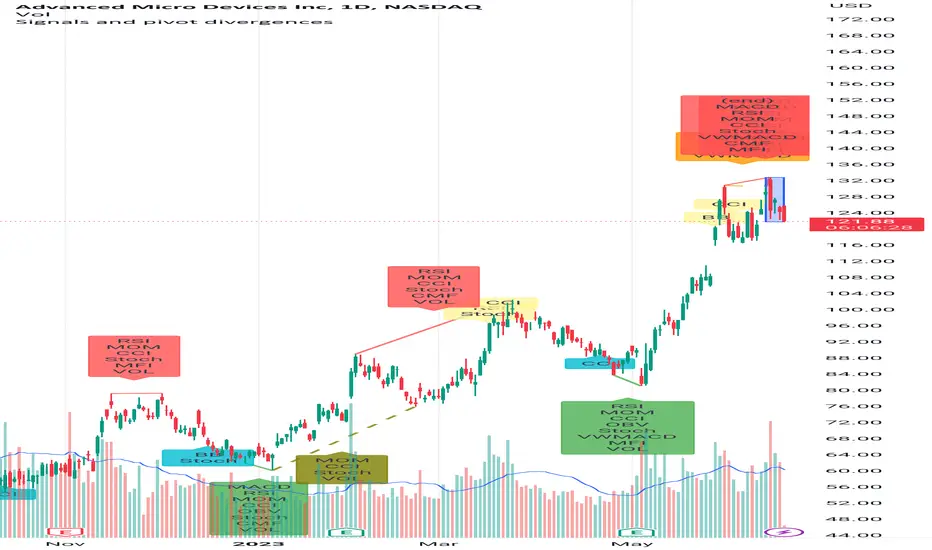
Signals and pivot divergencesScript that shows buy and sell signals for multiple indicators and divergences when there's a pivot in the price chart. The defaults are from my own laboration and don't hesitate to share your settings!
Best of trading luck!
[@btc_charlie] Trader XO Macro Trend ScannerWhat is this script?
This script has two main functions focusing on EMAs (Exponential Moving Average) and Stochastic RSI.
EMAs
EMAs are typically used to give a view of bullish / bearish momentum. When the shorter EMA (calculated off more recent price action) crosses, or is above, the slower moving EMA (calculated off a longer period of price action), it suggests that the market is in an uptrend. This can be an indication to either go long on said asset, or that it is more preferable to take long setups over short setups. Invalidation on long setups is usually found via price action (e.g. previous lows) or simply waiting for an EMA cross in the opposite direction (i.e. shorter EMA crosses under longer term EMA).
This is not a perfect system for trade entry or exit, but it does give a good indication of market trends. The settings for the EMAs can be changed based on user inputs, and by default the candles are coloured based on the crosses to make it more visual. The default settings are based on “Trader XO’s” settings who is an exceptional swing trader.
RSI
Stochastic RSI is a separate indicator that has been added to this script. RSI measures Relative Strength (RSI = Relative Strength Index). When RSI is <20 it is considered oversold, and when >80 it is overbought. These conditions suggests that momentum is very strong in the direction of the trend.
If there is a divergence between the price (e.g. price is creating higher highs, and stoch RSI is creating lower highs) it suggests the strength of the trend is weakening. Whilst this script does not highlight divergences, what it does highlight is when the shorter term RSI (K) crosses over D (the average of last 3 periods). This can give an indication that the trend is losing strength.
Combination
The EMAs indicate when trend shifts (bullish or bearish).
The RSI indicates when the trend is losing momentum.
The combination of the two can be used to suggest when to prefer a directional bias, and subsequently shift in anticipation of a trend reversal.
Note that no signal is 100% accurate and an interpretation of market conditions and price action will need to be overlayed to
Why is it different to others?
I have not found other scripts that are available in this way visually including alerts when Stoch RSI crosses over/under the extremes; or the mid points.
Whilst these indicators are default, the combination of them and how they are presented is not and makes use of the TradingView colouring functionalities.
What are the features?
Customise the variables (averages) used in the script.
Display as one EMA or two EMAs (the crossing ones).
Alerts on EMA crosses.
Alerts on Stoch RSI crosses - slow/fast, upper, lower areas.
- Currently set on the chart to show alerts when Stoch RSI is above 80, then falls below 80 (and colours it red).
Customisable colours.
What are the best conditions for this?
It is designed for high timeframe charts and analysis in crypto, since crypto tends to trend.
It can however be used for lower timeframes.
Disclaimer/Notes:
I have noticed several videos appearing suggesting that this is a "100% win rate indicator" .
NO indicator has 100% win rate.
An indicator is an *indicator* that is all.
Please use responsibly and let me know if there are any mods or updates you would like to see.

True Momentum OscillatorThe True Momentum Oscillator (TMO) calculates the delta of the price using the open and close. We have taken the true momentum oscillator a step further and have added the momentum of the main signal (TMO) and the smooth signal line. We believe this helps give a clearer picture of price momentum and helps verify crossovers of the TMO and the smooth signal line. The momentum lines can also help confirm a divergence of the TMO. We have also added multiple moving average options so the user can customize the TMO to suit their needs.
TMO- Green when above Smooth Signal Line, red when below Smooth Signal Line
Smooth Signal- Gray Line
Histogram- TMO-Smooth Signal
TMO Momentum- Orange line
Smooth Signal Momentum- Yellow line
Overbought/Oversold regions- Gray highlighted boundaries
The TMO has defined overbought and oversold regions where either a crossover signal or divergence in the oscillator itself can be taken as a signal. Similar to the MACD, a crossover of the zero line by the TMO can also be utilized as a signal.

RSI DivergenceWhat is "RSI Divergence"?
"RSI Divergence" is a indicator that find RSI divergence automatically.
What it does?
When it finds an RSI divergence, it draws a line on the indicator.
How it does it?
The lines are found using the least squares method. If the signs of the linear regression on the graph and the linear regression plotted on the RSI are different, this is considered divergence.
How to use it?
RSI lenght = RSI lenght
source = source of RSI
RSI Divergence Lenght = lenght of lines that draws on indicator
zoom = zoom
examples:

Wavetrend in Dynamic Zones with Kumo Implied VolatilityI was asked to do one of those, so here we go...
As always free and open source as it should be. Do not pay for such indicators!
A WaveTrend Indicator or also widely known as "Market Cipher" is an Indicator that is based on Moving Averages, therefore its an "lagging indicator". Lagging indicators are best used in combination with leading indicators. In this script the "leading indicator" component are Daily, Weekly or Monthly Pivots . These Pivots can be used as dynamic Support and Resistance , Stoploss, Take Profit etc.
This indicator combination is best used in larger timeframes. For lower timeframes you might need to change settings to your liking.
The general Wavetrend settings are the same that are used in Market Cipher, Market Liberator and such popular indicators.
What are these circles?
-These are the WaveTrend Divergences. Red for Regular-Bearish. Orange for Hidden-Bearish. Green for Regular-Bullish. Aqua for Hidden-Bullish.
What are these white, orange and aqua triangles?
-These are the WaveTrend Pivots. A Pivot counter was added. Every time a pivot is lower than the previous one, an orange triangle is printed, every time a pivot is higher than the previous one an aqua triangle is printed. That mimics a very common way Wavetrend is being used for trading when using those other paid Wavetrend indicators.
What are these Orange and Aqua Zones?
-These are Dynamic Zones based on the indicator itself, they offer more information than static zones. Of course static lines are also included and can be adjusted.
What are the lines between the waves?
-This is a Kumo Cloud Implied Volatility indicator. It is color coded and can be used to indicate if a major market move/bottom/top happened.
What are those numbers on the right?
-The first number is a Bollinger Band indicator that shows if said Bollinger Band is in a state of Oversold/Overbought, the second number is the actual Bollinger Band Width that indicates if the Bollinger Band squeezes, normally that happens right before the market makes an explosive move.
Please keep in mind that this indicator is a tool and not a strategy, do not blindly trade signals, do your own research first! Use this indicator in conjunction with other indicators to get multiple confirmations.

Adaptive Fisherized CMFIntroduction
Heyo, here I made a normalized Chaikin Money Flow (CMF) indicator with Inverse Fisher Transform (IFT) and some smoothing techniques.
I had to normalize the indicator in order to fit it to the IFT range (-1 -> 1).
Moreover, the good old adaptive mode is also included in this indicator. It uses Ehlers superb dominant cycle techniques.
It also has divergence detection, several options for individualisation and doesn't repaint.
Usage
www.investopedia.com
Signals
CMF above 0 => bullish market
CMF below 0 => bearish market
(You can also use the inner bands instead of the zero line, to make these signals more precise)
Bullish regular/hidden divergence => long
Bearish regular/hidden divergence => short
Enjoy guys!
PS: I really would like to hear some feedback of you.
Divergence Finder [Multigrain]█ OVERVIEW
This indicator is a divergence finder, designed to be overlayed on top of any oscillator. By utilizing an Exponential Moving Average, rather than built-in pivot functions, this allows for insignificant pivots of the oscillator to be filtered out. Additionally, by sampling more than just the previous oscillator pivot, this allows for divergences to be found that would otherwise be overlooked through other methods.
█ CONCEPTS
Interim Price Threshold
A new metric used when determining valid divergences is the Interim Price Threshold (IPT). The IPT is the maximum percent delta the price is allowed to "poke-through" the divergent line at any given time.
Interim Oscillator Threshold
Similar to the Interim Price Threshold, the Interim Oscillator Threshold (IOT) is the maximum percent delta the oscillator is allowed to "poke-through" the divergent line at any given time.
Dynamic Midline
Commonly a static midline is utilized when determining whether a divergence may be bullish or bearish. By utilizing the built-in percentile nearest rank function, the midline is automatically and dynamically determined based on the previous 250 bars. As a result certain divergences which may otherwise be overlooked will be discovered.
█ SETTINGS
Oscillator Source: The oscillator in which you want find divergences from. Default to a MACD oscillator when unchanged.
Price Source: The price source in which you want to find divergences from.
Moving Average Length: The length of the exponential moving average used when determining the pivot points of the selected oscillator.
█ USAGES
Divergence in technical analysis can indicate a significant bullish or bearish price move. A bullish divergence occurs when an asset's price makes a new low while an indicator begins to rise. A bearish divergence occurs when the price makes a new high but the indicator under consideration makes a lower high.

Relative Strength Index (RSI) + Realtime DivergencesRelative Strength Index (RSI) + Realtime Divergences
This version of the RSI indicator includes the following features:
- Optional divergence lines drawn directly onto the oscillator in realtime.
- Configurable alerts to notify you when divergences occur.
- Configurable lookback periods to fine tune the divergences drawn in order to suit different trading styles and timeframes.
- Background colouring option to indicate when the RSI oscillator has crossed above or below its centerline.
- Alternate timeframe feature allows you to configure the oscillator to use data from a different timeframe than the chart it is loaded on.
- Fadeout oscillator feature will fade out all but the most recent history, leaving your chart free of visual noise.
- Flip oscillator feature can be used with the Tradingview 'Flip chart' feature (Alt+i) in order to flip both the chart and the oscillator, too. This feature is to help traders manually spot divergences that may have a strong natural bias in one direction.
- Optional centerline and range bands.
- Various optional moving average types, bollinger bands etc.
This indicator adds additional features onto the standard RSI whose core calculations remain unchanged. Namely, the configurable option to automatically, quickly and clearly draw divergence lines onto the oscillator for you as they occur in realtime. It also has the addition of unique alerts, so you can be notified when divergences occur without spending all day watching the charts. Furthermore, this version of the RSI comes with configurable lookback periods, which can be configured in order to adjust the sensitivity of the divergences, in order to suit shorter or higher timeframe trading approaches.
What is the Relative Strength Index ( RSI )?
Investopedia describes the Relative Strength Index as follows:
“The relative strength index (RSI) is a momentum indicator used in technical analysis. RSI measures the speed and magnitude of a security's recent price changes to evaluate overvalued or undervalued conditions in the price of that security. The RSI is displayed as an oscillator (a line graph) on a scale of zero to 100. The indicator was developed by J. Welles Wilder Jr. and introduced in his seminal 1978 book, New Concepts in Technical Trading Systems.
The RSI can do more than point to overbought and oversold securities. It can also indicate securities that may be primed for a trend reversal or corrective pullback in price. It can signal when to buy and sell. Traditionally, an RSI reading of 70 or above indicates an overbought situation. A reading of 30 or below indicates an oversold condition.”
The RSI is also commonly used to spot divergences.
You can read more about the RSI and its calculations here
What are divergences?
Divergence is when the price of an asset is moving in the opposite direction of a technical indicator, such as an oscillator, or is moving contrary to other data. Divergence warns that the current price trend may be weakening, and in some cases may lead to the price changing direction.
There are 4 main types of divergence, which are split into 2 categories;
regular divergences and hidden divergences. Regular divergences indicate possible trend reversals, and hidden divergences indicate possible trend continuation.
Regular bullish divergence: An indication of a potential trend reversal, from the current downtrend, to an uptrend.
Regular bearish divergence: An indication of a potential trend reversal, from the current uptrend, to a downtrend.
Hidden bullish divergence: An indication of a potential uptrend continuation.
Hidden bearish divergence: An indication of a potential downtrend continuation.
How do traders use divergences in their trading?
A divergence is considered a leading indicator in technical analysis , meaning it has the ability to indicate a potential price move in the short term future.
Hidden bullish and hidden bearish divergences, which indicate a potential continuation of the current trend are sometimes considered a good place for traders to begin, since trend continuation occurs more frequently than reversals, or trend changes.
When trading regular bullish divergences and regular bearish divergences, which are indications of a trend reversal, the probability of it doing so may increase when these occur at a strong support or resistance level . A common mistake new traders make is to get into a regular divergence trade too early, assuming it will immediately reverse, but these can continue to form for some time before the trend eventually changes, by using forms of support or resistance as an added confluence, such as when price reaches a moving average, the success rate when trading these patterns may increase.
Typically, traders will manually draw lines across the swing highs and swing lows of both the price chart and the oscillator to see whether they appear to present a divergence, this indicator will draw them for you, quickly and clearly, and can notify you when they occur.
Setting alerts.
With this indicator you can set alerts to notify you when any/all of the above types of divergences occur, on any chart timeframe you choose.
Configurable pivot periods.
You can adjust the default pivot periods to suit your prefered trading style and timeframe. If you like to trade a shorter time frame, lowering the default lookback values will make the divergences drawn more sensitive to short term price action.
Disclaimer: This script includes code from the stock RSI by Tradingview as well as the Divergence for Many Indicators v4 by LonesomeTheBlue.
