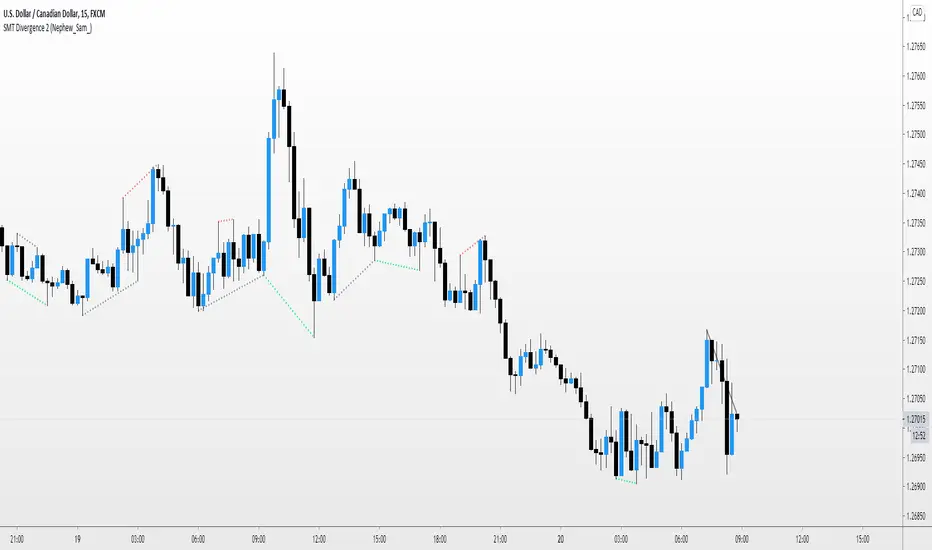
SMT Divergence 2 (Nephew_Sam_)(Top Chart Version)
Similar to the first version, this one plots divergence lines on the main chart instead of a separate panel.
Plots divergence between correlated pairs.
Ie. EURUSD - XAUUSD - DXY
NJDJPY - AUDJPY - NZD Index
XAU - XAG
USOIL - UKOIL
BTCUSD - ALTPERP
Divergência
SMT Divergence (Nephew_Sam_)(Bottom Version)
Plots divergence between correlated pairs.
Ie. EURUSD - XAUUSD - DXY
NJDJPY - AUDJPY - NZD Index
XAU - XAG
USOIL - UKOIL
BTCUSD - ALTPERP

Reverse MACD Cross + Histogram DivergenceThe Reverse MACD Cross + Histogram Divergence is in essence the same MACD you all know and love with two added features which can be used to assist the end-user in their decision making for entry, exit and risk management.
The first feature is a Reverse MACD Cross price, which very basically is a smoothed reverse engineered calculation of the MACD Signal Line in relation to the current price level. At a glance this can then be used to determine the closing price level needed in order to cross the MACD either up or down.
The second feature is visual MACD Histogram regular as well as hidden divergences. This feature was added as MACD histogram divergences are not as easy to
spot as on the RSI for example, and can help the end-user train their eyes in order to spot them more accurately.
Divergence colors and description:
------------------------------------------
Green : Regular Bullish Divergence
White : Hidden Bullish Divergence
Red : Regular Bearish Divergence
Orange : Hidden Bearish Divergence
Optional settings include:
-------------------------------
1.) Show the Histogram only (Hide the MACD and Signal lines)
2.) Show/Hide the Reverse MACD Cross label
3.) Change the Reverse MACD Cross label text size
4.) Change the Reverse MACD Cross label left margin
5.) Show/hide the Reverse MACD Cross label currency
6.) Change the Reverse MACD Cross label decimal value
7.) Show/hide the MACD Histogram Divergence lines
8.) Change the MACD Histogram Divergence line offset
9.) Show/hide the MACD Histogram Divergence arrows
10.) Change the MACD Histogram Divergence arrow offset
11.) Change the MACD Histogram Divergence lookback (No. of bars to lookback)
Please PM me to obtain access.

Cyclic Smoothed RSI with Motive-Corrective Wave Indicator
This indicator uses the cyclic smoothed Relative Strength Index (cRSI) instead of the traditional Relative Strength Index (RSI). See below for more info on the benefits to the cRSI.
My key contributions
1) A Weighted Moving Average (WMA) to track the general trend of the cRSI signal. This is very helpful in determining when the equity switches from bullish to bearish, which can be used to determine buy/sell points. This is then is used to color the region between the upper and lower cRSI bands (green above, red below).
2) An attempt to detect the motive (impulse) and corrective and waves. Corrective waves are indicated A, B, C, D, E, F, G. F and G waves are not technically Elliot Waves, but the way I detect waves it is really hard to always get it right. Once and a while you could actually see G and F a second time. Motive waves are identified as s (strong) and w (weak). Strong waves have a peak above the cRSI upper band and weak waves have a peak below the upper band.
3) My own divergence indicator for bull, hidden bull, bear, and hidden bear. I was not able to replicate the TradingView style of drawing a line from peak to peak, but for this indicator I think in the end it makes the chart cleaner.
There is a latency issue with an indicator that is based on moving averages. That means they tend to trigger right after key events. Perfect timing is not possible strictly with these indicators, but they do work very well "on average." However, my implementation has minimal latency as peaks (tops/bottoms) only require one bar to detect.
As a bit of an Easter Egg, this code can be tweaked and run as a strategy to get buy/sell signals. I use this code for both my indicator and for trading strategy. Just copy and past it into a new strategy script and just change it from study to a strategy, something like this:
strategy("cRSI + Waves Strategy with VWMA overlay", overlay=overlay)
The buy/sell code is at the end and just needs to be uncommented. I make no promises or guarantees about how good it is as a strategy, but it gives you some code and ideas to work with.
Tuning
1) Volume Weighted Moving Average (VWMA): This is a “hidden strategy” feature implemented that will display the high-low bands of the VWMA on the price chart if run the code using “overlay = true”.
- If the equity does not have volume, then the VWMA will not show up. Uncheck this box and it will use the regular WMA (no volume).
- defines how far back the WMA averages price.
2) cRSI (Black line in the indicator)
- Increase to length that amount of time a band (upper/lower) stays high/low after a peak. Reduce the value to shorten the time. Just increment it up/down to see the effect.
- defines how far back the SMA averages the cRSI. This affects the purple line in the indicator.
- defines how many bars back the peak detector looks to determine if a peak has occurred. For example, a top is detected like this: current-bar down relative to the 1-bar-back, 1-bar-back up relative to 2-bars-back (look back = 1), c) 2-bars-back up relative to 3-bars-back (lookback = 2), and d) 3-bars-back up relative to 4-bars-back (lookback = 3). I hope that makes sense. There are only 2 options for this setting: 2 or 3 bars. 2 bars will be able to detect small peaks but create more “false” peaks that may not be meaningful. 3 bars will be more robust but can miss short duration peaks.
3) Waves
- The check boxes are self explanatory for which labels they turn on and off on the plot.
4) Divergence Indicators
- The check boxes are self explanatory for which labels they turn on and off on the plot.
Hints
- The most common parameter to change is the . Different stocks will have different levels of strength in their peaks. A setting of 2 may generate too many corrective waves.
- Different times scales will give you different wave counts. This is to be expected. A counter impulse wave inside a corrective wave may actually go above the cRSI WMA on a smaller time frame. You may need to increase it one or two levels to see large waves.
- Just because you see divergence (bear or hidden bear) does not mean a price is going to go down. Often price continues to rise through bears, so take note and that is normal. Bulls are usually pretty good indicators especially if you see them on C,E,G waves.
----------------------------------------------------------------------------------------------------------------------------
cyclic smoothed RSI (cRSI) indicator
----------------------------------------------------------------------------------------------------------------------------
The “core” code for the cyclic smoothed RSI (cRSI) indicator was written by Lars von Theinen and is subject to the terms of the Mozilla Public License 2.0 at mozilla.org Copyright (C) 2017 CC BY, whentotrade / Lars von Thienen. For more details on the cRSI Indicator:
The cyclic smoothed RSI indicator is an enhancement of the classic RSI, adding
1) additional smoothing according to the market vibration,
2) adaptive upper and lower bands according to the cyclic memory and
3) using the current dominant cycle length as input for the indicator.
It is much more responsive to market moves than the basic RSI. The indicator uses the dominant cycle as input to optimize signal, smoothing, and cyclic memory. To get more in-depth information on the cyclic-smoothed RSI indicator, please read Decoding The Hidden Market Rhythm - Part 1: Dynamic Cycles (2017), Chapter 4: "Fine-tuning technical indicators." You need to derive the dominant cycle as input parameter for the cycle length as described in chapter 4.
Hope this helps and good luck.

Divergence TemplateDivergence Template!
This public indicator helps you to find as many divergences with as many indicators you like, without the long hassle of knowing and coding the divergence yourself.
Just replace the "Divergence Condition" with your formula and give it a title in the second step, everything simply illustrated to someone without any coding experience!
This example is calculating A/D Divergences.
Let's make 2021 great!
With help of @madoqa.

Non-Rescaled RSI█ OVERVIEW
Relative Strength Index is a momentum oscillator developed by J. Wilder. The original version of RSI rescaled the relative strength measurement to range. While the rescaling is useful for readability, This non-rescaled version tells the exact average relative strength of the movement for the past period, and give another way to put the relative strength reading into context of current market condition.
█ Description & How To Use
1. The (+/-) in relative strength value indicates the direction
Example 1: Relative Strength of 2.33 means average gain is 2.33 bigger than average loss for the past period (Equivalent to RSI 70)
Example 2: Relative Strength of -2.33 means average loss is 2.33 bigger than average gain for the past period (Equivalent to RSI 30)
Example 3: Relative Strength of 0 means average gain is equal to average loss for the past period (Equivalent to RSI 50)
Look at comparison below:
2. You can use it exactly how you would use RSI: Overbought/Oversold state, Divergence, Trend identification, Failure Swings etc..
█ Features
- Overbought/Oversold line still maintainable as standard RSI level (70,30) in user input screen. The script will recalculate and plot the ob/os level accordingly
- Value Label to indicate the RSI and RS value
- Custom Gradient Color Scheme
█ Limitation
The Relative Strength absolute value is capped at 20 to avoid ratio value too big(or too small). This is enough to get accurate equivalent of RSI reading between 5-95
█ Disclaimer
Past performance is not an indicator of future results.
My opinions and research are my own and do not constitute financial advice in any way whatsoever.
Nothing published by me constitutes an investment/trading recommendation, nor should any data or Content published by me be relied upon for any investment/trading activities.
I strongly recommends that you perform your own independent research and/or speak with a qualified investment professional before making any financial decisions.

Divergence for Many Indicators v4Hello Traders,
Here is my new year gift for the community, Digergence for Many Indicators v4 . I tried to make it modular and readable as much as I can. Thanks to Pine Team for improving Pine Platform all the time!
How it works?
- On each candle it checks divergences between current and any of last 16 Pivot Points for the indicators.
- it search divergence on choisen indicators => RSI , MACD , MACD Histogram, Stochastic , CCI , Momentum, OBV, VWMACD, CMF and any External Indicator !
- it checks following divergences for 16 pivot points that is in last 100 bars for each Indicator.
--> Regular Positive Digergences
--> Regular Negative Digergences
--> Hidden Positive Digergences
--> Hidden Negative Digergences
- for positive divergences first it checks if closing price is higher than last closing price and indicator value is higher than perious value, then start searching divergence
- for negative divergences first it checks if closing price is lower than last closing price and indicator value is lower than perious value, then start searching divergence
Some Options:
Pivot Period: you set Pivot Period as you wish. you can see Pivot Points using "Show Pivot Points" option
Source for Pivot Points: you can use Close or High/Low as source
Divergence Type: you can choose Divergence type to be shown => "Regular", "Hidden", "Regular/Hidden"
Show Indicator Names: you have different options to show indicator names => "Full", "First Letter", "Don't Show"
Show Divergence Number: option to see number of indicators which has Divergence
Show Only Last Divergence : if you enable this option then it shows only last Positive and Negative Divergences
you can include any External Indicator to see if there is divergence
- enable "Check External Indicator"
- and then choose External indicator name in the list, "External Indicator"
- External indicator name is shown as Extrn
- related external indicator must be added before enabling this option
Coloring, line width and line style options for different type of divergences.
Following Alerts added:
- Positive Regular Divergence Detected
- Negative Regular Divergence Detected
- Positive Hidden Divergence Detected
- Negative Hidden Divergence Detected
Now lets see some examples:
Hidden Divergences:
Regular and Hidden Divergences together:
Showing first letters of indicators:
You can see only the number of indicators which has divergence:
You can see only divergence lines without indicators names and numbers:
option to used different label/line/text colors:
You have option to see only last divergences:
You can change Pivot Period, in following example Pivot Period = 15:
You can use Close or High/Low as Source for Divergence
You can include external indicators and get divergences on it:
Wish you all a happy new year!
Enjoy!

Mr_tahlilgar RSI 3 line with DivergenceThis oscillator organized by three Line , control zone and Divergence Line
1:) Fast Line
2:) Slow Line
3:) Heavy Line
4:) Neutral Zone between Fibo 38.2% & 61.8%
5:) Bullish Control Zone
6:) Bearish Control Zone
7:) Super Bullish Control Zone
8:) Super Bearish Control Zone
9:) Divergence Line
And there are three theories of finding tradable signals behind those parts .
The first and the most simplest theory is the situation that the Fast Line has the possibility to be supported by Slow or Heavy Lines and basically reverse its slope !!
But there are some rules and notes for this theory ... First of all the accuracy and rate of that is variable in three main categories of situation
1:) with or without price action reversal structure like reversal pattern (Head&Shoulder , Quasimodo , .... )
2:) with or without regular divergence
3:) in which control zone ?
So basically the most powerful setup occurs when price action is already in the reversal structure and the potential to have at least one drive of regular divergence exist and also the Fast Line is in the opposite control zone of the current time frame trend .... so obviously if one of those rules will not be satisfied so the signal will be the less value
The second theory is the signals that occur after the reversal, obviously a sign of trend continuation. there are two type of that you can use with this oscillator
The first one happens when price reverses its trend and this oscillator is moving to the neutral zone ... so if at least one drive of hidden divergence exist the neutral zone will have good possibility to reverse the slope of the oscillator obviously this would happen usually after hidden divergence confirmed .
and the second one is basically the first type but after the reversal Subsequently in the outside of the bullish / bearish control zone ... those kinds of signals are NOT the reversal potency signal at all !! they designed for trend continuation... be careful of them and try trade with your old friend trend ! .... also The existence of hidden divergences will be better for trade in this kind of signals
The third theory is about the continuity of the current trend
When the fast line moves towards the neutral or descending area but the heavy slow line continues to move positively and upwards, it means that the movement can continue in the same flow and trend as it is. And vice versa

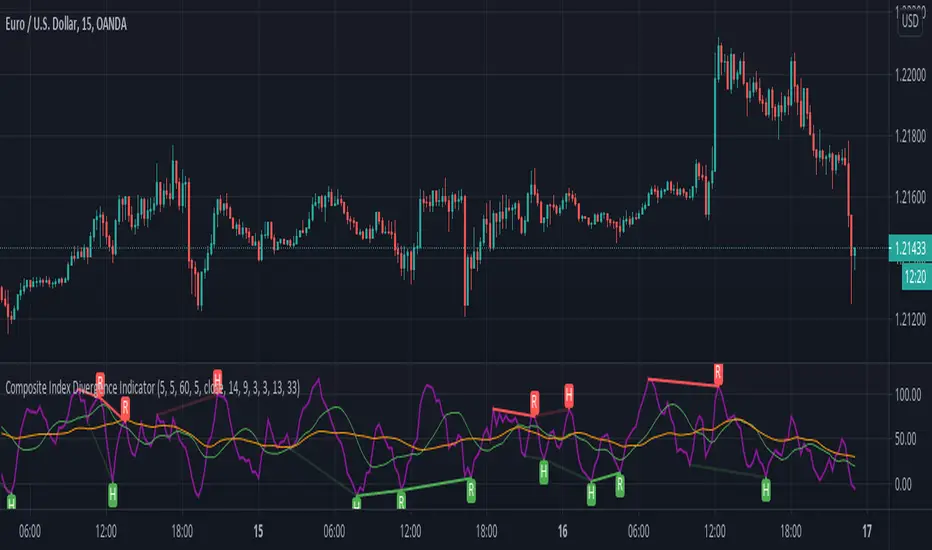
Composite Index Divergence IndicatorComposite Index by Constance Brown mixed with built-ins Divergence Indicator
useful indicator to find divergence
this script find divergence automatically for you
[YummyProfit] RSI DivergenceHi everyone,
This scripts are used for learning and research purposes. THESE ARE NOT BUY/SELL SIGNALS.
If you have a better idea, share it here or contact me via msg. I will improve this script better in next version.
Settings:
Basically, you only need to care about "Lookback Level For Divs", this is the number of previously adjacent peak.
Feel free to use, share, comment & feedback.
Get indicator trading signals at yummyprofit.
Good luck!

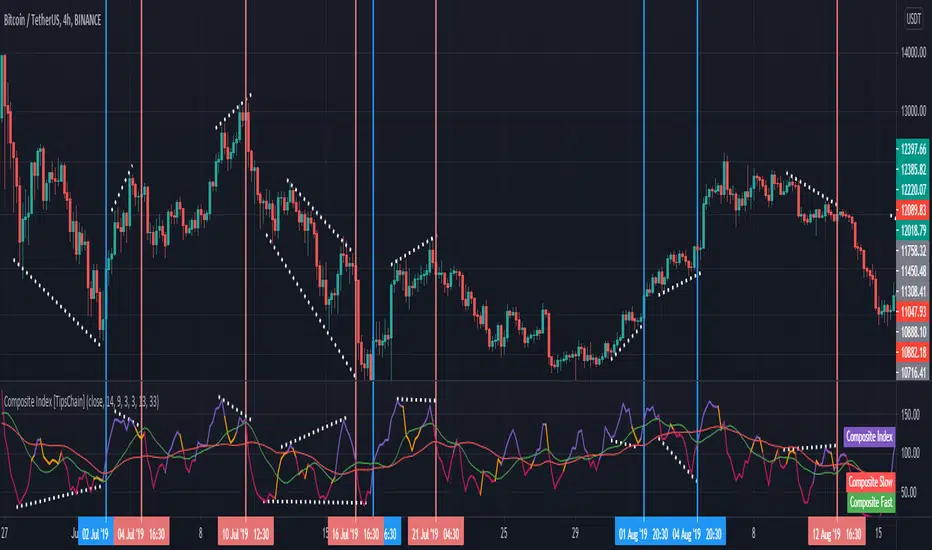
Composite Index [TipsChain]This is a formula Ms Brown developed to identify divergence failures with in the RSI . This also highlights the horizontal support levels with in the indicator area.
The Composite Index study comprises 2 momentum indicators on the RSI which are smoothed using a moving average. Control of the upper and lower indicators can be used to adjust the periods represented by each through the Object Properties dialog box for the study.
The Composite Index is an oscillator that will warn when the RSI is failing to detect a price trend reversal by forming divergences with the RSI. It can be used in any time frame or market.
Usage:
1. Check hidden and regular divergences on RSI+COMPOSITE_INDEX and PRICE+COMPOSITE_INDEX.
2. After finding divergence wait for COMPOSITE_INDEX to cross under/over it's moving averages to trigger.
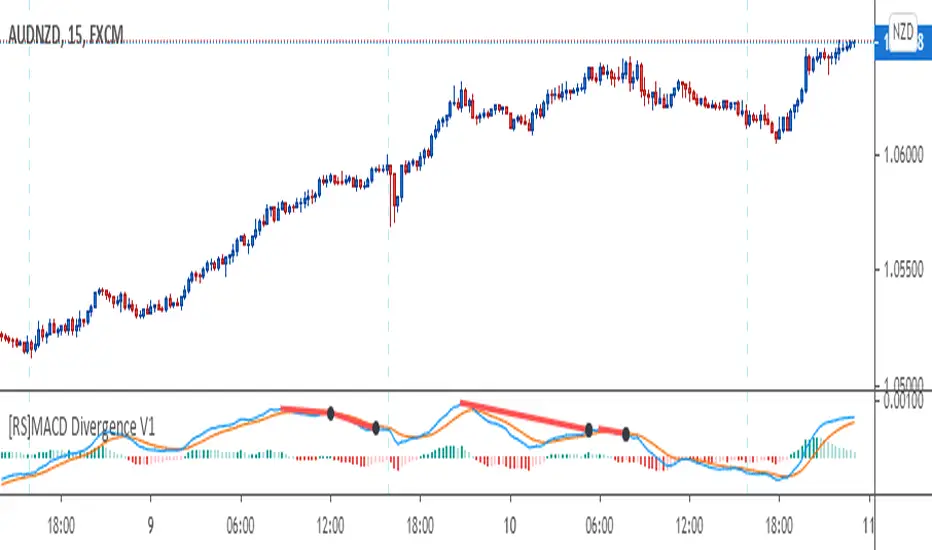
[RS]MACD Divergence V1This oscilator was created by Ricardo Santos using MACD's histogram as the series to find low and high fractals and from there find and plot divergences.
I just modified it a little bit to make it to look more like the MACD public library indicator and use the actual MACD series (instead of the histogram) to find the fractals and from there plot divergences.
I did this to make it easier for me and other fellow students of a Forex school where we use these type of divergences to find patterns.
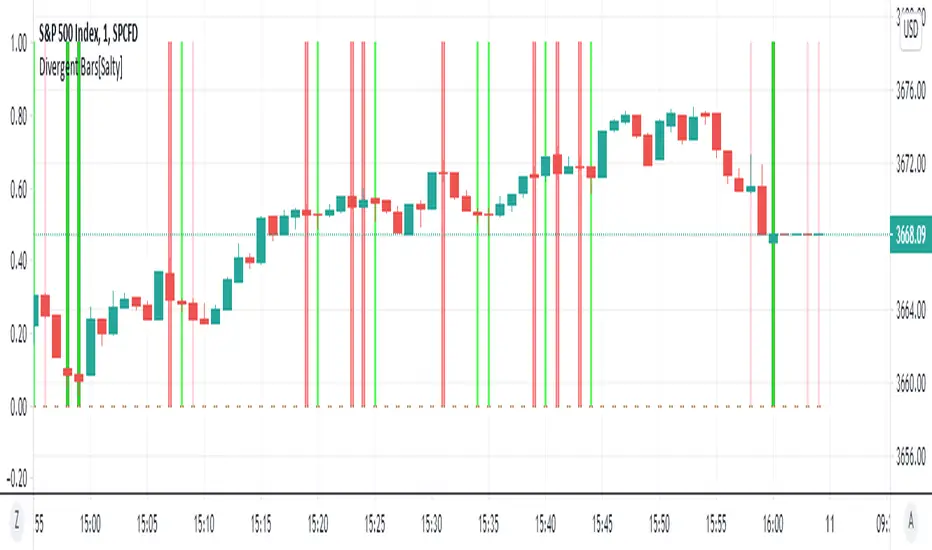
Divergent Bars[Salty]Updated an existing Divergent Bar script to be able to show all divergent bars. There are 2 set of divergent bars that can be turned on. The original one based on price and alligator lines, and a new second one that shows ALL divergent bars. The second set has lighter lines and colors to differentiate them from the filtered alligator divergent bars.
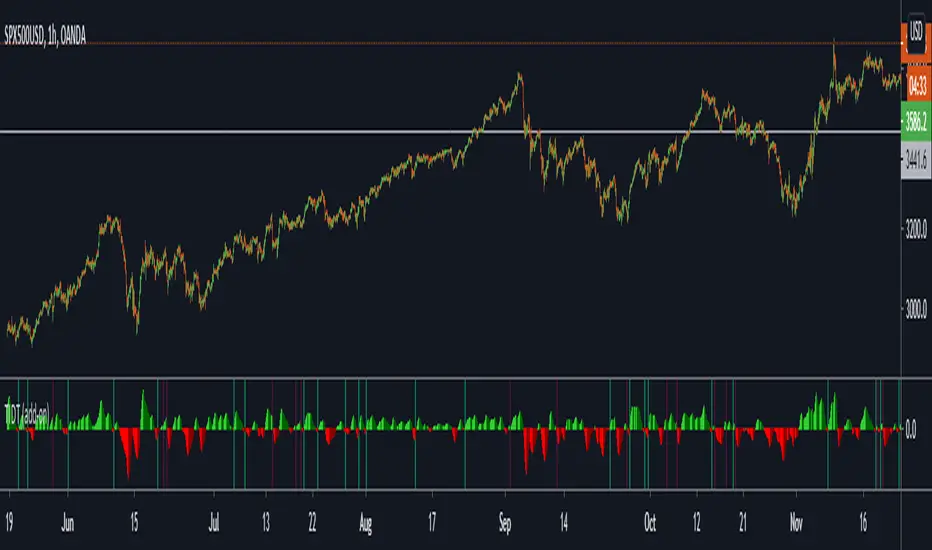
Time Divergence - TDV [SHK]A truly time based indicator to check the strength of the asset based on "Time". The main idea came to my mind about 2 years ago, When i was counting the candles in an impulse move and comparing it to number of retracement candles .
So i got a period (13 for example) and checked the price change between the 13 candles, Then the space between those two points (the price!) is divided to 13 (the time!).
The result can be analyzed by checking the Divergence, or checking the Linear Regression, or bollinger band, or trend lines and channels, or ...
You can also test different periods.
I'm price action trader and i don't use indicators, But i publish my past works for other users.
Hope you find new usage methods and share them in comments.

(VIP) MACD & Stochastic Alignment Oscillator v2Oscillator is combining MACD with Stochastic oscillator. When both, MACD and Stochastic are aligned with direction of trend, it improves probability and strength of such signal. There's possibility to also activate second Stochastic as additional confirmation of the signal. One of winning setup is to keep MACD settings standard - 12,26,9 and both Stochastics with slightly longer settings - 14,7,7 & 21,14,14. Figures at top are displaying trend coming from MACD . Background is coloured when all signals are aligned. Stochastic is generated signal only if it travelled back recently from overbought/oversold zone - this improves reliability of generated signals.
Alerts are included to inform when trend is aligned.
If you're interested in access for oscillator, please DM me on Tradingview.com ;)

Simple PVT Strength Spotter™TradeChartist Simple PVT Strength Spotter is a modified version of Price Volume Trend visualised using Relative Strength and helps spot price trends using visually engaging and appealing PVT Strength Oscillator plot and background. The Bull and the Bear background fills are highly useful for traders who like to visually understand areas of entry/exit based on PVT Strength and Oscillator Highs and Lows help spot Bull and Bear Divergences.
===================================================================================================================
What does Simple PVT Strength Spotter do?
Plots PVT Strength with visually engaging colours for Bull and Bear zones (Green and Red).
Plots PVT Strength coloured bars on main chart based on user preferred Upper and Lower PVT Strength bands (Default - 5/-5).
Plots PVT Strength based on EMA smoothing (1 for Regular PVT Strength without smoothing).
Plots Heikin Ashi PVT Strength if enabled from indicator settings.
Plots PVT Strength highs of Bull Zone and PVT Strength lows of Bear Zone. Helps visually spot divergences.
===================================================================================================================
Note:
Default Settings:
7 period PVT Strength using 5 EMA Smoothing.
For Heikin Ashi PVT Strength on normal bars, enable ᴜsᴇ ʜᴇɪᴋɪɴ ᴀsʜɪ PVT Sᴛʀᴇɴɢᴛʜ .
Works only on symbols that have Volume data.
===================================================================================================================

Stochastic + MACD Trend Alignment OscillatorOscillator is combining MACD with (double) Stochastic oscillator. When both, MACD and (double) Stochastic are aligned with direction of trend, it improves probability and strength of such signal. There's possibility to also activate second Stochastic as additional confirmation of the signal. One of winning setup is to keep MACD settings standard - 12,26,9 and both Stochastics with slightly longer settings - 14,7,7 & 21,14,14. Figures at top are displaying trend coming from MACD . Background is coloured when all signals are aligned.
If you're interested in access for oscillator, please DM me on Tradingview.com ;)

Advance Decline Line with Divergence Finder
The advance/decline line (A/D) is a breadth indicator used to show how many stocks are participating in a stock market rally or decline.
When major indexes are rallying, a rising A/D line confirms the uptrend showing strong participation.
If major indexes are rallying and the A/D line is falling, it shows that fewer stocks are participating in the rally which means the index could be nearing the end of its rally.
When major indexes are declining, a falling advance/decline line confirms the downtrend.
If major indexes are declining and the A/D line is rising, fewer stocks are declining over time, which means the index may be near the end of its decline.
For more info: www.investopedia.com

Trend Indicator for Directional Trading (add-on)TIDT is a two-part trend-based indicator designed to recognize the general direction and help you identify good opportunities for going long or short (both indicators are called the same way with "main" and "add-on" additions).
This is the add-on indicator that is added below the chart and aside from identifying trending opportunities, it also shows Bullish and Bearish Divergences. Similar to the main indicator, it is based on 3 Moving Averages over which you have full control. You can choose between the following 7 types:
- Simple Moving Average ( SMA )
- Exponential Moving Average ( EMA )
- Weighted Moving Average ( WMA )
- Running Moving Average (RMA)
- Hull Moving Average ( HMA )
- Volume Weighted Moving Average ( VWMA )
- Arnaud Legoux Moving Average ( ALMA )
I strongly suggest that the types and periods for your MAs in the main and the add-on versions are identical so that you get a better visual of the whole picture. However, you may develop a trading strategy that relies on two different types of signals, so that's entirely up to you. Once you have set up the MAs and chosen the lookback period, the rest is taken care of for you. You get two types of signals:
1) Pullbacks - the divergences between your MAs generate a result, which is then averaged as a percentage gain or loss and worked out into a histogram. The colors of the histogram indicate opportunities to buy (if green), short (if red), or sit tight (if white) unless an explicit signal is given by the indicator. Overall the principle is simple - establish the trend and look for weaknesses so that you can open an order in the direction of the trend.
2) Divergences - generated in a similar way to the Pullbacks strategy with some minor adjustments and improvements to better catch the divergences. The histogram is slightly different, as the positive results are plotted above 0 and the negative ones below 0. As such, the histogram looks a lot like MACD, but with different calculations. The color principle mentioned above is the same - green for longs, red for shorts, and white for neutral unless specified by a signal. The change of the shade of the color shows an increase or a decrease in the momentum. A Long signal comes up when the price makes a lower low, while the momentum makes a higher low. A Short signal comes up when the price makes a higher high, but the momentum makes a lower high.
Ticking a box next to the signal type will show the associated histogram and its signals. Due to the different ways those two histograms are calculated and displayed I recommend having either of them On, but not both. However, you may want to be able to see both types of signals, so I've left this as an option. Once again, all colors are fully configurable.
The complete Trend Indicator for Directional Trading has gone over 1,500 revisions, has been forked over 10 times, and has been worked out to be as minimalistic, useful, and practical as possible. A great deal of work, time, and experience have been poured into this indicator to do what it's supposed to do - help you identify better entry opportunities for increased profitability.
If you have any questions regarding the indicator or suggestions on how it could be improved, please let me know. Thank you.
ALLinDivergence v12.60 :: PinPoint BUY/SELL OpportunitiesEasy to spot BUY/LONG or SELL/SHORT ENTRY POINT opportunities.
Just follow this 9 RULES!
Rule 1. ONLY THINK OF GETTING IN A POSITION when BackgroundWave is coloured GREEN and ON POSITIVE SIDE of Flat White Line
Rule 2. ONLY THINK OF GETTING IN A POSITION when BackgroundWave is coloured RED and ON NEGATIVE SIDE of Flat White LineRule
Rule 3. ENTER BUY POSITION (Same Direction) when HigherHighs of MiniWave are coloured GREEN and they are getting BIGGER - needs to be confirmed with RULE 1.
Rule 4. ENTER BUY POSITION (Change) when LowerLows of MiniWave are coloured RED and they are getting SMALLER - needs to be confirmed with RULE 2.
Rule 5. ENTER SELL POSITION (Change) when HigherHighs of MiniWave are coloured GREEN and they are getting SMALLER - needs to be confirmed with RULE 1.
Rule 6. ENTER SELL POSITION (Same Direction) when LowerLows of MiniWave are coloured RED and they are getting BIGGER- needs to be confirmed with RULE 2.
Rule 7. Draw DIVERGENCE TRENDLINES on HIGHS or LOWS to ease your "spotting capabilities" and to be able to set up whatever ALERT you need
Rule 8. IF NOT SURE - CLOSE THE POSITION
Rule 9. DO NOT BE GREEDY - FOLLOW THE PLAN, whatever it is - but definitely THE PLAN SHOULD EXIST)
TIP:
1. First choose your favourite TimeFrame (mine is 30min) and draw all the Lines you need for better preview of the situation and LOCK them (believe me!:)
2. After some move (BUY/SELL) is just about to get confirmed on 30min TF, you can go on lesser TF (i usually analyze 1min, 3 min, 9 min and 15 min) down to TF that its GREEN/RED waves still makes sense (does that makes sense?)
3. On smaller TF you will get confirmation faster but sometimes they are more unreliable than in bigger TF. But if it aligns with a confirmation from 30min TF than i guess it should be OK to judge a bit early:)

TradeChartist Plotter™TradeChartist Plotter is an extremely useful and adaptive indicator that connects to any oscillator to plot highs and lows, Divergences and also Bull and Bear Zones based on the Oscillator and user input to filter zones. When plotted as normal or Heikin Ashi price bars/candles, the divergences can be plotted on price bars and in addition ™TradeChartist MA Visualizer can be plotted and used to filter trade zones derived from the Oscillator connected.
===================================================================================================================
™𝗧𝗿𝗮𝗱𝗲𝗖𝗵𝗮𝗿𝘁𝗶𝘀𝘁 𝗣𝗹𝗼𝘁𝘁𝗲𝗿 𝗨𝘀𝗲𝗿 𝗠𝗮𝗻𝘂𝗮𝗹
===================================
To connect an oscillator to ™TradeChartist Plotter, follow the steps below.
From the ╔═══ 𝗣𝗹𝘂𝗴 𝗢𝘀𝗰𝗶𝗹𝗹𝗮𝘁𝗼𝗿 ═══ 🔌 dropdown, choose the Oscillator plot which is active on the chart.
Choose the Oscillator Smoothing factor if smoothing is not available on the original oscillator plot by using the Osᴄɪʟʟᴀᴛᴏʀ Sᴍᴏᴏᴛʜɪɴɢ input box.
Enter Upper and Lower Bands for the Oscillator plot that helps detect Highs/Lows, Divergences, Trade Zones etc. by using the Uᴘᴘᴇʀ Bᴀɴᴅ and Lᴏᴡᴇʀ Bᴀɴᴅ input boxes. For example, for oscillators like RSI, bands can be 60/40 or 70/30 or even 50/50 to help filter highs/lows on Oscillator and the main price chart based on Oscillator values above Upper Band and Oscillator values below Lower Band.
Osᴄɪʟʟᴀᴛᴏʀ Bᴀsᴇ Lɪɴᴇ is required especially for Oscillators that don't have 0 as its base line. For example, RSI, Stochastic etc. oscillate between 0 and 100. For Oscillators like these, a base line value is really useful on ™TradeChartist Plotter especially to detect Divergences, Highs/Lows, Trade Zones and even to plot the Oscillator as a Histogram or Area plot.
Pʟᴏᴛ Bᴀsᴇ Lɪɴᴇ ᴀɴᴅ Bᴀɴᴅs plots base line and the bands if Oscillator plot is chosen.
There are three plot types under Pʟᴏᴛ Tʏᴘᴇ and they are
══ Plot Oscillator - This option plots the connected Oscillator
══ Plot Price Candles - This option plots price candles and if overlaid on main chart, Highs/Lows, Divergences etc can be visualized along with ™TradeChartist MA Visualizer if enabled.
══ Plot Price Bars - This option plots price bars and if overlaid on main chart, Highs/Lows, Divergences etc can be visualized along with ™TradeChartist MA Visualizer if enabled.
Pʟᴏᴛ HA Cᴀɴᴅʟᴇs/Bᴀʀs plots Heikin Ashi candles/bars. It doesn't affect the Oscillator plot or in anyway alter the Oscillator plot.
Pʟᴏᴛ Sᴛʏʟᴇ dropdown has three types of styles - Line, Histogram and Area plot styles for the Oscillator plot.
Pʟᴏᴛ Pʀɪᴄᴇ Hɪɢʜs ᴀɴᴅ Lᴏᴡs plots the price highs and price lows corresponding to the Bull and Bear zones of the Oscillator connected.
===================================================================================================================
╔═════════ 𝗠𝗔 𝗩𝗶𝘀𝘂𝗮𝗹𝗶𝘇𝗲𝗿 ═════════╗
MA Visualizer is a powerful and very useful original ™TradeChartist visual method to plot Moving Averages of the close price of the security for user specified look back period in a visually appealing style in the form of colour coded bands. MA Visualizer not only helps the trader spot the price action of the security relative to the moving average, but also paints a visual picture of the trend strength, which must be seen and used on chart to appreciate its elegance. One of 15 different types of Moving Averages can be used to visualize the price action.
Activate 𝗠𝗔 𝗩𝗶𝘀𝘂𝗮𝗹𝗶𝘇𝗲𝗿 and choose the MA type from MA Vɪsᴜᴀʟɪᴢᴇʀ Tʏᴘᴇ dropdown and entering the lookback period in MA Vɪsᴜᴀʟɪᴢᴇʀ ᴘᴇʀɪᴏᴅ input box.
MA Visualizer colour theme can be be changed from MA Vɪsᴜᴀʟɪᴢᴇʀ Cᴏʟᴏʀ Sᴄʜᴇᴍᴇ dropdown.
The faster of the two set of bands that form the MA Visualizer reacts to price action faster and can be clearly seen from its change of colour from Bull Colour to Bear Colour or vice-versa earlier than the slower set of bands. The fill colour between the bands also helps the user stay in a trade or exit a trade based on other confirmators.
Enabling Dᴀᴢᴢʟɪɴɢ Vɪsᴜᴀʟɪᴢᴇʀ makes the Visualizer dazzle. Uncheck this option for normal view of MA Visualizer.
𝐔𝐬𝐞 𝐌𝐀 𝐕𝐢𝐬𝐮𝐚𝐥𝐢𝐳𝐞𝐫 𝐚𝐬 𝐓𝐫𝐚𝐝𝐞 𝐅𝐢𝐥𝐭𝐞𝐫 filters the trade zones based on MA Visualizer's trend agreeing with the Oscillator trend. Fɪʟᴛᴇʀ Eᴀʀʟʏ Vɪsᴜᴀʟɪᴢᴇʀ Bʀᴇᴀᴋᴏᴜᴛs filters the trades based on faster MA Visualizer plot's trend.
Also, enabling Pʟᴏᴛᴛᴇʀ Bᴀᴄᴋɢʀᴏᴜɴᴅ Fɪʟʟ under 𝗨𝘀𝗲𝗳𝘂𝗹 𝗘𝘅𝘁𝗿𝗮𝘀 helps detect the trade zones with or without the MA Visualizer filter enabled.
===================================================================================================================
╔═══════ 𝗗𝗶𝘃𝗲𝗿𝗴𝗲𝗻𝗰𝗲𝘀 ═══════╗
Plotter detects both Regular and Hidden Bullish (in a Bear Zone) and Bearish Divergences (in a Bull Zone) at every occurence based on the Oscillator connected. This can be filtered by the use of filtering by Upper and Lower Band values in the Oscillator section. Divergences can also be plotted on price bars based on Pʟᴏᴛ Tʏᴘᴇ .
To plot divergences, enable 𝗗𝗶𝘃𝗲𝗿𝗴𝗲𝗻𝗰𝗲𝘀, Sʜᴏᴡ Rᴇɢᴜʟᴀʀ Dɪᴠᴇʀɢᴇɴᴄᴇs and Sʜᴏᴡ Hɪᴅᴅᴇɴ Dɪᴠᴇʀɢᴇɴᴄᴇs .
Users can further filter Divergences by entering the number of bars to the right in Rɪɢʜᴛ ʙᴀʀs ғᴏʀ Pɪᴠᴏᴛ Cᴏɴғɪʀᴍᴀᴛɪᴏɴ input box to confirm the Price Pivot (for Regular divergences) and Oscillator Pivot (for Hidden Divergences).
Note: Divergences can not be traded at every instance or as a standalone indicator. It just indicates a possibility of strength exhaustion and should not be trusted during a trending market. Higher smoothing (done sensibly) also filters divergences. Divergence can be a strong confirmator once a reversal is detected. For example, using MA Visualizer can help confirm a divergence and vice-versa to identify the trend changes. This means that the confirmations may happen after a few bars since the divergence in agreement with the MA Visualizers trend change.
The example chart of 4hr BTC-USDT chart shows the Divergences filtered by use of RSI 60/40 bands, MA Visualizer and Regression channel trends. It is important to note that the trend intensity colour on the plot and bars (if bar colour option is enabled) will help detect if the Divergence would hold.
===================================================================================================================
╔═══════ 𝗨𝘀𝗲𝗳𝘂𝗹 𝗘𝘅𝘁𝗿𝗮𝘀 ═══════╗
Pʟᴏᴛᴛᴇʀ Bᴀᴄᴋɢʀᴏᴜɴᴅ Fɪʟʟ - Plots background fill based on Bull and Bear Zones based on the Oscillator connected and the filters used.
Plotter offers two vibrant Colour Themes, namely Chilli and Flame , which can be opted from Pʟᴏᴛᴛᴇʀ Tʜᴇᴍᴇ dropdown. These themes also offer the option to plot the trend intensity on the price bars as bar colours by enabling Cᴏʟᴏᴜʀ Bᴀʀs . Bar colors can also be inverted using Iɴᴠᴇʀᴛ Bᴀʀ Cᴏʟᴏᴜʀ option.
Users can also choose to use the Simple theme and choose preferred colours from Sɪᴍᴘʟᴇ Tʜᴇᴍᴇ ʙᴜʟʟ Cᴏʟᴏᴜʀ and Sɪᴍᴘʟᴇ Tʜᴇᴍᴇ ʙᴇᴀʀ Cᴏʟᴏᴜʀ colour input.
Note : The indicator does not repaint and can be confidently used for alerts and trade entries without worrying about plots disappearing after bar close.
===================================================================================================================
Example Charts
1. EUR-USD 15m chart with 3 Plotters on chart, 1 with ™TradeChartist MDO , 1 on main chart and 1 HA Bar chart showing various ways of plotting highs/lows, divergences and Trade zones using 55 period LSMA MA Visualizer.
2. XAU-USD 15m chart with Chande Momentum Oscillator connector to Plotter with 200 period SMA Visualizer used as Trade Filter.
3. LINK-USDT 1hr chart with ™TradeChartist Risk Meter connected to Plotter with 144 period Hull MA Visualizer as Trade filter on Main chart with Divergences plotted based on Risk Meter Volatility Risk Oscillator.
4. Example 3 above with Plotter's Trend Identifier connected to ™TradeChartist Plug and Trade as Oscillatory Signal with Past performance and trades plotted.
===================================================================================================================
Best Practice: Test with different settings first using Paper Trades before trading with real money
===================================================================================================================
This is not a free to use indicator. Get in touch with me (PM me directly if you would like trial access to test the indicator)
Premium Scripts - Trial access and Information
Trial access offered on all Premium scripts.
PM me directly to request trial access to the scripts or for more information.
===================================================================================================================

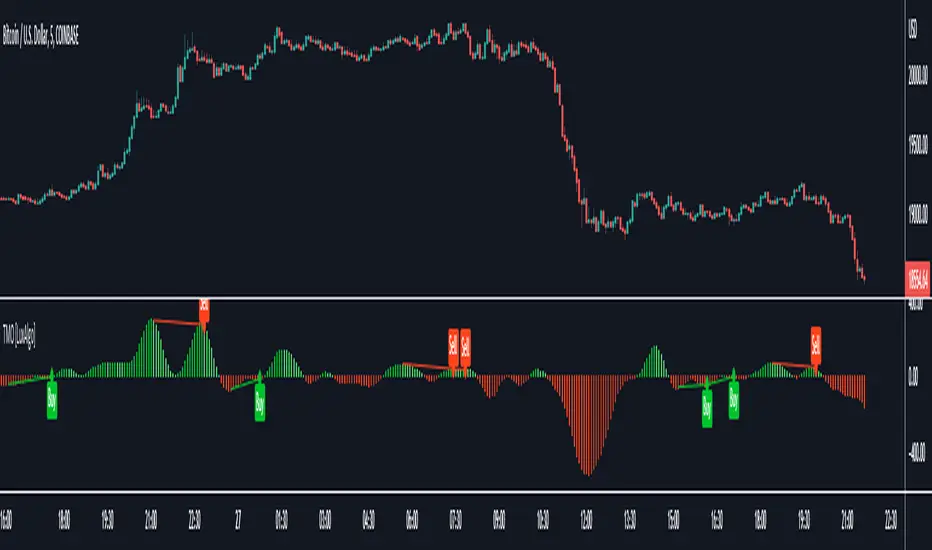
Triangular Momentum Oscillator & Real Time Divergences [LuxAlgo]Oscillators are widely used in technical analysis and can return a large amount of information to the trader depending on their design. It is common to use oscillators to detect divergences with the price, divergences occur when the tops/bottoms made by the oscillator and price are negatively correlated.
The following oscillator is based on the momentum of a triangular moving average, hence the name "triangular momentum" because of the very smooth property of the triangular moving average, we aimed at a real-time detection of divergences instead of using more common methods such as relying on pivot high/low detection which are suitable for more noisy oscillators.
The oscillator can also be colored based on a gradient derived from the correlation between its output and the price which can be useful to detect when the oscillator is out of phase (significantly lagging or leading the price).
Settings
length : Period of the oscillator, higher values return a smoother output.
src : Input source of the indicator.
Show Lines : Show lines connecting the current top/bottom with the previous one made by the oscillator when a divergence is detected. True by default.
Color Based On Price/Oscillator Correlation : Allows the color of the oscillator to change based on its correlation with the price, with red colors suggesting a negative correlation.
Usages
The advantage of having a smoother oscillator for divergences detection is that it can be done in real-time since a top or bottom is present when the oscillator first difference cross 0. Smoother oscillators are also easier to interpret, however, they will still suffer from lag.
The divergences detected by the oscillator are regular divergences, where the oscillator leads price variations.
Using higher values of length allows the oscillator to filter out longer-term variations thus being smoother as a result.
By using the color mode based on the price/oscillator correlation we can see where the oscillator leads or lag the price, and since divergences are based on the price and oscillator going in the opposite direction we can have information where price might reverse.
It is also possible to interpret the oscillator without relying on the divergence detection, with a decreasing value of the oscillator indicating a downtrend and an increasing value indicating an uptrend.
Trend Oscillator (Expo)Trend Oscillator (Expo) measures the overall trend strength and how strong the current price move/momentum is. The indicator is leading since it can signal a possible trend change that is yet to start. The color of the histogram and its value helps to gauge the strength and momentum of the trend.
The user can enable Bar Color that coloring the candlesticks based on the trend strength.
The user can choose between different trend calculations, such as smoothed trend, volume-weighted trend, a non-lagging trend, to mentions a few.
DIVERGENCES
All types of oscillators produce divergences and so does Trend Oscillator (Expo). Divergences occur when the oscillator deviates from the trending price action. Bullish divergence is then when the trending price makes a lower low but the oscillator makes a higher low. Bearish divergence is then when the trending price makes a higher high but the oscillator makes a lower high.
HOW TO USE
Identify the trend strength and direction
Identify current momentum
Identify potential trend reversals
Identify Overbought and Oversold areas
INDICATOR IN ACTION
1 min chart
I hope you find this indicator useful , and please comment or contact me if you like the script or have any questions/suggestions for future improvements. Thanks!
I will continually work on this indicator, so please share your experience and feedback as it will enable me to make even better improvements. Thanks to everyone that has already contacted me regarding my scripts. Your feedback is valuable for future developments!
-----------------
Disclaimer
Copyright by Zeiierman.
The information contained in my scripts/indicators/ideas does not constitute financial advice or a solicitation to buy or sell any securities of any type. I will not accept liability for any loss or damage, including without limitation any loss of profit, which may arise directly or indirectly from the use of or reliance on such information.
All investments involve risk, and the past performance of a security, industry, sector, market, financial product, trading strategy, or individual’s trading does not guarantee future results or returns. Investors are fully responsible for any investment decisions they make. Such decisions should be based solely on an evaluation of their financial circumstances, investment objectives, risk tolerance, and liquidity needs.
My scripts/indicators/strategies/ideas are only for educational purposes!
ACCESS THE INDICATOR
• Contact me on TradingView or use the links below
