On-Balance Accumulation Distribution (Volume-Weighted)The On-Balance Accumulation Distribution (OBAD) indicator is designed to analyze the accumulation and distribution of assets based on volume-weighted price movements. The indicator helps traders identify periods of buying and selling pressure and assess the strength of market trends. By incorporating volume and price data, the OBAD indicator provides valuable insights into the flow of funds in the market.
To calculate the OBAD, the indicator multiplies the volume, price, and volume factor (user-defined) with the price change and aggregates the values over a specified length. This results in a histogram and a line plot representing the OBAD values. The OBAD signal line is derived by applying a simple moving average (SMA) to the OBAD values over a shorter period (9 by default). The crossover of the OBAD line and signal line can indicate potential entry or exit points.
The OBAD indicator utilizes coloration to enhance its visual representation and interpretation. The OBAD background is colored based on the relationship between the OBAD values and the OBAD signal line. When the OBAD values are above the signal line, the background is displayed in lime, suggesting a bullish accumulation scenario. Conversely, when the OBAD values are below the signal line, the background is colored fuchsia, indicating a bearish distribution pattern. The bar coloration is also applied to provide further visual cues, with lime representing bullish conditions and fuchsia denoting bearish conditions. When the OBAD signal line is above 0, it is colored green. Conversely, if the signal line is below 0, it is colored maroon.
The length parameter in the OBAD indicator determines the number of periods used in the calculation. Shorter lengths, such as 10 or 20, can make the indicator more responsive to recent price and volume changes, providing quicker signals. This can be beneficial for short-term traders or in fast-paced markets. Conversely, longer lengths, such as 50 or 100, smooth out the indicator and provide a broader view of accumulation and distribution over a more extended period. This may suit longer-term traders or when analyzing trends in less volatile markets. Traders should experiment with different lengths to find the optimal balance between responsiveness and smoothness that aligns with their trading goals.
The volume factor parameter allows traders to adjust the weighting of volume in the OBAD calculation. By modifying this factor, traders can emphasize the impact of volume on the indicator. Increasing the volume factor amplifies the influence of volume in the OBAD calculation, making it more sensitive to volume changes. This can be advantageous when volume is considered a significant driver of price movements, such as during news events or market catalysts. On the other hand, decreasing the volume factor reduces the impact of volume, making the indicator less sensitive to volume fluctuations. Traders can experiment with different volume factors to align the indicator's responsiveness with their analysis of volume patterns and its importance in their trading decisions.
The signal line period parameter determines the number of periods used to calculate the moving average of the OBAD values. Adjusting this parameter can help smooth out the indicator and filter out short-term noise or provide more timely signals. A shorter signal line period, such as 5 or 7, provides more sensitive and frequent crossovers with the OBAD values, potentially offering early entry or exit signals. This can be useful for traders seeking shorter-term trades or more agile trading strategies. Conversely, a longer signal line period, such as 9 or 14, smooths out the indicator and provides more stable signals. This may suit traders who prefer longer-term trends or a more conservative approach. Traders should consider their trading timeframe and the desired balance between responsiveness and stability when adjusting the signal line period.
The OBAD indicator can be applied in various trading strategies and scenarios. It helps traders identify potential trend reversals, confirm existing trends, and generate entry and exit signals. For example, when the OBAD histogram transitions from fuchsia to lime, it may suggest a shift from selling to buying pressure, signaling a potential buying opportunity. Traders can also use the OBAD indicator in conjunction with other technical analysis tools, such as trendlines or support/resistance levels, to confirm signals and make more informed trading decisions.
-- Trend Reversal Identification : The OBAD indicator can be useful in identifying potential trend reversals. When the OBAD values cross above the signal line after being below it, it may suggest a shift from bearish distribution to bullish accumulation. Conversely, when the OBAD values cross below the signal line after being above it, it may indicate a transition from bullish accumulation to bearish distribution. Traders can use these crossovers as potential signals to enter or exit trades in anticipation of a trend reversal.
-- Confirmation of Trend Strength : The OBAD indicator can act as a confirmation tool for assessing the strength of existing trends. When the OBAD values remain consistently above the signal line, it confirms the presence of strong bullish accumulation and validates the upward trend. Similarly, when the OBAD values stay consistently below the signal line, it confirms the presence of strong bearish distribution and validates the downward trend. Traders can use this confirmation to have more confidence in the prevailing trend and adjust their trading strategies accordingly.
-- Divergence Analysis : Divergence between the price and the OBAD indicator can provide valuable insights. Bullish divergence occurs when the price forms lower lows while the OBAD indicator forms higher lows, suggesting a potential trend reversal to the upside. Conversely, bearish divergence occurs when the price forms higher highs while the OBAD indicator forms lower highs, indicating a potential trend reversal to the downside. Traders can use these divergences as additional confirmation signals in their trading decisions.
-- Volume Analysis : The OBAD indicator incorporates volume data, making it particularly useful for volume analysis. Traders can analyze the relationship between OBAD values and volume levels to gauge the strength and validity of price movements. Higher OBAD values accompanied by higher volume can indicate strong accumulation or distribution, providing confirmation for potential trade setups. On the other hand, lower OBAD values accompanied by low volume may suggest a lack of participation and potentially signal caution in trading decisions.
It is important to note that the OBAD indicator, like any other technical indicator, has certain limitations. It relies on historical price and volume data, which may not always accurately reflect current market conditions or future price movements. Traders should exercise caution and use the OBAD indicator in conjunction with other analysis techniques and risk management strategies. Additionally, customization of the OBAD parameters, such as adjusting the length or volume factor, can provide flexibility to adapt the indicator to different market conditions and trading preferences.
Overall, the OBAD indicator serves as a valuable tool for traders to gauge the accumulation and distribution patterns in the market. Its calculation based on volume-weighted price movements and the coloration enhancements make it visually appealing and intuitive to interpret. By incorporating the OBAD indicator into trading strategies and considering its limitations, traders can potentially improve their decision-making process and enhance their trading outcomes.
Distribution

Cauchy Distribution Oscillator by c00l75ITALIANO: Questo script è un indicatore che non viene sovrapposto al grafico dei prezzi. Utilizza una finestra di lookback di 14 periodi (che può essere modificata dall’utente) per calcolare la distribuzione di Cauchy per ogni periodo.
La distribuzione di Cauchy è una distribuzione di probabilità continua che viene utilizzata in statistica. Ha una forma simile a quella della distribuzione normale, ma con code più pesanti. Questo significa che ha una maggiore probabilità di generare valori estremi rispetto alla distribuzione normale. E' una distribuzione di probabilità che descrive nel piano euclideo l'intersezione tra l'asse delle ascisse ed una retta passante per un punto fissato ed inclinata ad un angolo che segue la distribuzione continua uniforme.
Nello script, viene utilizzata una funzione che calcola il valore della distribuzione di Cauchy per un dato valore x, utilizzando altre 2 variabili per le quali ho impostato un valore fisso. Il risultato viene quindi memorizzato in un array e la media viene calcolata per tutti i valori nell’array.
E' un oscillatore un po' "estremo", che misura il momentum del prezzo in maniera decisa e per tanto, secondo la mia opinione, va utilizzato di concerto con altri indicatori per poter prendere decisioni consapevoli.
Ad ogni modo se vi piace mettete un "boost" e lasciate un commento se volete altre funzioni o modifiche su questo script.
ENGLISH: This script is an indicator that is not overlaid on the price chart. It uses a 14-period lookback window (which can be modified by the user) to calculate the Cauchy distribution for each period.
The Cauchy distribution is a continuous probability distribution that is used in statistics. It has a similar shape to the normal distribution, but with heavier tails. This means that it has a higher probability of generating extreme values than the normal distribution. It is a probability distribution that describes in the Euclidean plane the intersection of the x-axis and a line passing through a fixed point and inclined at an angle that follows the uniform continuous distribution.
In the script, a function is used that calculates the value of the Cauchy distribution for a given x value, using 2 other variables for which I set a fixed value. The result is then stored in an array and the mean is calculated for all the values in the array.
It is a somewhat "extreme" oscillator, measuring price momentum in a decisive way and therefore, in my opinion, should be used in concert with other indicators in order to make informed decisions.
Anyway if you like it put a "boost" and leave a comment if you want other functions or modifications on this script.

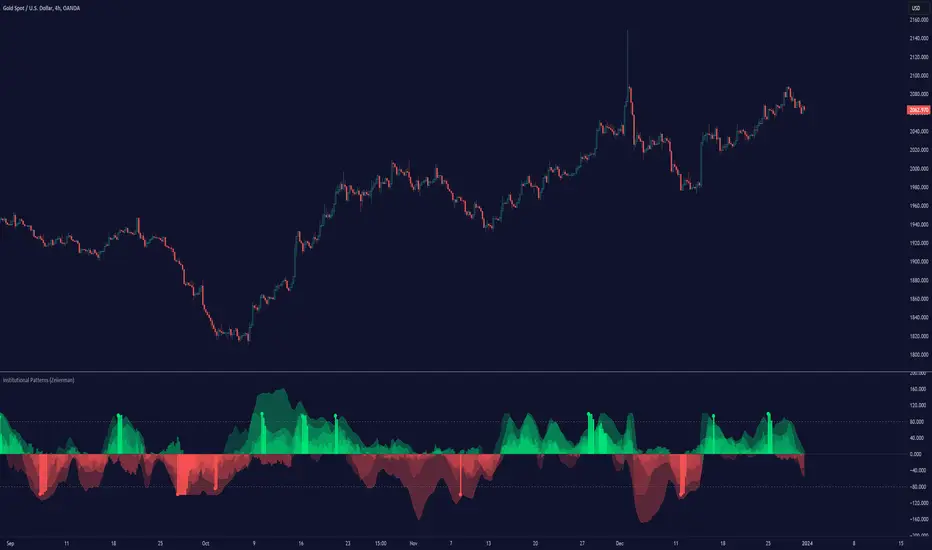
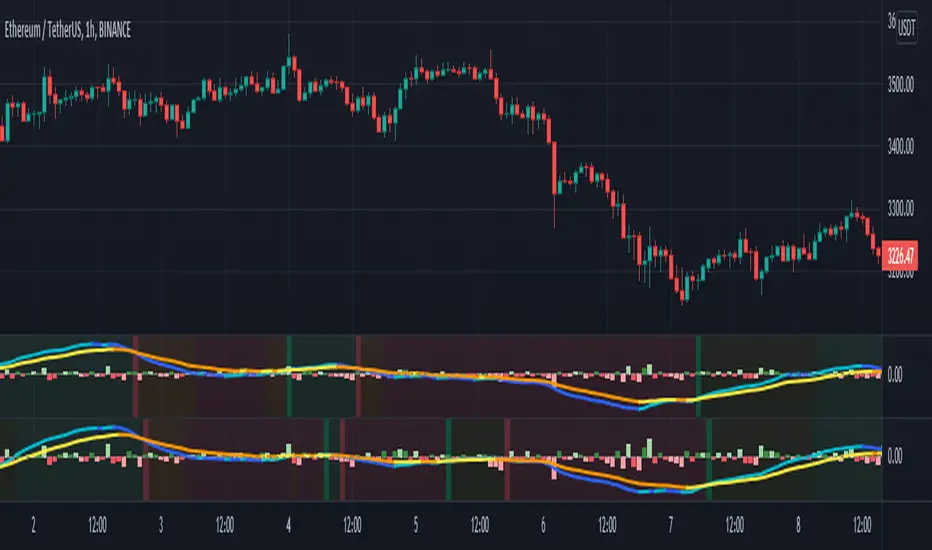
Institutional Patterns (Zeiierman)█ Overview
Institutional Patterns (Zeiierman) reveals how large participants quietly shape market structure. It transforms price, volume, and momentum into a unified view of institutional activity, helping traders see beyond surface volatility to understand where meaningful capital is entering or exiting the market.
The indicator operates through two primary layers:
Pre-Institutional Activity, which highlights early accumulation or distribution before trends emerge, and Institutional Activity , which visualizes active participation once those trends are underway. Each layer combines flow signals from momentum, trend, and volume domains into an adaptive map of market behavior. The result is a fluid representation of how professional money interacts with price, showing when participation is strengthening, fading, or shifting direction.
⚪ Why This One Is Unique
Traditional “smart money” indicators focus on one aspect of market behavior. Institutional Patterns blends multiple adaptive models into a single, self-adjusting framework that evaluates participation strength and direction dynamically.
Its internal flow engine rebalances several momentum and volume dimensions based on changing volatility and structure. This allows it to remain stable in trending environments while still sensitive to early signs of accumulation or exhaustion. Traders gain a clear sense of whether the underlying flow supports or contradicts visible price action.
█ Main Features
⚪ Smart Money Flow
Smart Money Flow provides a multi-dimensional view of how institutional participation evolves beneath price action. It combines several adaptive models that represent different aspects of market behavior—momentum, volatility balance, trend inertia, and volume displacement—into a single synchronized flow structure.
When the flows move together, it shows unified institutional behavior; when they diverge, it signals redistribution, exhaustion, or hidden accumulation. The flow visualization reacts dynamically to volatility shifts, helping traders detect the strength or fragility behind visible price trends.
⚪ Institutional Activity Layer
The Institutional Activity Layer transforms the collective signals of Smart Money Flow into a coherent measure of institutional intent. It visualizes where capital is entering or exiting positions in real time.
Each activity pulse represents the depth of institutional engagement, filtered through adaptive volatility scaling. Green regions highlight expansion phases when capital is building into strength, while red regions indicate contraction or controlled distribution.
This layer bridges the gap between short-term trader behavior and long-term professional positioning, providing a clear and adaptable view of where meaningful market participation truly resides.
⚪ Key Terms
Accumulation vs. Distribution
These terms describe what large participants are doing, not necessarily whether price is going up or down at that moment:
Accumulation: Institutions are building long exposure—quietly buying over time, often during a sideways or suppressed market phase, before a larger uptrend.
Distribution: Institutions are building short exposure or unloading longs—selling gradually into strength, often during or near the end of an uptrend.
In a Uptrend Context
During an uptrend, institutions often accumulate early and distribute later.
Accumulation occurs when large players are building long positions during consolidation or pullbacks, preparing for the next upward leg.
Distribution takes place when they begin offloading those long positions into strength, gradually selling to retail demand near or after market peaks.
In a Downtrend Context
Even in a downtrend, both processes can still occur.
When large players are adding short positions at higher levels, this represents distribution, as they are distributing supply into the market as the price attempts to rally.
When institutions begin covering shorts or quietly building new long exposure for a future recovery, that marks accumulation, reflecting strategic buying while price remains weak and undervalued.
█ How to Use
⚪ Trend Following
The simplest way to use the indicator is to look for alignment across the Smart Money Flow components.
When most of the flows align in green, it signals strong buying pressure and confirms that institutional participation supports the uptrend. This is the ideal environment for trend-following trades in the direction of strength.
When most flows align in red, it indicates dominant selling pressure and active distribution, suggesting short opportunities aligned with the prevailing downtrend.
⚪ Pullbacks
Pullbacks can be identified when the Leading Flow begins to diverge from the primary Smart Money Flow.
If the main flow remains bullish (green) but the leading flow temporarily turns bearish (red), it often marks a short-term retracement within an uptrend. This phase can offer re-entry opportunities for long positions once the flows realign.
In a downtrend, the opposite applies. If the main flow remains bearish (red) and the leading flow turns bullish (green), it signals a temporary countertrend bounce that may provide short re-entry points after the correction fades.
⚪ Breakouts
Breakouts are best confirmed by the Institutional Activity Layer.
A bullish breakout occurs when institutional activity spikes above a breakout level with clear green intensity, confirming active capital expansion and strong follow-through potential.
Conversely, a bearish breakout is confirmed when institutional activity rises below a breakdown level with strong red intensity, signaling renewed distribution and a potential continuation of the downtrend.
⚪ Reversals
Institutional activity can also reveal potential reversal zones.
If red or pink activity appears after an extended downtrend or near a lower trading range, it may indicate accumulation and an upcoming bullish reversal.
If green or aqua activity forms after a prolonged uptrend or near upper resistance levels, it may signal distribution and the beginning of a bearish reversal.
Note: These signals can be the first sign of a potential reversal, but they still need confirmation before taking action.
⚪ Squeeze Detections
Squeeze conditions occur when volume flow begins to diverge from the primary trend, showing early signs of trapped positioning.
If volume flow turns bullish while price and trend flow remain bearish, it suggests buyers are stepping in early. If the price then accelerates downward, longs get trapped and start closing positions, triggering a long liquidation that further fuels the drop.
If volume flow turns bearish while price and trend flow remain bullish, it signals early selling pressure. If the price then pushes higher, shorts begin exiting to limit losses, causing a short squeeze that amplifies the upward move.
█ How It Works
⚪ Flow Integration Framework
The indicator combines several flow components into a single activity field using advanced normalization and smoothing logic. Each flow—trend, momentum, oscillator, and volume bias—contributes a weighted directional influence. These are blended into a balanced structure that represents the strength and direction of institutional behavior across time.
Calculation: Employs multi-domain normalization and weighted signal blending to synchronize phase, reduce noise, and maintain a coherent directional bias across all flow sources.
⚪ Institutional Activity Core
At the core of the system is a volatility-adaptive activity model that interprets both price displacement and volume footprint asymmetry. It measures how trade flow diverges from recent equilibrium and translates that divergence into a refined intensity signal. The model reacts dynamically to imbalances between buying and selling pressure (delta), revealing whether institutional flow is accumulating into strength or distributing into weakness.
Calculation: Utilizes a dynamic volatility envelope combined with delta-weighted response mapping to translate footprint imbalances into a smooth, self-adjusting participation curve.
⚪ Pre-Institutional Detection Engine
The early detection engine isolates latent footprint formations and delta transitions that occur before price movement becomes visible. It examines structural variance, order-flow dispersion, and volatility compression to pinpoint areas where large participants begin to build or unwind positions.
Calculation: Applies entropy-weighted variance mapping and flow compression analysis to reveal pre-breakout regions of capital absorption or release.
-----------------
Disclaimer
The content provided in my scripts, indicators, ideas, algorithms, and systems is for educational and informational purposes only. It does not constitute financial advice, investment recommendations, or a solicitation to buy or sell any financial instruments. I will not accept liability for any loss or damage, including without limitation any loss of profit, which may arise directly or indirectly from the use of or reliance on such information.
All investments involve risk, and the past performance of a security, industry, sector, market, financial product, trading strategy, backtest, or individual's trading does not guarantee future results or returns. Investors are fully responsible for any investment decisions they make. Such decisions should be based solely on an evaluation of their financial circumstances, investment objectives, risk tolerance, and liquidity needs.
Script pago
RSI is in Normal Distribution?Does RSI Follow a Normal Distribution?
The value of RSI was converted to a value between 0~2, 2~4, ..., 98~100, and the number of samples was graphed.
The Z values are expressed so that the values corresponding to 30 and 70 of the RSI can be compared with the standard normal distribution.
Additionally, when using the RSI period correction function of the 'RSI Candle Advanced V2' indicator that I made before, it shows no change in standard deviation.
RSI는 정규분포를 따를까요
RSI의 값을 0~2, 2~4, ..., 98~100 사이 값으로 변환하고 그 표본 갯수를 그래프로 표현하였습니다.
Z 값은 RSI의 30, 70에 해당하는 값을 표준정규분포와 비교할 수 있도록 표현하였습니다.
추가적으로 제가 예전에 만들었던 'RSI Candle Advanced V2' 지표의 RSI 기간 보정 함수를 사용할 경우 표준편차의 변화가 없음을 보입니다.

SFC Smart Money - VolatilityIn statistics, a normal distribution is a type of continuous probability distribution for a real-valued random variable. Normal distributions are important in statistics and are often used in the natural and social sciences to represent real-valued random variables whose distributions are not known.
The indicator provide a deep statistic for the specified period. It calculate the normal distribution of all candles in the particular period, in order to measure the volatility and the probabilities. Also it separate bull from bear candles and calculate the normal distribution of each group. The calculations are mode based on open-open data and high-low data.
Volatility
Volatility is a statistical measure of the dispersion of returns for a given security or market index. In most cases, the higher the volatility , the riskier the security. Volatility is often measured from either the standard deviation or variance between returns from that same security or market index.
Volatility often refers to the amount of uncertainty or risk related to the size of changes in a security's value. A higher volatility means that a security's value can potentially be spread out over a larger range of values. This means that the price of the security can change dramatically over a short time period in either direction. A lower volatility means that a security's value does not fluctuate dramatically, and tends to be more steady.
While variance captures the dispersion of returns around the mean of an asset in general, volatility is a measure of that variance bounded by a specific period of time. Thus, we can report daily volatility , weekly, monthly, or annualized volatility .
This statistic gives very accurate information how the price moved in the past and what are normal movements and spikes. From this information, a future actions can be taken.
For better understanding, all data is calculated in pips.
Features:
- Mean - Mean is the one we are most used to, i.e. the average.
- Median -Sometimes, the data set values can have a few values which are at the extreme ends, and this might cause the mean of the data set to portray an incorrect picture.
Thus, we use the median, which gives the middle value of the sorted data set.
- Mode - In a given dataset, the mode will be the number which is occurring the most.
- Max - Maximum volatility for a given range.
- Min - Minimum volatility for a given range.
- Standard Deviation - The standard deviation tells us how far the value deviates from the mean.
- Range - Range simply gives the difference between the min and max values of the data set.
- ATR - Average True Range measures volatility, taking into account any gaps in the price movement.
- Normal Distribution - The basic premise is that given a range of observations, it is found that most of the values center around the mean and within one standard deviation
away from the mean.
- Probability - probability of outcomes.
We all know that the banks and professional traders do not trade with charts, but with different statistical methods, math. models and macroeconomics. This statistical indicator shows one of these methods.
It is recommended to use the indicator on daily timeframe . It also works on other timeframes, for example 1H for intraday analysis.
For more information how the normal distribution works, please search in internet.

RSI Accumulation/Distribution [M]Hello everyone,
After my long tests, I observed that the rate of change of direction of the price was high after the periods when the RSI spent a long time outside the band. As a result of my observations, I prepared this indicator.
This indicator shows you the accumulation and distribution areas that occur outside the rsi band.
There are 3 different levels available.
Level 1 = 5 Bars
Level 2 = 7 Bars
Level 3 = 9 Bars
For example, if the RSI spends more than 9 bars below the 30 level or above the 70 level, it will paint that area red. Levels can be changed from the indicator settings. The rsi is smoothed with simple moving average to reduce fake signals.
Using the RSI A/D indicator with different indicators or patterns will increase your success rate.
Examples:

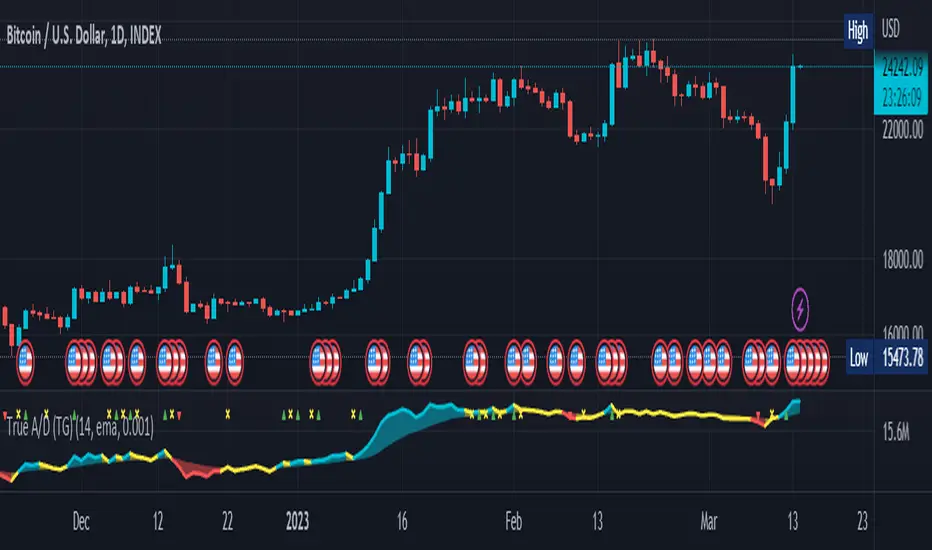
True Accumulation/Distribution (TG fork)An accumulation/distribution indicator that works better against gaps and with trend coloring.
Accumulation/Distribution was developed by Marc Chaikin to provide insight into strength of a trend by measuring flow of buy and sell volume .
The fact that A/D only factors current period's range for calculating the volume multiplier causes problem with price gaps. They are ignored or even misinterpreted.
True Accumulation/Distribution solves the problem by using True Range instead of only relying on current period's high and low.
Most of the time, True A/D reverts to producing the same values as the original A/D. The difference between True A/D and original A/D can be better seen when a gap has occurred, True A/D has handles it better than Accumulation/Distribution which a bearish close in period's range cause it to misinterpret the strong buy pressure as sell volume
The Moving Average Cloud is simply the filling between the moving average and the True A/D. This feature was inspired by D7R ACC/DIST closed-source indicator, kudos to D7R for making such neat visual indicators (but unfortunately all closed source!).
This indicator was made to extend the original work by adding MTF support and a moving average cloud and coloring.
If you like this indicator, please show the original author RezzaHmt some love:
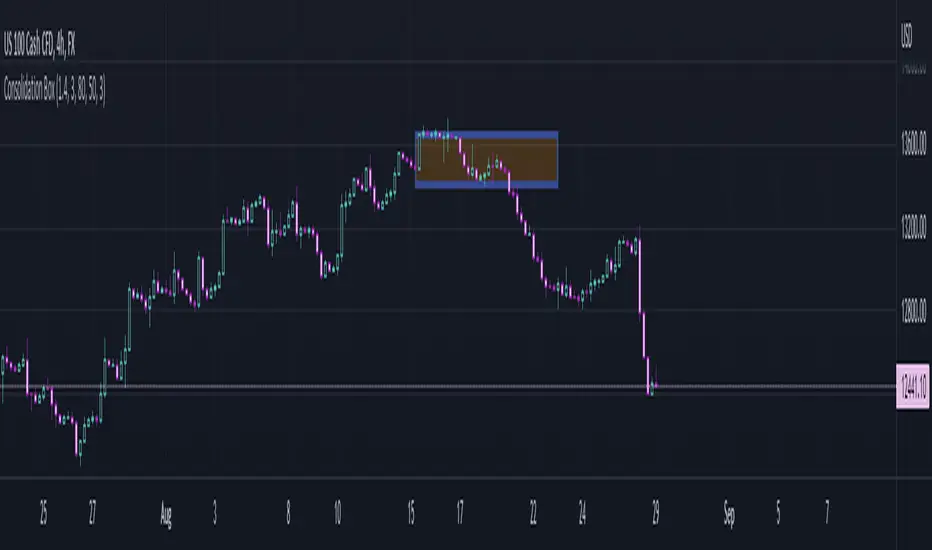
Consolidation BoxThis script aims to help identify sideways markets. Once price leaves the Box the market will usually start a trending phase. Users can set a percent range to detect markets moving sideways within the range.
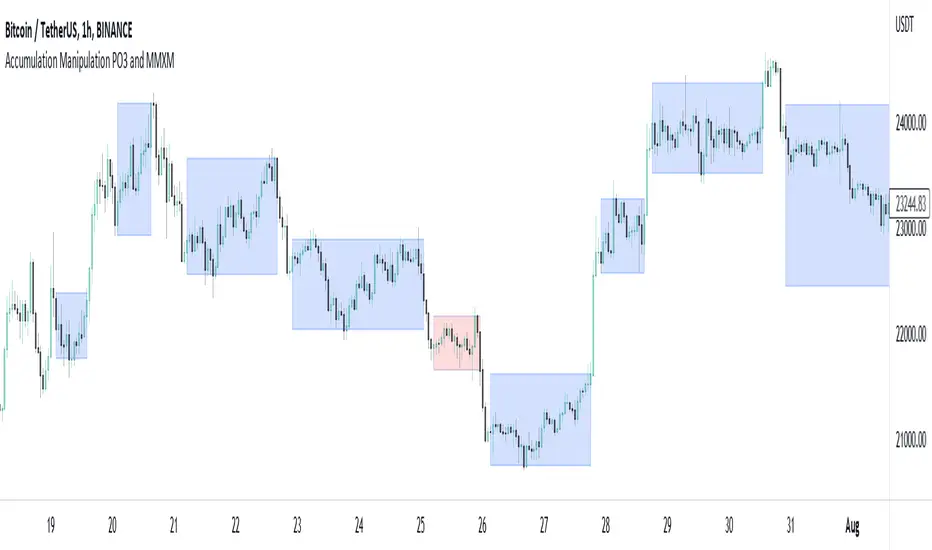
Accumulation Manipulation PO3 and MMXMMuch is said about the market maker or manipulation of price, but there aren't many indicators that try to show this, until now.
Using an easily customisable, but intelligent algorithm, this indicator tries to find and highlight when price is 'ranging', or 'accumulating'. It does this by looking at changes in price and quantifying the strength of the change, based on current and historical changes, and can therfore decide if price is staying in range or breaking out. By showing this on the chart several approaches can be taken.
Simply, you can trade within the range, and also trade breakouts of the range, knowing that price will react at these range 'levels'.
Alternatively, you can use the accumulation boxes to try and identify MMXM models, that is Market Maker Buy and Market Maker Sell Models, where price moves in phases of consolidation, smart money reversal and re-accumulation.
Finally, using the manipulation detection option, you can try to identify when a sudden change in price is actually manipulation by institutions, and plan to trade the distribution phase accordingly. This accumulation, manipulation, distribution is also known as Power of 3, PO3.
This indicator does not try to teach any of these ideas, only help to visualise them on the chart, and as such should not be considered financial advice.
Real-time price distribution in candlesThis indicator splits the candle time into 30 units to indicate where the price was at each time.
In the case of a 1-hour time zone, 60 minutes / 30 = 2 minutes, so this display the location of the price every 2 minutes.
In case of 1 minute time zone, it is displayed every 2 seconds.
CAUTION
If a transaction does not occur, the display may be omitted.
You can change the color of the opening and closing prices and the size of the dots.

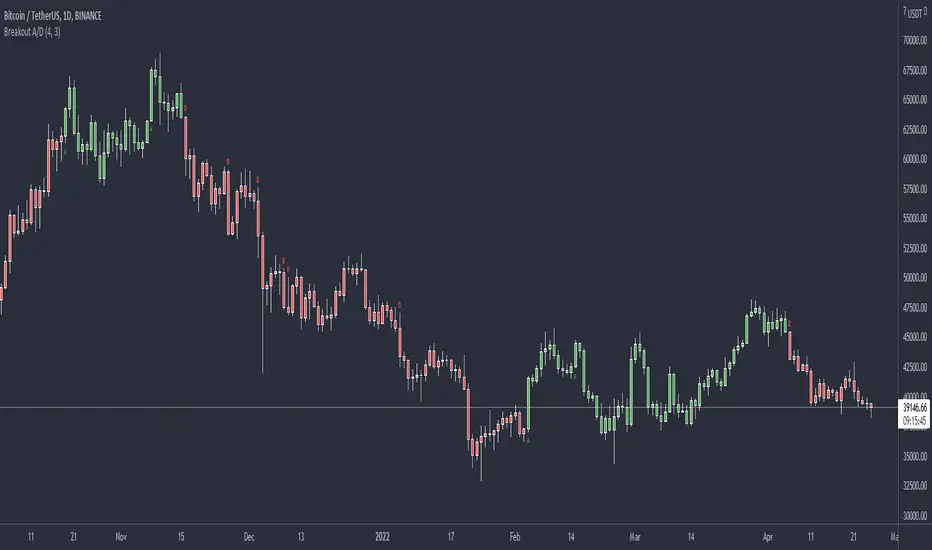
Trend Identifier StrategyTrend Identifier Strategy for 1D BTC.USD
The indicator smoothens a closely following moving average into a polynomial like plot and assumes 4 staged cycles based on the first and the second derivatives. This is an optimized strategy for long term buying and selling with a Sortino Ratio above 3. It is designed to be a more profitable alternative to HODLing. It can be combined with 'Accumulation/Distribution Bands & Signals' and 'Exponential Top and Bottom Finder'.

Money Flow LineWhat is this? The Money Flow Line (MFL) indicator is at its core a more even-tempered version of the Price-Volume-Trend (PVT). The primary difference is the usage of `hlc3` ((high + low + close) / 3) rather than `close` to use the "typical price" that it critical to the calculation of the Money Flow Index (MFI). Other similar indicators include the Accumulation Distribution Line (ADL) and the On Balance Volume (OBV) indicators. The purpose of all of these indicators is to attempt to measure the strength of the money flow by combining price and volume into a rolling measurement that can be compared over time to look for confirmations and divergences.
The indicator also includes an optional averaging (smoothing) line that can be enabled in the display settings. Enabling this smoothing line with a desired period allows for simpler trend comparisons and also allows the user to view how far the line has diverged from the mean. This creates an indicator very similar to Elder's Force Index (EFI), which is also a `close * volume` style indicator.
Why is this important? After an extreme movement or volume spike the MFI will "snap back" sharply as that bar eventually exits the set period. This produces a result that is meaningless and skews the indicator away from the market structure. Because of this behavior, range clamping, and the loss of comparative history I prefer to shy away from oscillator style indicators. The Money Flow Line instead gives you all of the history so you may compare and see the broader trend without sharp snaps in history based on an arbitrary period setting.
Why is this better? This produces a no-lag indicator that isn't subject to the harsh skewing produced by they Money Flow Index's period calculation. It doesn't lose history like MFI or EFI, is clear about the trend direction, and prefers a "typical price" (averaging the entire range of each bar) rather than whatever happens to be the closing price for a given bar.
How can I use it? The indicator is attempting to measure supply and demand in the markets. No indicator is perfect, but we can use all of the information we have available to make our best predictions. There are only 3 pieces of data the market gives us:
1. Price (action)
2. Volume
3. Time
The Money Flow Line combines all of these data points into a readable rolling data set that attempts to show subtle balance of power shifts based on changes in volume and "smart money" (or "big money") stepping in and out of the picture. Much like PVT, we look for the same things:
- Trend Identification: an up or down trend appears in the MFL
- Confirmations: the MFL agrees with price action in direction and magnitude
- Divergence: the MFL disagrees with price action, indicating a reversal may be coming soon
When applying the smoothing line we can also look for similar things we would with EFI. The primary case would be to look for the MFL to jump very far away from the mean (a high magnitude movement) which indicates that price may be reverting towards the mean soon (a "mean reversion"). On the other hand, it may indicate strength in the current price direction. All of these predictions depend heavily on price action and market structure. Good luck!

Trend IdentifierTrend Identifier for 1D BTC.USD
It smoothens a closely following moving average into a polynomial like plot.
And assumes 4 stage cycles based on the first and second derivatives.
Green: Bull / Exponential Rise
Yellow: Distribution
Red: Bear / Exponential Drop
Blue: Accumulation
Red --> Blue --> Green: indicates the start of a bull market
Green --> Yellow --> Red: indicates the start of a bear market
Green --> Yellow: Start of a distribution phase, take profits
Red --> Blue: Start of a accumulation phase, DCA

Sequence Distribution Reporta basic tool to retrieve statistics of the distribution of price range sequences.

Treat Sideways👉 What is this indicator ?
Understanding the Sideways Trend is the best trading method, and we have written this script intending to make you a better sideways filter indicator. Treat Sideways helps you understand the sideways trend and trade in a risk free manner.
👉 On which coins can this indicator be used ?
This indicator is best used on all cryptocurrencies, stocks , forex markets
👉 How work this indicator ?
We understand the trend using our secret logic and price action, and After that, we mark the sideways movement in a box. The moving average line helps us to construct this indicator.
👉 Default Coin and Time Frame ?
XRPUSDT
Time Frame : 1 min
MA Line Color Details 👇
The Blue color of the MA line indicates the Sideways Trend
The Red color of the MA line indicates the Down Trend
The Green color of the MA line indicates the Up Trend
Indicator Settings 👇
Box Height : This setting can be used to set the size of the Sideways trend
Time Gap : This option is used to control unexpected down trend and up trend
Up Down Threshold : This option should be adjusted according to the time frame and voltality
Color :
Option to change the color of the box that appears in the sideways trend
Border Color : Option to change the color of the box border that appears in the sideways trend
Opacity : Option to change the opacity of the box border that appears in the sideways trend
Line Width : You can adjust the width of the MA line with this option

Breakout Accumulation/DistributionBasic modification of my SFP Momentum Indicator showing accumulation/distribution patterns based on breakouts above previous anchor points.
Candles are colored based on whether accumulation or distribution was last.
Best if used at HTF then confirmed at LTF.
Accumulation Distribution Volume Oscillator (ADVO) [JoseMetal]============
ENGLISH
============
- Description:
This indicator has 2 features (currently):
It shows the net volume in a histogram (buy volume in the upper part, sell volume in the bottom part).
Also calculates the difference between accumulation / distribution in a fast vs slow period to plot 2 moving averages and trigger crossovers.
It has an option to ignore the wicks, which sometimes makes it more accurate.
- Visual:
So first of all is the net volume, in the upper part of the histogram the buy volume is printed in green, if the volume keeps going up the histogram bars gets lighter, darker if the volume goes down.
Similarly, we have the sell volume in the bottom part, in red, it also gets lighter if the sell volume increases, and otherwise it gets darker.
And then we have 2 lines, one for the fast and other for the slow period, both shows the DIFFERENCE of the accumulation vs distribution, which can gives us clues about how the market is heading.
The background color changes depending on the status and crossovers:
Fast moving average crossovers the slow = GREEN, if the opposite happens = RED.
The rest of the time it depends on the position of the moving averages and if the fast is above or below the 0 line:
GREEN: FAST > SLOW and FAST > 0
OLIVE: FAST > SLOW but FAST < 0
RED: FAST < SLOW and FAST < 0
ORANGE: FAST < SLOW but FAST > 0
- Usage and recommendations:
Depending on the timeframe, the default 12 and 26 periods (fast / slow) are good, but i noticed that checking lower timeframes with higher settings it gives a better direction of the higher timeframe, example: you want to trade in 1h, but you check the 5 min timeframe with 25 / 100 periods.
That's because the smaller timeframe gives you a more "realistic" volume, more "detailed" volume I'd say.
In fact, in the real testings, I took a wonderful short by checking the 1 minute timeframe with 50 and 200 periods to decide if the 4h was making an accumulation or distribution.
Finally, there's an option to ignore wicks for the moving averages, sometimes it shows better results because ignoring volume within the wicks gives faster results, but I recommend checking both with and without.
- Customization:
So almost everything is customizable, colors, periods... there's an option for the histogram color scheme, but you can change every single color if you want.
You can also pick the moving average type, sometimes WMA is better, but I got better results with the EMA (which is the default).
============
ESPAÑOL
============
- Descripción:
Este indicador tiene 2 características (actualmente):
Muestra el volumen neto en un histograma (volumen de compra en la parte superior, volumen de venta en la parte inferior).
También calcula la diferencia entre acumulación/distribución en un periodo rápido vs lento para trazar 2 medias móviles y generar cruces.
Tiene una opción para ignorar las mechas, lo que a veces lo hace más preciso.
- Visual:
En primer lugar está el volumen neto, en la parte superior del histograma se muestra en verde el volumen de compra, si el volumen sigue subiendo las barras del histograma se hacen más claras, más oscuras si el volumen baja.
Del mismo modo, tenemos el volumen de venta en la parte inferior, en rojo, también se aclara si el volumen de venta aumenta, y de lo contrario se oscurece.
Y luego tenemos 2 líneas, una para el periodo rápido y otro para el lento, ambos muestran la DIFERENCIA entre la acumulación y distribución en su período, que nos puede dar pistas sobre la dirección del mercado.
El color del fondo cambia según el estado y los cruces:
La media móvil rápida cruza la lenta = VERDE, si ocurre lo contrario = ROJO.
El resto del tiempo depende de la posición de las medias móviles y de si la rápida está por encima o por debajo del punto 0:
VERDE: RÁPIDO > LENTO y RÁPIDO > 0
OLIVA: RÁPIDO > LENTO pero RÁPIDO < 0
ROJO: RÁPIDO < LENTO y RÁPIDO < 0
NARANJA: RÁPIDO < LENTO pero RÁPIDO > 0
- Uso y recomendaciones:
Dependiendo del marco de tiempo, los 12 y 26 períodos por defecto (rápido / lento) van bien, pero me di cuenta de que vigilar temporalidades más bajas con períodos más largos da una mejor dirección de la temporalidad superior, ejemplo: queremos operar en 1h, pero miramos el de 5 min con 25 / 100 períodos.
Eso es porque el marco de tiempo más pequeño le da un volumen más "realista", más "detallado" en mi opinión.
De hecho, en las pruebas reales, operé un estupendo short comprobando el marco de tiempo de 1 minuto con 50 y 200 períodos para decidir si el 4h estaba haciendo una acumulación o distribución.
Por último, hay una opción para ignorar las mechas para las medias móviles, a veces muestra mejores resultados ya que ignorar el volumen dentro de las mismas da resultados más rápidos, pero recomiendo comprobar el indicador de ambas formas para hacernos una idea general.
- Personalización:
Casi todo es personalizable, los colores, los periodos... hay una opción para el esquema de colores del histograma, pero puedes cambiar todos los colores si quieres.
También puedes elegir el tipo de media móvil, a veces es mejor la WMA, pero yo obtuve mejores resultados con la EMA (que es la que viene por defecto).
Accumulation_&_Distribution_Aka_ConsolidationZone - BasicDear Traders,
It so happens to the traders that once in their lifetime journey they be sure to here the below statement.
1. I got struck in the consolidation zone
2. Signals from technical indicators failed because prices were consolidating.
3. Its pretty tuff to detect consolidation zone. (programmatically)
I don't know about other but I have heard this throughout my trading journey. Hence I started to debug the above 3 statements and came up with this indicator which detects consolidation zones in the chart.
there are 3 inputs settings
1. ATR multiplier = can be used to filter the consolidation box height. higher the value bigger the box (vertical view) and smaller the value smaller the box height.
2. Show Last No of Zones = set the No of previous zones you would like to see.
3. Consolidation Size = If set to small. all kind of sizes will be plotted ( majorly works for day trading) if set to wide, script looks for major consolidation zones (majorly works for higher timeframes). if set to medium, script looks medium size to wide size zones majorly for timeframe with more than 30 min.
What's this indicator is taking into account?
1. Moving Averages
2. Linear Regression curves
3. ATR
4. BB
5. BBW
6. Couple of Math calculation to support the zone identification.
Note: Plz do suggest for any kind of improvements or feedbacks.
Regards

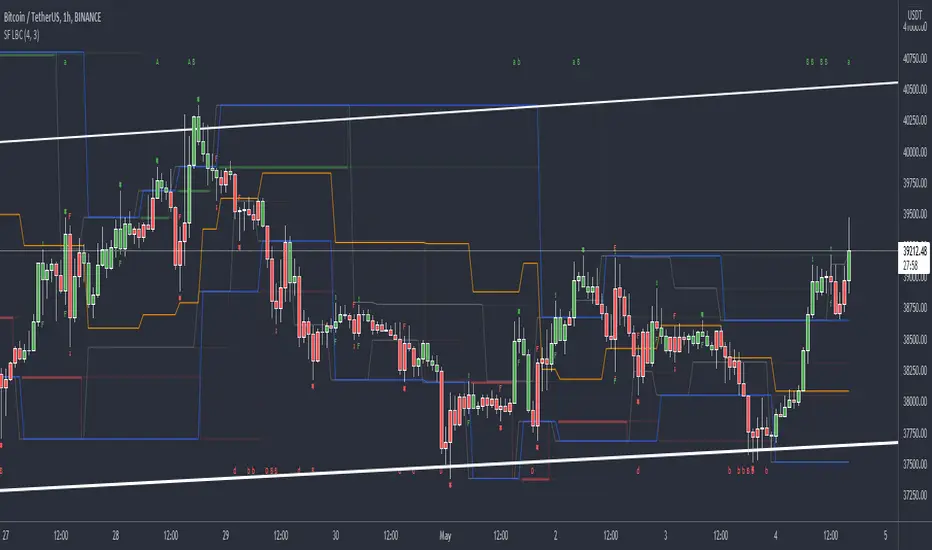
[UPRIGHT Trading] OrderZones - Supply & Demand (Predictive) (cc)Hello Traders,
This is one that I've been working on a very, Very long time. As easy as it is to draw after the fact, as someone well versed in Supply and Demand; it's a bit more difficult to create all the calculations to show them, code them out, and then I went a step further — attempting to predict future ones as well.
Let's talk about what Supply & Demand Zones are. They are a pattern and technical analysis technique used in day and swing trading. Demand zone represents the area with strongest buying pressure and Supply zone represents selling pressure. Often these zones will show Institutional/Large buyers and sellers executing their orders causing price to move up or down very quickly, creating a long wick on a small and sometimes momentum that feeds into the larger timeframes. Therefore, in the simplest terms, the Supply and Demand Orderzones are the zones the price often gets rejected from or returned to; when Demand exceeds Supply, price jumps up and vice versa.
Unlike lines of support and resistance , these are zones more closely than precise lines, but can help gauge Support and Resistance on the fly.
Richard Wykoff was one of the first market analysts to explain the interaction of these phases, giving them four labels. It is in the understanding of Wyckoff's explanation of market price action, that supply and demand zones are also known as Accumulation and Distribution zones (Accumulation, Markup, Distribution, Markdown).
Shows potential entries on break from zone. Pivots. Large breakdowns or breakouts signalling possible trend change.
Super Fast Real-time Orderzone creation. Resistance line at Supply, shows multiple dimensions of each zone when large enough.
Different calculation, line, transparency settings
Minimalist mode with autobox
Features:
Multiple calculation modes with different lengths and displays.
AutoBox (Predictive Orderzones).
Buy/Sell Highlights.
UPRIGHT – Ultimate Reversals (Support/Resistance version).
Breakouts/Breakdowns + Signals.
Pivot Labels (HH, HL, etc).
Pivot Bar.
Pivot Buy /Sell Signals.
Fully Customizable—Change line types, transparency, colors, etc).
I am still working on the calculations for one more addition, but as it is, this should help anyone automate their S/D technical analysis.
Please see author instructions for access.
Cheers,
Mike
(UPRIGHT Trading)

SFP MomentumCustom swing fail detector with levels and breakouts both major and minor plus colored candles based on SFP momentum.
IBP_AccDistThis indicator plots distribution / accumulation.
Distribution is when price falls by 0.2% and volume is 1.25 times the 20 day average volume.
Opposite is accumulation.
If there are 5 distibution days in a span of 20 days then market direction is confirmed down.
William O Neils method. Parameters tweaked based on Indian markets and my experience.

Probability ConesA probability cone is an indicator that forecasts a statistical distribution from a set point in time into the future.
Features
Forecast a Standard or Laplace distribution.
Change the how many bars the cones will lookback and sample in their calculations.
Set how many bars to forecast the cones.
Let the cones follow price from a set number of bars back.
Anchor the cones and they will not update from their last location.
Show or hide any set of cones.
Change the deviation used of any cone's upper or lower line.
Change any line's color, style, or width.
Change or toggle the fill colors between any two cone lines.
Basic Interpretations
First, there is an assumption that the distribution starting from the cone's origin, based on the number of historical bars sampled, is likely to represent the distribution of future price.
Price typically hangs around the mean.
About 68% of price stays within the first deviation cones.
About 95% of price stays within the second deviation cones.
About 99.7% of price stays within the third deviation cones.
When price is between the first and second deviation cones, there is a higher probability for a reversal.
However, strong momentum while above or below the first deviation can indicate a trend where price maintains itself past the first deviation. For this reason it's recommended to use a momentum indicator alongside the cones.
There is no mean reversion assumption when price deviates. Price can continue to stay deviated.
It's recommended that the cones are placed at the beginning of calendar periods. Like the month, week, or day.
Be mindful when using the cones on various timeframes. As the lookback setting, which selects the number of bars back to load from the cone's origin, will load the number of bars back based on the current timeframe.
Second Deviation Strategy
How to react when price goes beyond the second deviation is contingent on your trading position.
If you are holding a losing trade and price has moved past the second deviation, it could be time to stop trading and exit.
If you are holding a winning trade and price has moved past the second deviation, it would be best to look at exit strategies to capitalize on the outperformance.
If price has moved beyond the second deviation and you hold no position, then do not open any new trades.

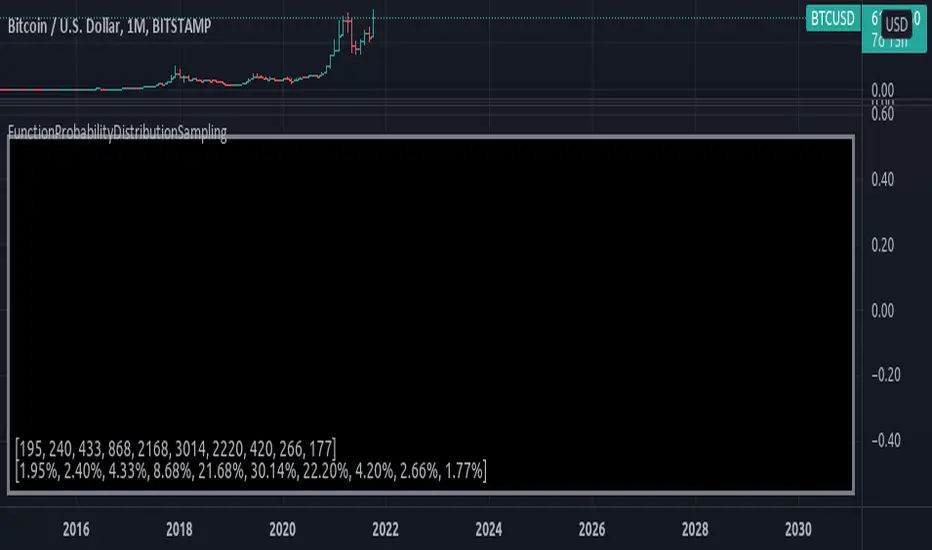
FunctionProbabilityDistributionSamplingLibrary "FunctionProbabilityDistributionSampling"
Methods for probability distribution sampling selection.
sample(probabilities) Computes a random selected index from a probability distribution.
Parameters:
probabilities : float array, probabilities of sample.
Returns: int.