[DisDev] D-I-Y Gridbot🟩 This script is a “do-it-yourself” Grid Bot Simulator, used for visualizing support and resistance levels. Prices are divided into grids, or trade zones, that will trigger signals each time a new zone is entered. During ranging markets, each transaction is followed by a “take profit.” As the market starts to trend, transactions are stacked (compare to DCA ), until the market consolidates. No signals are triggered above the upper gridline or below the lower gridline. Unlike the previous version, all grids may be adjusted in real-time by dragging the gridlines up and down to the desired support and resistance levels.
When adding the indicator to a new chart, you must choose six grid levels by clicking on the desired support or resistance price. You can change all of these levels at any time directly on the chart.
⚡ OVERVIEW ⚡
The D-I-Y Gridbot is an interactive tool designed for visualizing support and resistance levels. As a continuation of the original Gridbot Simulator , which has received significant recognition on TradingView, earning over 4000 boosts and an Editor's Pick status. This tool serves not only as an evolved version of its predecessor, but also as an open-source template for developing future gridbots. It aims to foster discussions and facilitate innovations around grid-trading strategies.
One of the new features of this gridbot is the real-time adjustability of all gridlines. Users can move these lines up and down to set their desired support and resistance levels in response to changing market conditions. Additionally, the D-I-Y Gridbot is compatible with multiple timeframes and can be used on most TradingView charts.
Drag gridlines up or down to desired price level.
Key Features 🔑
All gridlines are adjustable in real-time, directly on the chart
Signals can be filtered by a customizable moving average or by VWAP
Customizable support and resistance levels
Potentially increases profitability in ranging markets
Benefits 💸
Customizable Support and Resistance Levels : The D-I-Y Gridbot allows users to set their preferred support and resistance levels, which can be changed at any time directly on the chart. This provides users with the ability to customize their trading parameters based on their strategy and risk tolerance.
Various Trading Strategies : The D-I-Y Gridbot supports various trading strategies, including Mean Reversion, Ranging Markets, and Dollar-cost averaging (DCA). This allows users to capitalize on price reversals, execute buy and sell orders at predetermined levels, and buy more of an asset as the price falls, respectively.
Multi-Timeframe and Versatility : The D-I-Y Gridbot is compatible with multiple timeframes and can be used on any TradingView chart.
Experimental and Educational : The D-I-Y Gridbot is considered a proof-of-concept tool that is both experimental and educational. This can provide traders with a deeper understanding of grid trading strategies and the ability to experiment with different trading parameters and strategies.
⚙️ CONFIGURATION & SETTINGS ⚙️
Inputs 🔧
Trigger : Candle location to trigger the signal. "Wick" will use either high or low, depending on the signal direction. "Close" will use the close price. “MA” will use the selected moving average or VWAP.
Confirmation : Market direction to confirm the candle trigger. "Reverse" will confirm the signal when the price crosses back over the trigger. "Breakout" will confirm when the price breaks out of the trigger.
Number of Support/Resistance zones : 1 = Only Top Grid is Support/Only Bottom Grid is Resistance. 2 = Top two grids are Resistance/Bottom two grids are Support. 3 = Top three grids are Resistance/Bottom three grids are Support
MA Type : Exponential Moving Average (EMA), Hull Moving Average (HMA), Simple Moving Average (SMA), Triple Exponential Moving Average (TEMA), Volume Weighted Moving Average (VWMA), Volume Weighted Average Price (VWAP)
MA Filter : Use Moving Average as a reversion filter for signals. When enabled, no buys when above MA, no sells when below. Use in conjunction with S/R zones to reduce false signals.
Allow Repeat Signals . When enabled, signals will reset when nearest gridline is triggered. When disabled, only one signal will be triggered per gridline.
Line/Fill colors
Gridlines . Adjusts gridline prices manually.
Left : Trigger = Wick. Confirm = Breakout. Buys are signaled when LOW breaks below gridline. Sells are triggered when HIGH breaks above gridline.
Right : Trigger = Close. Confirm = Breakout. Buys are signaled when the candle CLOSES below the gridline. Sells are triggered when the candle CLOSES above the gridline.
Left : Confirm=Breakout. Signals on breaking through the next gridline.
Right : Confirm=Reverse. Signals only when crossing back from the gridline.
S/R Zones=1. Upper gridline is Resistance / Lower is Support. Middle 4 are neutral.
S/R Zones = 3. Upper three gridlines are Resistance / Lower three are Support
Notes:
If gridlines are dragged out of order on a live chart, they will auto-sort into the correct order.
Price levels may be entered in settings, or adjusted in real-time directly on the chart.
When changing symbols, remember to adjust the gridlines to accommodate the new symbol.
Alerts 🔔
Users can set alerts based on their chosen parameters for triggers, confirmations, number of support/resistance zones, and smoothing type, enabling precise control over alert conditions.
💡 USAGE & STRATEGY 💡
Trading Strategies 📈
Mean Reversion: The script can be used to capitalize on price reversals back to the mean.
Ranging Markets: The script excels in ranging markets, executing buy and sell orders at predetermined levels.
Dollar-cost averaging (DCA): The script can be used to execute DCA orders, buying more of an asset as the price falls, and lowering the average cost per unit.
Timeframes and Symbols ⌚
Multi-Timeframe: The indicator is compatible with multiple timeframes.
Versatile: Can be used on any crypto trading pair on TradingView.
🤖 DETAILS & METHODOLOGY 🤖
Algorithm and Calculation 🛡️
Grids are set and adjusted when loading the indicator on the chart and may be customized anytime afterward by clicking and dragging the gridlines on the chart.
Gridlines are updated, sorted, and stored in a float array.
Signals are calculated based on candle trigger, market direction, and previous price level.
📚 ADDITIONAL RESOURCES 📚
Chart Examples 📊
S/R Zones = 3: Three Support and Three Resistance. Filter = 50-period Triple Exponential Moving Average (TEMA)
S/R Zones = 1: One Support, One Resistance, and Four Neutral Zones. Support Zones: Buys only. Resistance Zones: Sells only. Neutral Zones: Grid-dependent
When MA filter is enabled, Buys are only triggered below Moving Average, and Sells are only triggered above.
Trigger = Wick. Confirmation = Breakout. Buys are signaled when Low breaks above the next grid level. Sells are signaled when High breaks below the next grid level.
🚀 CONCLUSION 🚀
The D-I-Y Gridbot is a proof-of-concept, emphasizing its experimental and educational nature. In future versions, we will aim to incorporate concepts such as auto-adjusting grids and angled grids for trending markets. The script is designed to evolve through user feedback and suggestions, shaping its future iterations.
Credit: This is a continuation of the Gridbot series by xxattaxx-DisDev . Explicit permission was granted by user xxattaxx-disdev to re-use all Gridbot code and all materials without restrictions.
⚠️ DISCLAIMER ⚠️
This indicator is a proof-of-concept and is considered experimental and educational. When gridlines are drawn in hindsight, signals appear to be predictive and valid. Future results may always vary when the trend direction changes. Comments and suggestions are encouraged.
This indicator is provided as a tool for traders and should not be used as the sole basis for making trading decisions. Always conduct your own research and consider your risk tolerance before entering any trades.
Disruptivedevelopers

[DisDev] Tactical Analysis Part III: Oscillators🟩 Introducing the Oscillators Indicator by Disruptive Developers, a revolutionary tool designed to enhance your trading strategy. This indicator is the third part of our Tactical Analysis suite, combining two oscillator indicators to provide you with a comprehensive view of market conditions.
⚡ OVERVIEW ⚡
Key Features 🔑
Combines TDI Pro - Traders Dynamic Indicator by Dean Malone and WTO - Wave Trend Oscillator
Includes MFI - Money Flow Index and MACD - Moving Average Convergence Divergence
Incorporates VWAP - Volume Weighted Average Price
Benefits 💸
Enhances trading strategy by providing comprehensive market insights
Helps determine overbought or oversold conditions in ranging markets
Assists in identifying important entry and exit points
⚙️ CONFIGURATION & SETTINGS ⚙️
Inputs 🔧
Green / Red = The RSI Price-Line (Current Price Sentiment)
Dark Red = The Signal Line (Crossover for Entry & Exit)
Yellow = Market Base Line (Overall Sentiment)
Blue = Volatility Bands (Increasing/Decreasing Volatility)
Alerts 🔔
TDI Cross Short/Long Alerts
TDI MBL Cross Short/Long Alerts
TDI Hook Short/Long Alerts
💡 USAGE & STRATEGY 💡
Trading Strategies 📈
Look for regular and hidden divergences
Identify entries and exits based on crosses with Price-Line
Align trades with market sentiment
Timeframes and Symbols ⌚
Suitable for all timeframes and symbols
Optimized for Forex trading but applicable to all markets
🤖 DETAILS & METHODOLOGY 🤖
Algorithm and Calculation 🛡️
Based on the TDI indicator created by Dean Malone
Incorporates RSI, Signal Line, Market Base Line, and Volatility Bands
Signals for regular and hidden divergences
📚 ADDITIONAL RESOURCES 📚
Tutorials and Guides 📖
Detailed user manual available on our website
Video tutorials for setup and usage
Discord community forum for user discussions and tips
Visit our website for additional information, videos and pdf’s, link can be found below.
Chart Examples 📊
Trader’s Dynamic Index (TDI): Overbought/Oversold Signals
WaveTrend/Moneyflow/VWAP (WMV) Overbought/Oversold Signals
Tactical Analysis Indicator Suite. Parts I, II, and III.
🚀 CONCLUSION 🚀
In conclusion, the Tactical Analysis Part III: Oscillators indicator by Disruptive Developers is a powerful tool that combines multiple oscillators to provide a comprehensive view of market conditions. It is designed to enhance your trading strategy and help you make more informed trading decisions.
Access Parts I and II here:
Tactical Analysis Part I: High-Volume Recovery
Tactical Analysis Part II: Levels
⚠️ DISCLAIMER ⚠️
This indicator is provided as a tool for traders and should not be used as the sole basis for making trading decisions. Always conduct your own research and consider your risk tolerance before entering any trades.

[DisDev] Tactical Analysis Part II: Levels🟩 Tactical Analysis Part II: Levels of the Battlefield represents the evolution of our comprehensive suite, expanding on the success of Tactical Analysis Part I: High-Volume Recovery . This advanced tool seamlessly integrates components from PVSRA, the Market Maker Method by Steve Mauro, and Tino from Traders Reality's Hybrid System, equipping traders with a significant advantage. With Tactical Analysis Part II, you gain access to a diverse range of essential features, including the DisDev Level Reducer™, designed to streamline your chart while ensuring you never overlook a critical level. Prepare to enhance your trading prowess with the power of Tactical Analysis Part II: Levels of the Battlefield.
⚡ OVERVIEW ⚡
Key Features 🔑
Daily Open: Marks the daily opening price at 00:00 UTC.
Weekly Open: Highlights the opening price at the start of each trading week.
Initial Balance (IB): Represents the high and low of the first hour of each day.
Pivot Points: Calculates the two closest pivot levels to the current price.
Volume Weighted Average Price (VWAPs): Marks key areas where the majority of transactions occur.
Average Daily Range (ADR) & Average Weekly Range (AWR): Indicates potential price movement boundaries.
Psychological Levels: A weekly range established each Saturday evening.
Benefits 💸
Comprehensive Analysis: Consolidates multiple important trading metrics into one indicator.
Time Efficiency: Saves time that would be spent manually tracking each of these metrics.
Enhanced Decision Making: Helps traders make more informed decisions by providing important levels.
⚙️ CONFIGURATION & SETTINGS ⚙️
Inputs 🔧
Level Reducer: Allows the user to declutter the chart while still tracking all selected levels.
Level and Label Settings: Provides control over the visibility and length of level lines and labels.
Customizable Settings: Enable or disable any level
Alerts 🔔
Tactical Coordinates Table: Updates levels dynamically in the table according to the actual price.
Real-time Alerts: The Indicator provides alerts when price approaches or crosses any of the defined levels.
Tactical Coordinates Table
Alerts
💡 USAGE & STRATEGY 💡
Trading Strategies 📈
Level Confirmation: Use the Indicator's defined levels as confirmations for your own trading strategies.
Reversal Spots: Levels like the daily and weekly opens or the VWAPs can be potential reversal points.
Breakout Trades: Initial Balance (IB) levels could provide breakout trade opportunities.
Timeframes and Symbols ⌚
Multi-Timeframe: Indicator is compatible with multiple timeframes.
Versatile: Can be used on any crypto trading pair on TradingView.
🤖 DETAILS & METHODOLOGY 🤖
Algorithm and Calculation 🛡️
Dynamic Calculation: Levels are calculated based on price and time data, providing real-time insights.
Pivot Points: Calculated based on a specific formula involving past and subsequent bars or candles.
VWAPs: Calculated based on the average price weighted by volume.
📚 ADDITIONAL RESOURCES 📚
Tutorials and Guides 📖
Visit our website to download comprehensive PDF documents that provide in-depth explanations on various key topics. These include:
Understanding various trading levels such as Daily Open, Weekly Open, Initial Balance (IB), Pivot Points, VWAPs, ADR & AWR, and Psychological Levels.
How data in different time frames is calculated and how this affects the marking of High and Low levels on different time frames.
How our script addresses the data limitations in TradingView, ensuring all levels are shown at the lowest time frame allowable.
Adjusting level and label settings in the indicator.
Using the Level Reducer function to help declutter your chart while still tracking all selected levels.
Chart Examples 📊
Daily Levels
Weekly and Monthly Levels
Tactical Coordinates Table
🚀 CONCLUSION 🚀
The Indicator, with its Levels feature, provides a unique perspective to day and swing traders. Its ability to dynamically calculate and visualize critical trading levels and ranges aims to empower traders with timely insights and efficient analysis. Whether you're an experienced trader or just starting out, integrating these level markers into your trading strategy can significantly improve your market understanding and decision-making process.
The complete Tactical Analysis Indicator Suite
⚠️ DISCLAIMER ⚠️
This indicator is provided as a tool for traders and is not intended to be the sole basis for any trading decision. Always conduct your own research and due diligence, and consider your risk tolerance before entering any trades. Trading involves risk and is not suitable for everyone.

[DisDev] Tactical Analysis Part I: High-Volume Recovery🟩 Tactical Analysis Part I: High-Volume Recovery . Introducing the Tactical Analysis Indicator Suite , a comprehensive three-indicator system designed to provide traders with insights into high-volume candles, Induction Recovery Zones™, market sessions, and more. This versatile tool combines elements from PVSRA, Market Maker Method by Steve Mauro, and Tino from Traders Reality's Hybrid System, to enhance your trading performance.
⚡ OVERVIEW ⚡
Key Features 🔑
Induction Candles
Induction Recovery Zones™
Session - High & Low
Tactical Windows
EMA’s
Induction Table
Benefits 💸
Gain a better understanding of market dynamics through high-volume candle analysis.
Identify potential areas of liquidity and price recovery with Induction Recovery Zones™.
Keep track of major market sessions and their impact on price action.
Enhance your trading strategies with additional insights from Tactical Windows and EMA analysis.
Monitor the performance of top cryptocurrencies at a glance with the Induction Table.
⚙️ CONFIGURATION & SETTINGS ⚙️
Inputs 🔧
Customize the settings for Induction Candles, Induction Recovery Zones™, Session lines, Tactical Windows, and the Induction Table.
Adjust the EMA periods to match your preferred trading style.
Alerts 🔔
Set up alerts for Induction Candles and Induction Recovery Zone events.
Configure alerts for session openings and Tactical Windows to stay informed of market activity.
💡 USAGE & STRATEGY 💡
Trading Strategies 📈
Incorporate high-volume candle analysis into your existing trading strategies to better understand market conditions.
Use Induction Recovery Zones™ to identify potential price reversal areas and plan entries or exits accordingly.
Monitor market sessions, Tactical Windows, and the 4hr - 50 EMA to make informed decisions about trade timing.
Timeframes and Symbols ⌚
Recommended for use on timeframes of 30 minutes or lower for accurate session line representation.
Designed for all cryptocurrency markets. Forex and other major markets are currently under development.
🤖 DETAILS & METHODOLOGY 🤖
Algorithm and Calculation 🛡️
The algorithm identifies Induction Candles based on two conditions, taking into consideration volume and candle range.
Induction Recovery Zones™ are calculated based on the Induction Candles and their potential for price recovery.
📚 ADDITONAL RESOURCES 📚
Tutorials and Guides 📖
Our website provides comprehensive tutorials and guides to help users get the most out of this three-indicator suite.
Chart Examples 📊
London Tactical Window impulse break of the high, reversal
Induction Table - Monitor up to 12 other symbol’s Induction activity
EMA Crosses, Tactical Window, Future Sessions, Static EMA’s, and Recovery Zones
TA Part 1 and Part 2 integration
🚀 CONCLUSION 🚀
The Tactical Analysis Pt 1 - High Volume Recovery indicator offers a comprehensive and powerful toolset for traders, combining high-volume candle analysis, Induction Recovery Zones™, market session tracking, Tactical Windows, and EMA analysis. This unique combination of features is designed to help you make more informed trading decisions and enhance your overall trading performance. We encourage you to try out this indicator suite and experience the benefits it can bring to your trading journey.
The complete Tactical Analysis Indicator Suite
⚠️ DISCLAIMER ⚠️
This indicator is provided as a tool for traders and should not be used as the sole basis for making trading decisions. Always conduct your own research and consider your risk tolerance before entering any trades.
[DisDev] Level by LevelThis indicator's main objective is to provide you with the ability to chose the levels you are interested in , with the added functions of:
Level-by-Level Chart Reducer – This allows you to choose how many levels are above and below the current closing price to display.
Level-by-Level Table – This allows you to display all the levels within a table onto the chart.
The basis of this indicator is to provide you with a toolbox of levels that you can add to your trading plans.
Psychological Levels
A weekly range established each Saturday evening that can be thought of as a weekly "IB" or initial balance.
Average Daily Range ("ADR") & Average Weekly Range ("AWR")
In Forex, the International Monetary Fund ("IMF") controls the allowable weekly swings of a currency's price. The "AWR" and "ADR" perform calculations and dynamically adjust until the range is exceeded, at which time the levels will lock into place for the remainder of the day or week. The accepted theory is that price (even in Stocks and Crypto) will adhere to and remain within these levels, and, if exceeded, will revert back to them.
Initial Balance ("IB")
In Crypto trading, it is generally accepted that the High and Low of the first hour of each day (00:00 - 01:00 UTC) is the Initial Balance . The IB generally thought of as a zone that sets the tone for the rest of the trading session. It is often a time of high volume and volatility, with Stop Hunts at the highs and lows of a range before price moves in one direction or the other. The IB is a Market Profile concept introduced by Peter Steidlmayer. There is plenty of information on the Internet to learn more about IB's and how to implement them -- please do your own research.
Daily Open
Since Crypto is traded 24 hours per day, the generally accepted open is 00:00 UTC, the Tokyo open. Please refer to Part 1 for more details on sessions, starting times, conversions, and Daylight Savings Time.
Volume Weighted Average Price (VWAP's)
VWAPs are important areas on a chart. Institutional traders generally do not want to move price too far as they enter large buy or sell orders. So they wait for price to reach a tight zone around the VWAP where the majority of transactions occur on the Daily, Weekly, or Monthly timeframes. In these areas, there will be plenty of supply and demand for the institutional trader to execute their trades.
Weekly Open
The weekly open is Monday at 00:00 UTC.
Pivot Points (Support & Resistance)
This indicator calculates pivot levels based on a tested formula that calculates past and subsequent bars or candles. It displays the two closest to price pivot levels. The pivot formula takes a window of left bars and right bars, and then finds the highest or lowest value in that window. The window marches across the bar-set to discover the pivots.
We coded the script to label the levels and colors dynamically, either Support (Green) or Resistance (Red), depending on whether they are above or below price. The primary level line stays with the same color scheme:
Blue = Daily / Yellow = Weekly / Violet = Monthly
As price crosses the level:
1 - The label will switch from Support to Resistance and Resistance to Support
2 - The extender line will switch from Green to Red and Red to Green
3 - The same changes will take place in the Level-by-Level Coordinates Table
A Note on Levels and Data
Understanding How Data is Calculated and Presented
Calculating levels requires going back in time through a symbol or asset’s historical data. Time is measured by bars (candles), so depending on the chart's resolution (timeframe or TF) you are viewing, a different number of bars would be required to measure the same level.
For example, if we want to mark the Daily High and Low on the daily TF, we would be measuring 1 bar or candle. If we drop down to the 1-hour TF, we would need to measure 24 bars. For the 15-Minute TF it would be 96 bars (1hr/15min=4 bars per/hour and 4 x 24 = 96), and on the 1-Min TF, it requires 1,440 bars (1hr=60 Min and 6 x 24 = 1,440).
Hopefully, you get the idea and can see that the number of bars required increases exponentially as we move to weekly, monthly, and yearly levels.
TradingView Data
Please note this statement from TradingView's website:
"The length of historical data for any intraday interval (i.e. chart timeframe) is 5,000 bars/candles (for Pro and Pro+ account holders it is doubled to 10,000 bars/candles and for Premium holders it's quadrupled to 20,000) + additionally several bars/candles back to the beginning of the week, month or year (depending on the resolution). Unfortunately, this limit cannot be extended for now due to technical reasons. At lower resolutions (<30Min) Yearly and Monthly VWAPs may not show, but to overcome this issue the “Plot Save” function has been added to the settings to allow the user to manually input these levels. This concept is the same for Daily, Weekly, and Monthly pivots.
If you change the chart interval to daily or daily-based, you will see a longer date range. We display all available data for daily-based intervals."
How we Handled Data Limitations
The Plot Level Feature in the Level by Level Indicator
We have written this script to always show levels at the lowest time frame allowable by TradingView.
If you do not see specific Support or Resistance levels, switch to a higher time frame, enter the corresponding values in the provided fields on the input panel, and check the Plot box. This will hard code the level in and will print on any TF. Additionally, we coded it so that when the Plot feature is enacted, the calculated level will be disabled so that there are no overlaps of two levels being printed.
Legend
The logic behind the line styles:
Solid = Static or established
Dashed = Static but previous week or day
Dotted = Dynamic or still developing -- will turn solid once the values are locked in
*VWAPs would technically be a dotted line since they are fluid, however, TV does not handle the dots or dashes of a curved line well so we chose to keep this solid
Level-by-Level Table
We designed this table to provide the user with a view of the levels in the correct price sequence on the chart at all times since, depending on the resolution and zoom levels, it would typically not be possible. The levels are equidistant and do not align with the actual price.
The current price will move vertically through the table according to the actual price and its relative position to the other various levels. The levels will change price and line styles dynamically as well.
The current price rectangle and the border can be in sync with High Volume Candle colors to draw more attention to the chart during climatic volume events.
Settings & Options - Levels & Labels
Levels will show a faint line through price to the point of origin.
Labels will show a brighter line extended to the right of price.
The values (10, 20, 30) are the length of the extensions; they are staggered to avoid overlaps.
Settings & Options - Level Reducer
The Level Reducer gives you the ability to declutter your chart, but still have the indicator track all the selected levels.
With four Lines selected, for example, the indicator will give you the nearest four lines above price and the nearest four below price. The Table runs independently of the chart, so if you want to see eight levels as an example, the Table will show eight above and eight below price.
As the current price changes, the lines will dynamically change accordingly.

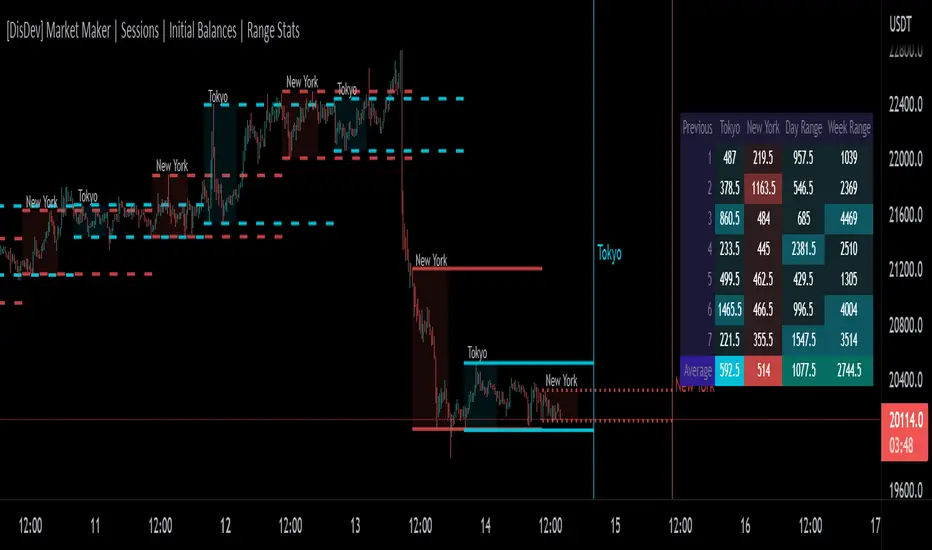
[DisDev] Market Maker | Sessions | Initial Balance | Range StatsThis indicator has two main components: Time-Specific Sessions and High/Low Statistics . There are also several subcomponents: Day of Week Separators, Specific Session High/Low Extenders, Day Range Statistics, Week Range Statistics, User Input Session Titles, etc.
Each component is explained and demonstrated how it could be utilized as a trading tool.
The basis of this indicator is to analyze session-specific price movements through automatic display and statistics.
Key:
Dotted lines = Developing Session
Solid Line = Session complete
Dashed lines = Past Session
1) The primary function is the five manual time-session inputs. These sessions could be based on a full market period, such as London Open to Close (0800 UTC to 1630 UTC), the Initial Balance of the day (0000 UTC to 0100 UTC), or a session Initial Balance New York (1430 UTC to 1530 UTC). The user can update settings input text to reflect this on the chart.
The following shows the example noted above, with the added subcomponents of:
• Shaded areas to define each session
• Extension of the Sessions highs and lows (extension 24/48/72-hour options)
• Future line projection (provides a reminder of when the market opens)
This allows you to see potential levels of resistance and support and market open volatility.
The below example shows the input sessions configured for five Session Initial Balances. You can see that the Sessions Initial Balances were in a tight price range. A range breakout occurred with price move of $1400 visualized.
2) The secondary function is the Range statistics. Range statistics can be used to track the volatility of each session, day or week and can be selected for up to 31 days. This helps the user to determine overbought or oversold conditions as well as pattern recognition.
Trade Example 1
Settings: New York Session Open to Session Close.
The colored boxes are manually drawn to emphasize how the New York Lows and Highs can act as a confluence for support and resistance areas.
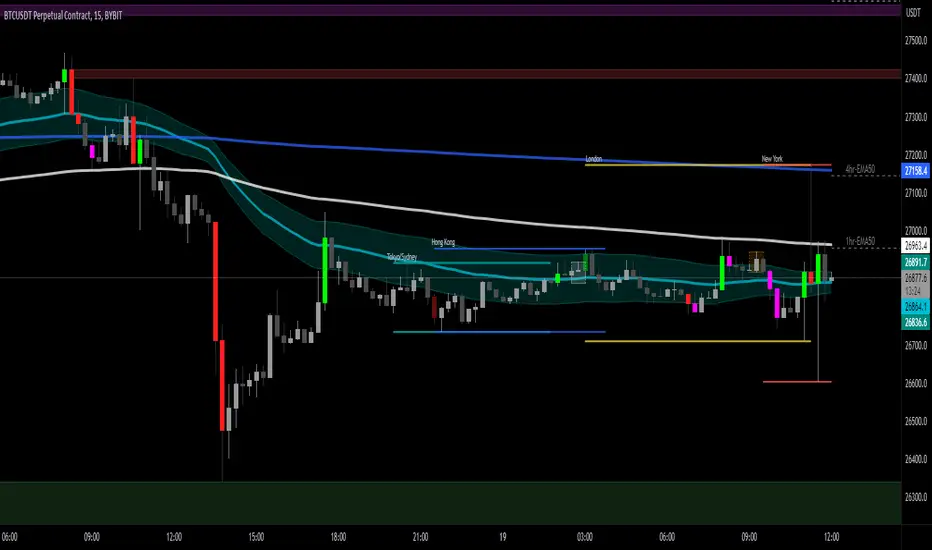
Trade Example 2a
Settings: London Session Open to Session Close and New York Session Open to Session Close.
This chart shows how the Session Open (in this case, the New York Open) reminder notifies you that there could be volatility when a new session opens.
Trade Example 2b
Notice how price breaks to the upside at the opening of the New York session. In this instance it was a $2,250 or 5.17% increase in the opening hour.
3. Once London closes New York has control of the market; one push-up stops out the shorts that placed stop losses at the London high, then brings price back down to the mean.
By having the reminder lines and shaded sessions, the user is prepared and can anticipate some price reaction, often a reversal if price has been steadily moving in one direction.