SevenDayHighLowTableWithBoxes [CHE]SevenDayHighLowTableWithBoxes — Seven-day day-range boxes with a weekday-aware “ghost” projection and a compact table that tracks recent extremes and per-weekday hit rates.
Summary
This indicator visualizes each trading day as a colored box and annotates the final high and low with compact markers. It maintains a rolling seven-day view and a five-column table showing day name, high, low, range, and a per-weekday projection hit statistic. A dashed “ghost” box projects a typical range for the current weekday using a running average and an adjustable scaling factor. The script is written in Pine v6, runs on the main chart (overlay true), and emphasizes stable object handling and closed-bar finalization at day boundaries.
Motivation: Why this design?
Intraday traders often need fast context for where today’s price sits relative to recent daily extremes, without switching timeframes. A simple daily high/low overlay is informative but lacks structure, sizing context, and continuity. By grouping bars into local days (configurable UTC offset), drawing explicit boxes, and projecting a weekday-typical range, the chart becomes easier to scan. The compact table gives a quick audit trail of the latest seven days while tracking how often the weekday projection would have covered the realized range.
What’s different vs. standard approaches?
Reference baseline: Plain daily high/low lines or session boxes without context.
Architecture differences:
Weekday-tinted boxes and labels for today plus up to six prior days.
Weekday average range drives a dashed projection (“ghost”) sized by a user-defined percentage.
Per-weekday hit statistics recorded as hits over totals and displayed in the table.
ATR-based vertical offsets keep labels readable.
Live updates intraday; state is finalized at the local day switch.
Practical effect: The chart shows where current price sits inside a known daily envelope, plus how “typical” the day’s movement is for this weekday, aiding expectations and planning.
How it works (technical)
The script computes a local daily timestamp using the user’s UTC offset. A day change finalizes the prior day, writes its high, low, start and end indices, and records the bar indices of the terminal high and low.
For each weekday, it maintains a running average of realized ranges with a cap on the lookback count. The ghost projection length is the weekday average scaled by the user’s percentage setting.
Anchor selection for the ghost uses the most recent extreme and the close relative to the intraday midpoint to choose a low-anchored or high-anchored box.
A five-column table (Day, High, Low, Range, Ghost OK) is refreshed on the last bar. The “Ghost OK” column shows per-weekday cumulative hits over totals with a percentage, calculated before including the just-finished day.
Object counts are bounded to seven days by pruning arrays and deleting old boxes and labels. Visual updates for historical objects occur on the last bar to minimize overhead. No `security()` calls are used.
Parameter Guide
UTC (+/−) — Controls local day boundaries — Default: minus five hours — Set to your venue’s local time.
Session (for Time gate) — Session string — Default: full week — (Optional) computed internally; not applied to gating.
Show 7-Day High/Low Table — Toggles the table — Default: true — Disable to reduce UI load.
Show Day Boxes in Chart — Toggles day boxes — Default: true — Disable for a cleaner chart.
Table Position — Nine-point anchor — Default: Middle Right — Move to avoid overlap.
Table Background / Text Color / Min Cell Width — Styling controls — Defaults: gray background, white text, width twelve characters.
Weekday Colors (Sun…Sat) — Row and box tints — Defaults: semi-transparent hues — Adjust for your theme.
Triangle Transparency — Marker opacity — Default: zero — Increase to fade high/low dots.
Day Label Transparency — Day name opacity — Default: zero — Increase to reduce emphasis.
Box Border Width — Box stroke width — Default: one — Increase for stronger edges.
Extend Boxes Right — Extend current box — Default: false — Useful for forward planning.
Show Average Range Ghost Box — Dashed projection — Default: true — Disable if distracting.
Ghost Border Color / Width — Ghost styling — Defaults: gray, width one.
Ghost Length percent of AvgRange — Projection scale — Default: one hundred; bounds zero to five hundred — Lower to be conservative.
Max History Days for Average — Cap per-weekday averaging — Default: two hundred fifty-two; bounds thirty to five hundred.
ATR Length / Day Label ATR Multiplier / Triangle Up ATR Multiplier / Triangle Down ATR Multiplier — Offsets for label placement — Defaults: length one hundred; multipliers zero — Increase on dense instruments to prevent overlap.
Reading & Interpretation
Day boxes: The filled rectangle marks each day’s full high-low span; color encodes the weekday.
Markers: Small dots near the terminal high and low highlight where the final extremes occurred.
Ghost box: A dashed box sized by the weekday average range, anchored based on recent behavior. It is a typical span, not a target.
Table: Row one shows “Today”. Rows below list up to six prior days. “Ghost OK” shows per-weekday cumulative hits over totals with a percentage, which reflects historical coverage quality for that weekday.
Practical Workflows & Combinations
Trend following: Use the current box plus recent boxes to read expansion or compression days; combine with basic structure such as higher-highs and higher-lows or lower-lows and lower-highs for confirmation.
Exits and risk: When price nears the ghost boundary late in the session, consider managing exposure more conservatively.
Multi-asset and multi-timeframe: Works on minute charts. As a starting point, use five to less than sixty minutes. For cross-checks, pair with a higher timeframe bias filter.
Behavior, Constraints & Performance
Repaint/confirmation: The indicator updates intraday; extremes and ghost position can move while the day is open. Values are finalized on the next local day start.
HTF/security: None used; repaint risk is limited to live-bar movement.
Resources: `max_bars_back` five thousand; arrays are pruned to seven days; the table and color sync run on the last bar; the live ghost updates only in real time.
Known limits: Weekday averages can be unrepresentative during regime shifts, events, or gaps. Day boundaries depend on the UTC offset being set correctly. No alerts are included. The script displays warning labels when the timeframe is below five minutes or at sixty minutes and above.
Sensible Defaults & Quick Tuning
Start with the defaults.
Ghost too aggressive: Lower the percent scale.
Labels overlap: Increase ATR multipliers.
Clutter or performance issues: Hide the table or boxes, or disable the ghost.
Day boundary misaligned: Adjust the UTC offset to your market.
What this indicator is—and isn’t
This is a visualization and context layer for daily extremes and a weekday-based typical span. It does not predict direction, does not manage orders, and is not a complete trading system. Use it alongside market structure, risk controls, and position management.
Disclaimer
The content provided, including all code and materials, is strictly for educational and informational purposes only. It is not intended as, and should not be interpreted as, financial advice, a recommendation to buy or sell any financial instrument, or an offer of any financial product or service. All strategies, tools, and examples discussed are provided for illustrative purposes to demonstrate coding techniques and the functionality of Pine Script within a trading context.
Any results from strategies or tools provided are hypothetical, and past performance is not indicative of future results. Trading and investing involve high risk, including the potential loss of principal, and may not be suitable for all individuals. Before making any trading decisions, please consult with a qualified financial professional to understand the risks involved.
By using this script, you acknowledge and agree that any trading decisions are made solely at your discretion and risk.
Do not use this indicator on Heikin-Ashi, Renko, Kagi, Point-and-Figure, or Range charts, as these chart types can produce unrealistic results for signal markers and alerts.
Best regards and happy trading
Chervolino
Daytrader

Institutional Zones: Opening & Closing Trend HighlightsDescription / Content:
Track key institutional trading periods on Nifty/Bank Nifty charts with dynamic session zones:
Opening Volatility Zone: 9:15 AM – 9:45 AM IST (Green)
Closing Institutional Zone: 1:30 PM – 3:30 PM IST (Orange)
Both zones are bounded by the day’s high and low to help visualize institutional activity and price behavior.
Key Observations:
Breakout in both closing trend and opening trends often occurs on uptrending days.
Breakdown in both closing range and opening range usually happens on downside trending days.
Price opening above the previous closing trend is often a sign of a strong opening.
This script helps traders identify trend strength, breakout/breakdown zones, and institutional participation during critical market hours.
Disclaimer:
This indicator is for educational and informational purposes only. It is not a financial advice or recommendation to buy or sell any instrument. Always confirm with your own analysis before taking any trade.
Pine Script Features:
Dynamic boxes for opening and closing sessions
Boxes adjust to the day’s high and low
Optional labels at session start
Works on intraday charts (1m, 5m, 15m, etc.)
Usage Tip:
Use this indicator in combination with trend analysis and volume data to spot strong breakout/breakdown opportunities in Nifty and Bank Nifty.

TQ's Support & Resistance(My goal creating this indicator): Provide a way to categorize and label key structures on multiple different levels so I can create a plan based on those observable facts.
The Underlying Concept / What is Momentum?
Momentum indicates transaction pressure. If the algorithm detects price is going up, that would be considered positive momentum. If the algorithm detects price is going down negative momentum would be detected.
The Momentum shown is derived from a price action pattern. Unlike my previous Support & Resistance indicator that used Super Trend, this indicator uses a unique pattern I created. On the first bar bearish momentum is detected a resistance Level is made at the highest point of the previous bullish condition. On the first bar bullish momentum is detected a support Level is made at the lowest point of the previous bearish condition. This happens on 5 different Momentum Levels, (short-term to long-term). I currently use this pattern to trade so the source code is protected.
What is Severity?
Severity is How we differentiate the importance of different Highs and Lows. If Momentum is detected on a higher level the Supply or Demand Level is updated. The Color and Size representing that Level will be shown. Demand and Supply Levels made by higher levels are more SEVERE than a demand level made by a lower level.
Technical Inputs
- to ensure the correct calculation of Support and Resistance levels change BAR_INDEX. BAR_INDEX creates a buffer at the start of the chart. For example: If you set BAR_INDEX to 300. The script will wait for 300 bars to elapse on the current chart before running. This allows the script more time to gather data. Which is needed in order for our dynamic lookback length to never return an error (Dynamic lookback length can't be negative or zero). The lower the timeframe the greater the number of bars need. For Example, if I open up a 1min chart I would enter 5000 as my BAR_INDEX since that will provide enough data to ensure the correct calculation of Support and Resistance levels. If I was on a daily chart, I would enter a lower number such as 800. Don't be afraid to play around with this.
- Toggle options (Close) or (High & Low) creates Support and Resistance Levels using the Lowest close and Highest close or using the Lowest low and Highest high.
Level Inputs
- The indicator has 5 Different Levels indicating SEVEREITY of a Supply and Demand Levels. The higher the Level the more SEVERE the Level.
Display Inputs
- You have the option to customize the Length, Width, Line Style, and Colors of all 5 different
- This indicator includes a Trend Chart. To Easily verify the current trend of any displayed by this indicator toggle on Chart On/Off. You also get the option to change the Chart Position and the size of the Trend Chart
How Trend Is being Determined?
(Close > Current Supply Level) if this statement is true technically price made a HH, so the trend is bullish.
(Close < Current Demand Level) if this statement is true technically price made a LL, so the trend is bearish.
- Fully customize how you display Market Structure on different levels. Line Length, Line Width, Line Style, and Line color can all be customized.
How it can be used?
(Examples of Different ways you can use this indicator): Easily categorize the severity of each and every Supply or Demand Level in the market (The higher Level the stronger the level)
: Quickly Determine the trend of any Level.
: Get a consistent view of a market and how different Levels are behaving but just use one chart.
: Take the discretion from hand drawing support and resistance lines out of your trading.
: Find and categorize strong levels for potential breakouts.
: Trend Analysis, use Levels to create a narrative based on observable facts from these Levels.
: Different Targets to take money off the table.
: Use Severity to differentiate between different trend line setups.
: Find Great places to move your stop loss too.

JJ Open High and Open Low FinderThis script identifies candles where the open price matches the high price (Open High) and where the open price matches the low price (Open Low). It highlights these candles with labels directly on the chart, making it easy for traders to spot these conditions in real-time.
Features :
- Red "OH" label below candles for Open High.
- Green "OL" label above candles for Open Low.
Use this tool to enhance your trading insights.
** Disclaimer **: This script is for educational purposes only and should not be considered financial advice.

MM Day Trader LevelsAs an intraday trader, there are certain key levels that I care about for short-term price action on every single chart. When I first began day trading, each morning I would painstakingly mark those key levels off on the charts I planned to trade each day. Depending on the number of charts I was watching, this would take up quite a bit of my time that I felt would have been much better spent doing other things. It also meant that those levels would often be left behind, and on later days I might be trading a symbol and get confused when a line appeared and I'd be paying attention to it only to later discover that it wasn't from prior day, but from some other day in the past when I had marked it off.
I looked all over TradingView to find indicators that did this automatically for me, and I found a lot of them. One by one I tried them, and inevitably I would always find that something was wrong with them. Often they didn't have all of the levels I wanted (so I would have to combine multiple indicators), but more often I found that the levels would be incorrect, or they would be buggy and not appear consistently, or they would not appear at the right time, or they would not work on futures! The list of problems went on and on. And the biggest issue I found was that nobody knew how to get session volume profile in an indicator.
So, over the course of a few years I figured out how to solve all of those problems and now I'm thrilled to present this free indicator for everyone like me who trades intraday and wants a clean consistent way to see the prior day levels that they care about automatically on every single chart (even futures). The levels the indicator provides are:
Yesterday High & Low
Value Area High & Low & Point of Control
Today's Open
Yesterday's Close (aka "Settlement" on futures)
Premarket High & Low (non-futures only)
Overnight High & Low (futures only)
These levels are extremely important, and I expect price to be reactive to them, so each level has a shaded background behind it so that the levels stand out against other lines you may have on your chart. I try to keep configuration as simple as possible, but there are configuration options that allow you to:
Hide any of the levels
Change the color for the levels
Shade the value area (or not)
Change the label text, size, type (basic label or plain text) and location (how far to the right of last candle to place the label
Adjust session volume profile value area volume & number of rows
The biggest advantage to this indicator over others on TradingView is how it handles session volume profile. When it comes to futures, TradingView does differentiate between regular trading hours and "electronic" trading hours on the charts, but their timeframes for those sessions are unusual, and they do not provide any programmatic way to differentiate between them. So, I created a whole new library for dealing with futures sessions that is fully integrated into both my Session Volume Profile library and this indicator, allowing me to bring you the best and only custom indicator available on TradingView that provides you with true regular session volume profile information across every type of symbol, including futures.
I'm incredibly proud of everything I've been able to provide with this indicator, and even more thrilled to say that I'm proud of how the indicator has been implemented. Once again releasing this indicator and all associated code for free and open source. I encourage you to take a look at the source code to see how it all works, take advantage of the free underlying libraries I created to make all of this possible: Session Library and Session Volume Profile Library.

ToxicJ3ster - Day Trading SignalsThis Pine Script™ indicator, "ToxicJ3ster - Signals for Day Trading," is designed to assist traders in identifying key trading signals for day trading. It employs a combination of Moving Averages, RSI, Volume, ATR, ADX, Bollinger Bands, and VWAP to generate buy and sell signals. The script also incorporates multiple timeframe analysis to enhance signal accuracy. It is optimized for use on the 5-minute chart.
Purpose:
This script uniquely combines various technical indicators to create a comprehensive and reliable day trading strategy. Each indicator serves a specific purpose, and their integration is designed to provide multiple layers of confirmation for trading signals, reducing false signals and increasing trading accuracy.
1. Moving Averages: These are used to identify the overall trend direction. By calculating short and long period Moving Averages, the script can detect bullish and bearish crossovers, which are key signals for entering and exiting trades.
2. RSI Filtering: The Relative Strength Index (RSI) helps filter signals by ensuring trades are only taken in favorable market conditions. It detects overbought and oversold levels and trends within the RSI to confirm market momentum.
3. Volume and ATR Conditions: Volume and ATR multipliers are used to identify significant market activity. The script checks for volume spikes and volatility to confirm the strength of trends and avoid false signals.
4. ADX Filtering: The ADX is used to confirm the strength of a trend. By filtering out weak trends, the script focuses on strong and reliable signals, enhancing the accuracy of trade entries and exits.
5. Bollinger Bands: Bollinger Bands provide additional context for the trend and help identify potential reversal points. The script uses Bollinger Bands to avoid false signals and ensure trades are taken in trending markets.
6. Higher Timeframe Analysis: This feature ensures that signals align with broader market trends by using higher timeframe Moving Averages for trend confirmation. It adds a layer of robustness to the signals generated on the 5-minute chart.
7. VWAP Integration: VWAP is used for intraday trading signals. By calculating the VWAP and generating buy and sell signals based on its crossover with the price, the script provides additional confirmation for trade entries.
8. MACD Analysis: The MACD line, signal line, and histogram are calculated to generate additional buy/sell signals. The MACD is used to detect changes in the strength, direction, momentum, and duration of a trend.
9. Alert System: Custom alerts are integrated to notify traders of potential trading opportunities based on the signals generated by the script.
How It Works:
- Trend Detection: The script calculates short and long period Moving Averages and identifies bullish and bearish crossovers to determine the trend direction.
- Signal Filtering: RSI, Volume, ATR, and ADX are used to filter and confirm signals, ensuring trades are taken in strong and favorable market conditions.
- Multiple Timeframe Analysis: The script uses higher timeframe Moving Averages to confirm trends, aligning signals with broader market movements.
- Additional Confirmations: VWAP, MACD, and Bollinger Bands provide multiple layers of confirmation for buy and sell signals, enhancing the reliability of the trading strategy.
Usage:
- Customize the input parameters to suit your trading strategy and preferences.
- Monitor the generated signals and alerts to make informed trading decisions.
- This script is made to work best on the 5-minute chart.
Disclaimer:
This indicator is not perfect and can generate false signals. It is up to the trader to determine how they would like to proceed with their trades. Always conduct thorough research and consider seeking advice from a financial professional before making trading decisions. Use this script at your own risk.

Days and Session
This indicator optionally displays 2 informations:
- The Day of the week
- The New session's Candle
You can turn off/on the displayed information
Disclaimer: Scripts that I post publicly are experimental. They are not financial advices. Always backtest your ideas using your own methodologies.

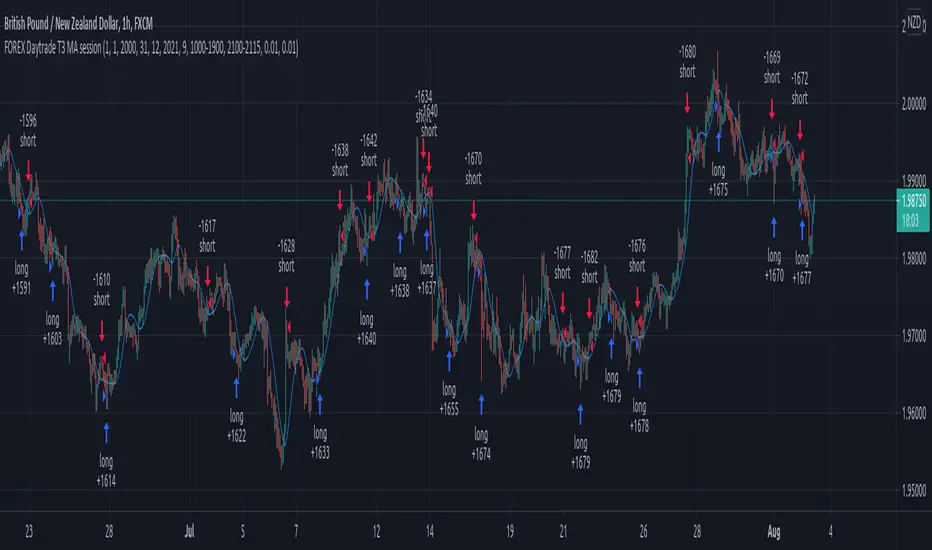
Forex Daytrade T3 MA sessionThis is a simple yet very efficient daytrading strategy for most crosses pairs, like EUR/NZD, EUR/AUD , GBP/NZD, GBP/AUD and so on.
It tends to works best with 1h and 15 min time frame charts.
Its components are :
Entry time = session that we want to trade, where we can combine for example half of London and all of NY using an hour system.
T3 Moving average
Price action.
Rules for entry
For long , we are during the hours we want to trade, current close is price is above previous high and at the same time is above moving average
For short , we are during the hours we want to trade, current close is price is below previous low and at the same time is below moving average
Rules for exit
We exit when either the opposite condition is triggered, if the hours of trading are off or based on a percentage TP/SL system movement.
For this example we use 1% movement both for TP and SL
If you have any questions, let me know !
JPY GBP ROCsRate of change of most volatile JPY and GBP pairs. All pairs ending in JPY are red except GBPJPY (colored yellow --currently most volatile 7/2016). GBPNZD is blue, the other GBP pairs are green, lime and teal. GBPJPY and GBPNZD are my favorite day trading / swing trading pairs. This script allows me to see the action of the most volatile and liquid pairs on one screen. JPY pairs (ex-GBPJPY) are all red so that I see the flow of JPY not so much each pair and its name. Global movement of JPY is what I am after. Same for the coloring of GBP pairs as green expect GBPNZD as blue. ***** EURGBP is plotted as an opposite (with a negative in front of its sma. EURGBP is extremely correlated to GBPNZD, I decided to plot it also.
