[TTI] Zanger Volume Ratio - Intraday––––HISTORY & CREDITS 🏦
The Zanger Volume Ratio - Intraday indicator is inspired by the work of Dan Zanger, a renowned trader and creator of the Zanger Volume Ratio tool. This specific adaptation of the ratio is designed for the TradingView platform and focuses on intraday trading. Dan Zanger used this same method of reading the chart to establish a world record in turning HKEX:10 ,775 into HKEX:18 ,000,000 in under 2 years.
––––WHAT IT DOES 💡
The Zanger Volume Ratio - Intraday indicator measures the estimated end-of-day volume percentage based on intraday (depending on the timeframe of your chart) comparisons for the last X days (input in the settings). It provides insights into the stock's trading volume in real-time throughout the trading day, giving traders an idea of the stock's relative volume compared to its recent trading history. For instance if you add it to a 5min chart the ratio represents the estimated end of day volume percent based on the last 3 days, the indicator will compare the cumulative volume of the current day to the X days back cumulative average up to that same point in time and tell you how it is around the thresholds.
The indicator categorizes the volume into five levels: Extreme, High, Average, Light, and Dry Up, each represented by different colors on the chart. It also displays a pace indicator, which shows whether the volume is increasing or decreasing during the trading session.
There is also a label that shows the current reading and its pace. The pace is the indication wether the volume ratio pace is increasing and picking up or it is slowing down.
Thesholds
👉EXTREME (red): >200, means "Volume is 200% of average daily volume
👉HIGH (magenta): 110
👉AVERAGE (peach): 85
👉LIGHT (orange): 60
👉DRY (gray): <60
––––HOW TO USE IT 🔧
To use the Zanger Volume Ratio - Intraday indicator effectively, follow these steps:
1️⃣ Apply the indicator to your TradingView chart with an intraday timeframe (>=1min and less than 1 day).
2️⃣Observe the real-time volume levels and their corresponding categories (Extreme, High, Average, Light, and Dry Up) to understand the current volume dynamics.
3️⃣Keep an eye on the pace indicator (arrows) to see if the volume is increasing or decreasing during the session.
4️⃣Use the information provided by the indicator to confirm trade setups, identify potential breakouts, or detect possible reversals. For example, a stock breaking out of a key area with high or extreme volume and an increasing pace arrow may indicate a strong upward move. Conversely, a stock pulling back on light or dry up volume could signal a continuation of the trend once the volume picks up again.
Remember to combine the Zanger Volume Ratio - Intraday indicator with other technical analysis tools and your own trading strategy to make informed decisions.
DAN

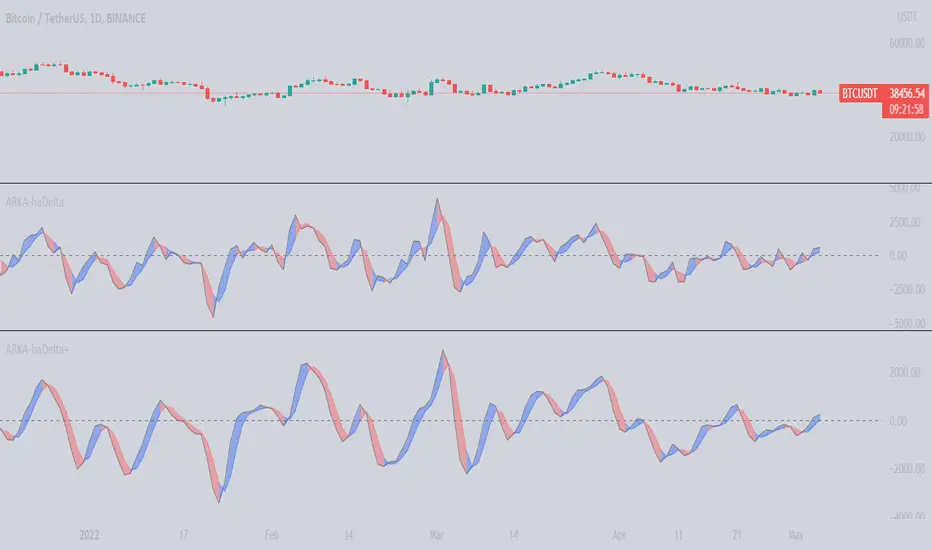
ARKA-haDelta+This Indicator is based on Mr. Dan Valcu ideas.
Bodies of candles(open-close) are the main component used to indicate and assess trend direction, strength, and reversals.
The indicator measures difference between Heikin Ashi close and open.
Measuring the height of candle bodies leads to extreme values that point to trend slowdowns. Thus quantifies Heikin Ashi to get earlier signals.
I used this indicator on Heiken Ashi charts but, it's possible to choose to calculate Body size based on Heiken Ashi or Candles.
haDelta can be smoothed with a simple moving average .
We see that crossings between the haDelta and SMA confirm trend changes with an anticipated delay introduced by each average. Crossings between the indicator and its average are better
confirmations of trend changes.
When Delta crosses above SMA it is an uptrend.
When Delta crosses below SMA it is a downtrend.
Default haDelta smoothed value is by applying 3 periods SMA .
Also, it is possible to deactivate SMA and see just The Delta Values.
In this indicator can choose the MA period and type.
This version has an option that makes it possible to draw dynamic levels. By choosing Dynamic from levels Type and set your preferred length.
The Length value is the max value in the past candles that are used to draw the levels.
In this version, I added the Z-score level. By choosing z-score areas the z-score is above 2 or below -2 shown by colors. I also added Alert ability into the indicator. The alert has two modes. First, when level type equals Z-Score it shows signals where delta cross ma and Z-Score are below or above high and low levels.
The second mode is when the level type is not Z-Score it shows delta cross ma.
So far, this is the description of the indicator(haDelta), which has been written separately and published for the public. In this indicator, we intend to smooth the value of haDelta we get using moving averages.
A simple three-day moving average has been applied to the Delta(3) and its MA to reduce the number of false signals generated by haDelta.
haDelta+=SMA(haDelta,3)
SMA(haDelta+,3)=SMA(haDelta+,3)
[TTI] ZVR Watchlist––––History & Credit ––––––––––––––––––––––––––––––––––––––––––––––––––––––––––––––
This indicator/screener is inspired by the methodology of a great momentum master - Dan Zanger. Dan holds the world record for higher % gain in a 12month period, which was achieved in 1998 and has not been broken since. One of the secrets he has shared with the world is his famous Zanger Volume Ratio (ZVR), to which his attributes great part of his success.
–––––What it does –––––––––––––––––––––––––––––––––––––––––––––––––––––––––––––––
The script allows you to monitor your watchlist for the most important momentum indicators on an intraday basis in order to maximise your chance of jumping in the right time.
1️⃣ ZVR - pre breakout indicator
ZVR measures unusual momentum at a given time of the day.
Example
Imagine it is the first hour of the trading session and you get AAPL with a daily volume (up to that time) of 2mn shares. Is this normal or not? If you just compare it to the average volume you will be making a logical mistake, since you have 7more hours for volume to reach the "average" level. Henceforth, average volume should be compared on an end of day basis. However, the ZVR looks at the current intraday cumulative volume at any particular time of day, and compare that to the average cumulative volume that has usually traded by that time of day in the past.
The 4 colors are 4 types:
🔴 (RED) — Volume is over 200% of the usual cumulative intraday volume for that day
🟣 (PURPLE) — Volume is between 150% and 200% of the usual cumulative intraday volume for that day
💓 (PINK) — Volume is between 100% and 150% of the usual cumulative intraday volume for that day
🟠 (ORANGE) — Volume is between 50% and 100% of the usual cumulative intraday volume for that day
🌚 (GRAY) — Volume is under 50% of the usual cumulative intraday volume for that day
2️⃣ SQN
The SQN is defined by the late Market Wizard Dr. Van Tharp: "A measure of a market’s movement through an application of the System Quality Number calculation. To calculate, the daily changes from close to close measured in percentage terms are averaged and the standard deviation is calculated. Plugged into the SQN formula, those values and the number of days (N) provide the market SQN score."
👉 Super Bullish - denoted by SB and lime color
👉 Bullish - denoted by B and green color
👉 Neutral - denoted by N and cyan/aqua color
👉 Bearish - denoted by Br and dark red color
👉 Super Bearish - denoted by SBr and light red color
–––––How to use it –––––––––––––––––––––––––––––––––––––––––––––––––––––––––––––––
I use the indicator very much like a watchlist. I put it on a secondary chart and load up all the stocks that I have identified as a buyable. I then wait to get signs of breakout. My favourites are stocks which are in SuperBullish trend (SQN) and starting to show RED ZVR in the beginning of the day. Often these are very strong names that show institutional buying. I purchase close to pivot point and hold for a swing trade. If the stock advances too fast 5-7% on the day, I take some off into strength.
Suggested use for this indicator is to combine with any volatility contraction methodology. Some examples include the TTM Squeeze, Squeeze Pro or my personal favorite Mark Minervini's Volatility Contraction Pattern (VCP).
Look for stocks in a long term uptrend (we have another indicator for Stage 2 identification).

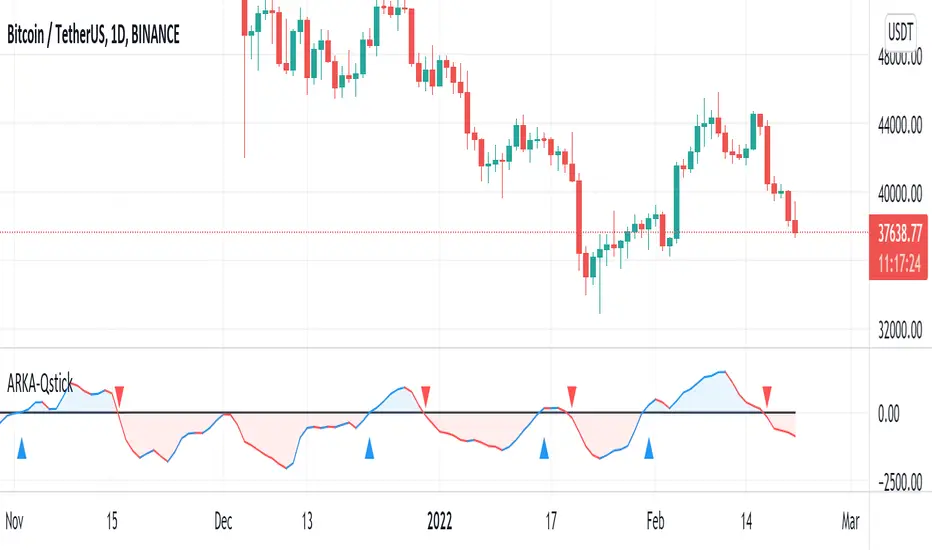
Qstick IndicatorThis indicator idea comes from Tushar Chande called Qstick.
Technical indicators quantify trend direction and strength in different ways.
One way is to use the difference between close and open for each bar and to sum it up over a period of time.
The formual is:
Qstick (period ) = Average ((close-open ), period )
In this indicator, we can choose how to calculate body by two famous chart types. The first and default indicator settings are based on Heiken Ashi chart, and the second is based on the Candlesticks chart.
If the resulting value is positive, the trend is considered up and shows with the blue color; otherwise,
the trend is considered down it shows with red color.
When Qstick value is greater than zero means that the majority of the last 'n' days(the default value is 8)
have been up, indicating that buying pressure has been increasing. Vice versa, when Qstick value is lower than zero means that the majority of the last 'n' days have been down, indicating that selling pressure has been increasing.
Crossing Qstick above Level Zero is used as bullish bias (long entry signal) because it is indicating
that buying pressure is increasing, while bearish bias (short entry signal) comes from the indicator
crossing down through zero. This indicator can be part of trading systems and we can use it to confirm our signals.
Also, We can active Alert checkpoint to show cross points and activate Alerts.
Psychological LineThis indicator can be shown by the number of bars with consecutive higher closing prices over a period of time. The maximum value is equal to the period.
The default period value is 12.
Thresholds used with this period are 3, 6, and 9.
A drop below 3 suggests an approaching low, and a crossover above 9 warns about an upcoming top.
In this period, 6 is a neutral value and represents the borderline separating uptrends and downtrends.
