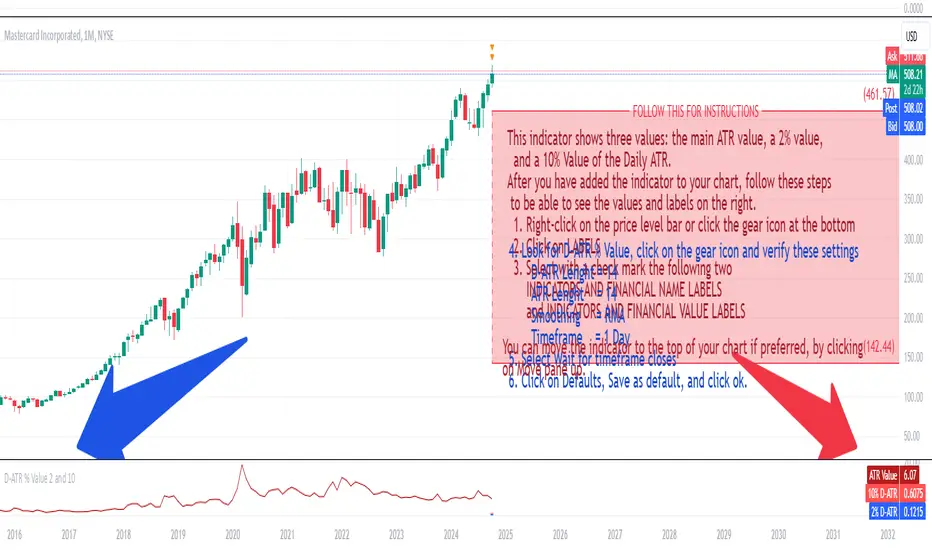
ATR Price ZoneThe ATR Price Zone is an indicator which takes the Daily Average True Range of a stock and shows how high and low the price of the stock could possibly go from the opening price.
Key features:
The ATR Price Zone is an indicator which takes the Daily Average True Range of a stock and shows how high and low the priced the stock could possibly go from the opening price.
Key features:
ATR Price Zone uses zones looking forward to help strategize possible movements in price.
This indicator is customizable with zones, horizontal lines, a quick reference chart and colors.
The indicator continues to move forward with the chart.
It references the Daily True Average Range regardless of which Time Frame you are using.
It also references the opening candle with a blue arrow when using less than daily time frames.
Create by BothwellTrader
Dailyatr
Daily ATR 2 and 10 Percent Value
This indicator shows three values: the main ATR value, a 2% value,
and a 10% Value of the Daily ATR.
After you have added the indicator to your chart, follow these steps
to be able to see the values and labels on the right.
1. Right-click on the price level bar or click the gear icon at the bottom
2. Click on LABELS
3. Select with a check mark the following two
INDICATORS AND FINANCIAL NAME LABELS
and INDICATORS AND FINANCIAL VALUE LABELS
4. Look for D-ATR % Value, click on the gear icon and verify these settings
- D-ATR Lenght = 14
- ATR Lenght = 14
- Smoothing = RMA
- Timeframe = 1 Day
5. Select Wait for timeframe closes
6. Click on Defaults, Save as default, and click ok.
You can move the indicator to the top of your chart if preferred, by clicking
on Move pane up.
Slightly modifications from other indicators.
ATR Daily LevelsPlots the daily ATR on the chart as upper and lower levels.
It can be use to adapt your trading in high and low periods of market volatility, determine reasonable target or take profit, entry at likely mean reversion, stop loss beyond normal flows etc...
More on the script behavior:
- Daily ATR upper/lower levels are applied on the current day low/high;
- The ATR value is defined by the last D1 bar;
- Shows up to D1 timeframe;
- Configuration for the indicator's period (default: 20 period ATR);
- Configuration for plotting the indicator on the the x axis with an offset/at begining of the day (default: offset);


