A Deeper Look Into Security Function & Possible ImprovementsThere is a link below that further explain the purpose of this publication.
A fresh new look into the limitations of the security() function and perhaps expand our horizons on having access to more accurate data no matter from what timeframe you are on.
docs.google.com
As always, it is my desire to help the community to continue reaching new highs.
Gráficos Diários

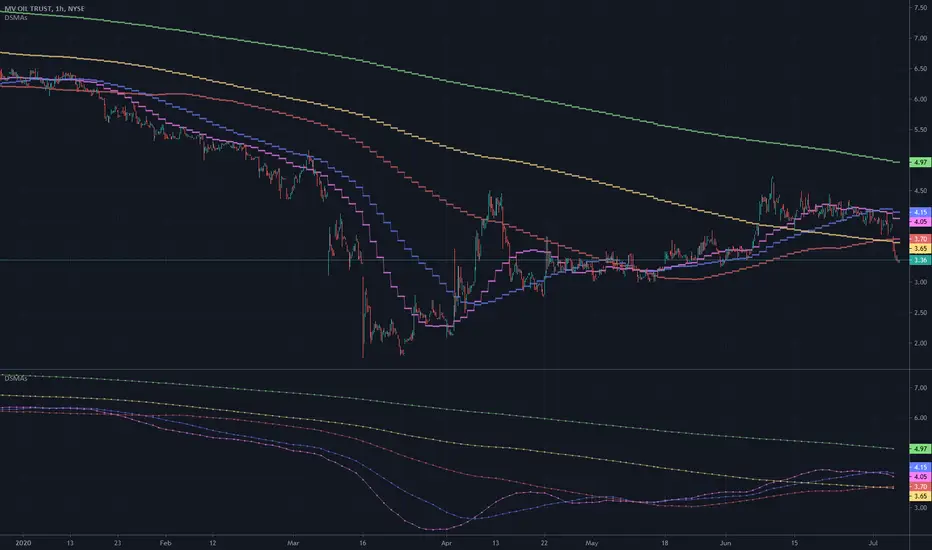
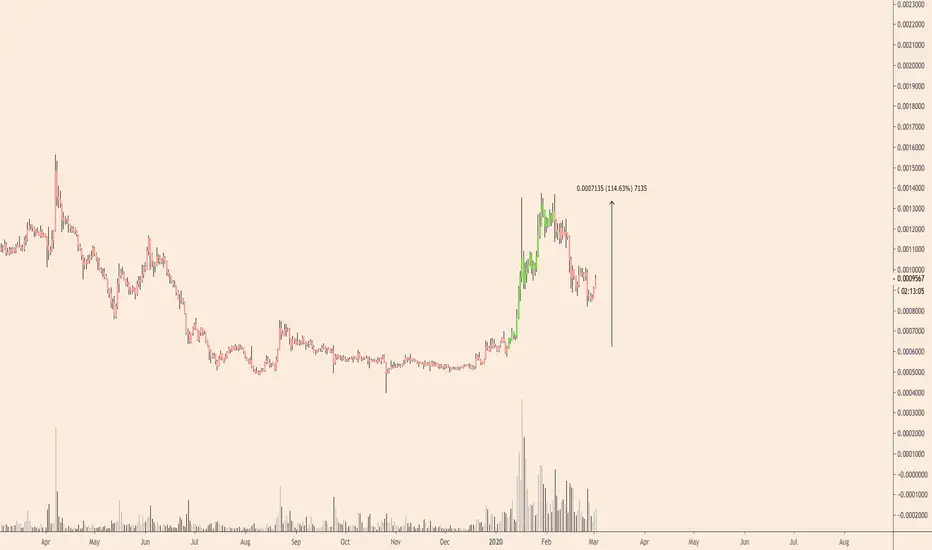
Daily SMAs 10/20/50/100/200This is one of the oldest and simplest trading tools still utilized today, having an ancillary role with long term trading and analyst's commentary in media/news. It's a multicator employing PSv4.0, freely available to ALL, with numerous simple moving averages(SMAs) that use different historical periods of observation in their formulations to portray trading bias. I have revived this tool to my modern expectations of what it could be, embellished with the "Power of Pine".
I provided these moving averages in pastel colors with dotted step-lines as an attempt to not interfere with other "more important indicators" that may exist in your overlay pane. In "Settings" with the "Time Frame" input() set to "Daily", while inspecting much smaller time frames other than daily candles, you may use the sampling quantization tweak to smooth out those step-lines for a different visual appeal. This is exemplified in the lower indicator pane of the chart demonstration above. Also, the brightness control can be quickly and easily fine tuned to your personal preference of visibility that is not distracting. The moving averages are all independently adjustable if you require more responsive calculations with shorter periods of time, or longer...
Features List Includes:
"Daily" or "Chart" time frames
Brightness control
Line thickness adjustment
Sampling quantization tweak
Adjustable periods for the SMAs
The comments section below is solely just for commenting and other remarks, ideas, compliments, etc... regarding only this indicator, not others. When available time provides itself, I will consider your inquiries, thoughts, and concepts presented below in the comments section if you do have any questions or comments regarding this indicator. When my indicators achieve more prevalent use by TV members, I may implement more ideas when they present themselves as worthy additions. As always, "Like" it if you simply just like it with a proper thumbs up, and also return to my scripts list occasionally for additional postings. Have a profitable future everyone!
Candle Crawler V1 [Moon]Candle Crawler is designed to crawl back through candle and bar data to retrieve specific values of interest.
The first implementation shows
Total bars or candles on any specific time frame or asset to the beginning of the chart. This can be used for backtesting or looking for specific assets / time frames that have a lot of backtest data.
- *usually* More backtest data = More accurate strategy implementation or live testing.
Crawls back and counts Red vs Green candles in a defined period (the max is 4999 total bars).
Use this to identify bearish or bullish trends and assets.
- *hint* if an asset through time is leaning heavily one way, a long-only or short-only strategy may be worth investigating.
Plots days of the week on each candle within it's specific day (turned off by default).
Default view of Total Candles + R/G (note if you want to turn off the labels go to the "Style" tab and just uncheck "Labels" at the bottom).
Works on any asset or timeframe including stocks and forex.
Easily filter days on or off to identify specific patterns or trends (check the "days of the week" box for ON|OFF) or head to the "style" tab to customize days or colors.
Most precise on the Daily (D) timeframe, but applicable on any.
If interested send me a DM.

JD ProgressJD Progress Indicator is a two-part algorithm that is designed for both the 4hr and DAILY chart with unique alerts for each timeframe.
This can be applied to Forex, Stocks, Crypto and Metals
How to use;
4hr - When price crosses the channels and the confirmation indicators at the bottom all align, the trade alerts will be shown on screen.
D1 - When the price crosses the channels (no need to wait for confirmation indicators), the trade alerts will be shown on screen
There are a number of rules baked into the code to try and eliminate as many fake signals as possible.
ATR targets and stop losses are also shown on screen and can be hidden if desired. I'd suggest aiming for 1x ATR target and 1.5 ATR Stop Loss. Use two trades and let the second run with a trailing stop.
This algorithm is essentially a reversal system that uses a number of specifically tested and chosen indicators to identify reversals as early as possible.
When to trade.
4hr - I suggest trading Tues - Thurs when trading the 4hr. Background shading will assist with this.
D1 - Trade 5 days a week.
With both timeframes, wait for the bar to close and place a pending order with a 5 pip gap.
JD Core in action
How to Access
Gain access to JD Progress Confirmations for your TradingView account through our website, links below.
7 day paid trials, subscriptions and lifetime access are all available.
All tiers give you full instructions on how to trade this strategy.

ATR Timeframe RangeThis indicator shows the ATR range on the daily or any other timeframe on your current chart. All settings are fully customize-able.

EMA 20/100/200 alwaysThis script will always show the EMA 20/100/200 daily values across any time frame chart (e.g. showing daily 20 EMA while viewing the 5 minute chart)

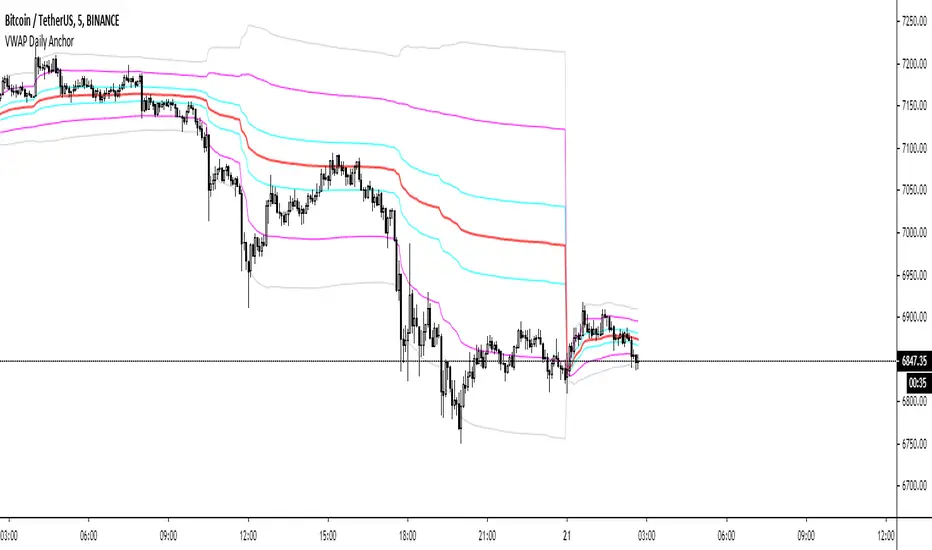
VWAP Daily AnchorAnchored daily VWAP with adjustable standard deviation bands - intended for intraday scalping.
Anchored VWAP is useful because not matter what timeframe you look at it on, it will look the same, unlike normal VWAP indicators. This means there's nothing left to interpretation.
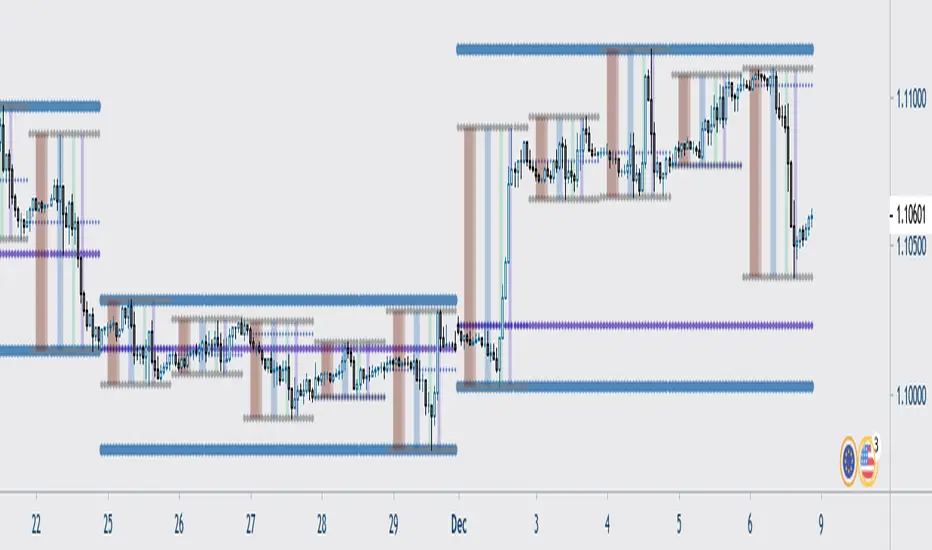
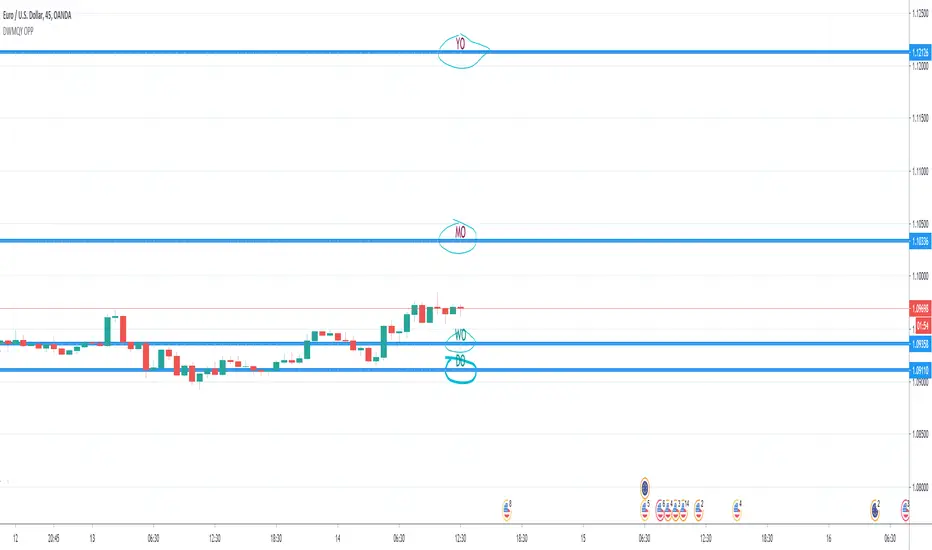
Day & Week & Month & Quarter & Year Open Price PointsPresent to your attention, basic “Day & Week & Month & Quarter & Year Open Price Points Indicator” !
You can determine support & resistance using Yearly, Quarterly, Monthly and Weekly open price points on a chart with any timeframe.
It is not a widely used technique, but according to different academic studies, levels are reliable. Google it! You can enhance your trading by adding that technique in your tool list.
At the current stage, Indicator shows Open Price Points.
Opening price points are extended into the future from the opening candle of each year, quarter, month and week and day.
By nature of that points, every level may be used as a support and as a resistance level at a similar time.
Initial setup:
1) Open the indicator Inputs settings, enable/disable additional Price Points.
2) Open the indicator Style settings, click on a style of each line and click on a “Price Line.”
How to use that?
With a lot of available strategies, there are two leading: Level convergence and Trend line convergence.
1) Level convergence involves locating two or more opening points that merge. This confluence can lead to greater accuracy and profitability.
2) Trend line convergence - The intersection of a trend line at a weekly, monthly, quarterly or even yearly opening level can produce fast and profitable reactions.
Try that!
As a stand-alone strategy, you can utilize that:
Price action under the WO (DO, MO, QO, YO) – Bearish
Price action above the WO (DO, MO, QO, YO) – Bullish
TIP: opening level not always good as a stand-alone tool!
Indicator Settings:
Show Daily Open (disabled by default)
Show Weekly Open (ON by default)
Show Monthly Open (ON by default)
Show Quarter Open (disabled by default)
Show Yearly Open (disabled by default)
Indicator Styling:
By default, each line is shown in the form of circles, line-width 1, silver colour.
Labels can be only in one of two states: Maroon (if open price less than ((open + high + low + close)/4) or Teal (if open price high than ((open + high + low + close)/4).
Alerts:
With the Indicator you can add a few different alerts:
DO Alert
WO Alert
MO Alert
QO Alert
YO Alert
Play with it:
Add a new alert with following condition: your SYMBOL crossing DWMQY OPP Weekly Open.
Options: Once per Bar.
Future of the Indicator:
The Indicator is a necessary part of more prominent Indicator which will include 8 modules in total:
2~ Arabian Wise Tunnels Module
3~ RH Waves Module (something like Vegas Waves)
4~ Trend Channels Module
5~ Opening Range Zoning Module
6~ Breakout Module
7~ BS Hemisphere Module
8~ Price Action Module
DISCLAIMER! RISK WARNING!
PAST PERFORMANCE IS NOT NECESSARILY INDICATIVE OF FUTURE RESULTS. TRADERS SHOULD NOT BASE THEIR DECISION ON INVESTING IN ANY TRADING PROGRAM SOLELY ON THE PAST PERFORMANCE PRESENTED, ADDITIONALLY, IN MAKING AN INVESTMENT DECISION, TRADERS MUST ALSO RELY ON THEIR OWN EXAMINATION OF THE PERSON OR ENTITY MAKING THE TRADING DECISIONS.
//Written by iambitboy request.
D/W/M/Y OpenThis is just a small Script
It show you:
Low and high of
Yesterday, last week, last month and last year
+
Open today

MTF Ichimoku CloudIchimoku Cloud , Multiple Time Frames, based on the script : MTF Selection Framework functions (PineCoders)
Possible display:
- four differents Ichimoku
- Tenkan, Kijun, Chikou and Kumo (monochrome or not)
- labels : offset from line, color if you change style and with/without abbreviation
Time Frames :
- 1m
- 3m
- 5m
- 15m
- 30m
- 45m
- 1h
- 2h
- 3h
- 4h
- Daily
- Weekly
- Monthly

COVID-19: Daily change per capita (EU only)New confirmed cases per day (daily change) is one thing, just an absolute value but when we put this number in context of population (per million people) of each country the situation is a bit different.
We can easily see that, at the moment (Apr 2nd, 2020), the most affected country is Spain (~150 new cases per million people per day) and surprisingly the second one is Switzerland (CH). We can also see Spain or Belgium's steep curve relative to other countries.
I know that some countries run more tests than the others and the outcome might not be reflect the reality but this is the official data that is available.

Ichimoku Timeframe - [Silver-Wong]"Ichi Time" displays an Ichimoku indicator from another timeframe.
IE: Displays Ichimoku Daily while you are on the 4H chart.
Available timeframes:
- 1H
- 4H
- 12H
- Daily
- Weekly

COVID-19: Daily changeNew daily infections (daily change) of COVID-19.
The chart shows new daily cases across the entire planet, the US, EU (de+fr+it+es only) and a small country (RO) that does not matter to anybody but me. You can show/hide different country in Settings.
Select "COVID-19: CONFIRMED" data in main chart and add the indicator.

Levels Compound v.2Daily, weekly, monthly support and resistance levels. Also paints 2 different daily WMAs and the daily weekly monthly avg.

Oasis Group - VWAP / OHLC (Daily / Weekly / Monthly)
5min with the Daily overlay
4hour with the Weekly overly
This Script was influenced be Chris Moody's OHLC Script.
I have created my version of the script and used it to Overlay Daily/Weekly/Monthly Candles over any chosen Intraday Time Frame.
**Important**
The "Stepline" Line style function in pine script is defective so anyone who wants to use this must change all line
styles to "Stepline" manually except for the VWAP Line.
This gives traders a great overall candle experience and also insight into the noise of the intraday.
Intraday traders can keep watch of the highs and Lows along with open and close levels for the larger time frames chosen.
Give us a Follow and Like. This can be used on any Asset class.
I personally use this on Intraday Trading.
Helps me Identify the Prior day Highs and Lows, Closing price compared to the next mornings Opening Price, and daily, weekly, or monthly ranges.
Also included is the powerful VWAP indicator for identifying bullish or bearish pysche.


Special Blend DailyA moving average based indicator intended to be used on the daily time frame.
Look for longs when bars change to green.
Custom Time ranges. Daily price ranges.Addition to previous time range script, now containing daily ranges. You can select a day of the week, and have it show the high, low, mid, and open of that day.
For the time bands:
Monday = 2
Tuesday = 3
Wednesday = 4
Thursday = 5
Friday = 6
Saturday = 7
Sunday = 1
Example 1:
1500-1800:2
This will colour the background between 3pm and 6pm on Mondays.
Example 2:
0000-0600:247
This will colour the background between midnight and 6am on Mondays, Wednesdays, and Saturdays.
For the Daily price ranges:
Just select the tick-box forthe day, and then the price levels you'd like to see.
I want to add specific weekly levels to this, for example: week 06 of year 2020, but I've not figured out how to do it yet. If anyone knows, I'd appreciate it if you let me know. I'll then update this script.
As always, any questions you may have, please leave in comments below and I'll respond when I have time.
If you notice anything good with this indicator, let me know. We are all in this to make money after all! ;)

RVC-Weekly-Pivots-GANN-LevelsPurpose:
Weekly - Fibonacci pivot levels and Gann levels calculation and marking on Chart automatically.
Mainly expected to use for trading on NIFTY and BankNifty
Kindly share your comments and suggestions to improve

MultiTimeFrame Fractals D W M [xdecow]This indicator shows fractals in different timeframes. With the possibility of coloring the bars with any combination of current, daily, weekly and monthly timeframes.
The return points are calculated as follows:
high > last 3 highs and close above highest low
low < last 3 lows and closes below lowest high
The direction of higher timeframes fractals tend to be more durable and reliable. This indicator helps to find the fractal alignment of different timeframes, so that you can look for trade opportunities in the same direction as the higher timeframes and improve your chances.

High, Low and MidpointThis indicator plots the daily high and low from the previous day. (BLACK)
It then calculates the midpoint of the high and low and plots this. (RED)
This indicator can be used to identify daily ranges and to identify possible support and resistance levels.

Crypto Daily-Weekly Range + KZsWeekly OHL + Daily OHL + Intraday Killzones
For markets that open the daily candle at 12AM UTC

Daily-Weekly Range + KZsWeekly OHL + Daily OHL + Intraday Kill zones
For markets that open daily candle at 10pm UTC