Daily Monday Weekly Monthly Quarterly Yearly High Low Mid This indicator can be useful for traders who are interested in analyzing price movements over different time periods. By displaying the daily, Monday, weekly, monthly, quarterly, and yearly high and low values along with their mid values on a chart, traders can get a better understanding of how prices have behaved over longer periods of time.
For example, a trader might use this information to identify trends or patterns in the market. They might look for occasions when the daily high and low values move outside of an established range or when the weekly or monthly mid values cross certain key levels. This could signal a potential change in the market trend that the trader could act upon.
Additionally, the code can help traders identify key support and resistance levels based on the high and low values of the candles. By plotting these values on a chart, traders can see where prices tend to find support or resistance over different time periods. This information can be used to place stop loss orders or take profit orders at important levels.
Overall, the benefit of using the code you provided is that it offers traders a comprehensive view of price movements over different time periods, which can aid in making more informed trading decisions.
Each level described above has its own unique label, which is abbreviated for convenience. These abbreviations are listed below for quick reference:
For daily levels: DH (Daily High), DM (Daily Mid), and DL (Daily Low)
For Monday levels: MonH (Monday High), MonM (Monday Mid), and MonL (Monday Low)
For monthly levels: MH (Monthly High), MU50 (Monthly 50 percent of Mid and High), MM (Monthly Mid), MD50 (Monthly 50 percent of Mid and Low), and ML (Monthly Low)
For quarterly levels: 3MH (Quarterly High), 3MU50 (Quarterly 50 percent of Mid and High), 3MM (Quarterly Mid), 3MD50 (Quarterly 50 percent of Mid and Low), and 3ML (Quarterly Low)
For yearly levels: YH (Yearly High), YU50 (Yearly 50 percent of Mid and High), YM (Yearly Mid), YD50 (Yearly 50 percent of Mid and Low), and YL (Yearly Low)
These labels can help you quickly identify the different levels and keep track of important price points.
If the chosen timeframe does not fall under the category of intraday, daily and Monday level will not be displayed.
Please feel free to send your suggestions to @z_mehran.
Gráficos Diários

Market Profile @joshuuuTime is fractal. Every candle has an open, low, high and closing price.
Depending on what timeframe you are on, some opening prices could be more interesting than others.
This indicator tracks, which timeframe you are currently on and displays different things accordingly, so that the chart is never messy.
Below the hourly timeframe, the indicator highlights ICT Killzones, times of the day where most volume occurs and price moves the "cleanest". There are different versions to display those sessions in the settings.
From the hourly timeframe up to the daily timeframe, the indicator shows the "Weekly Profile". It plots the weekly opening line, can highlight daily highs and lows and daily opens and shows the name of the days on the chart.
On the daily timeframe, the indicator switches to a monthly profile. It shows the monthly open, weekly highs/lows AND it shows another concept taught by ICT, the IPDA Lookback.
ICT teaches that especially the last 20, 40 and 60 days PD Arrays and Highs/Lows are important and this indicator highlights those lookback windows accordingly.
The indicator has a lot of settings to make it allow maximum individuality.

Artharjan Daily Weekly Price Trend IndicatorHi,
Artharjan Daily Weekly Price Trend Indicator is created to identify whether the current market price is with respect to previous Daily High and Low as well as Previous Weekly High and Low
If the price is above previous Day High a Green Square is plotted above the Candle, if the Price is inside the Previous Day Range then a Gray Square is Plotted above the Candle, and if the Price is below the previous day low then a Red Square is plotted above the candle.
Similarly If the price is above previous Week's High a Green Circle is plotted below the Candle, if the Price is inside the Previous Week's Range then a Gray Circle is Plotted below the Candle, and if the Price is below the previous Week's low then a Red Circle is plotted below the candle.
The idea here is to identify the trend, trend changes (Reversals) and initiate either a long or short positing purely based on price action.
For illustration purpose, If suppose you have entered the trade when you see a Green Square above and a Green Circle Below, hold on to the trade as long as the Green circle below does not turn into a Red Circle. It means the Weekly trend is Bullish and Daily trend may change more frequently, but you may hold on to your position unless and until the weekly Trend changes.
Also if may help to Book your profits in a timely manner, lets say you are in a long trade and you keep seeing Green Square at the top of the candle, the moment you see a Gray or a red Square at the top you may exit your long position. Obviously trader needs to use his brains to enter a position at right location on the chart and ride that position using this indicator.
I hope everyone would find this simple indicator very useful.
Regards
Rahul Desai
@Artharjan

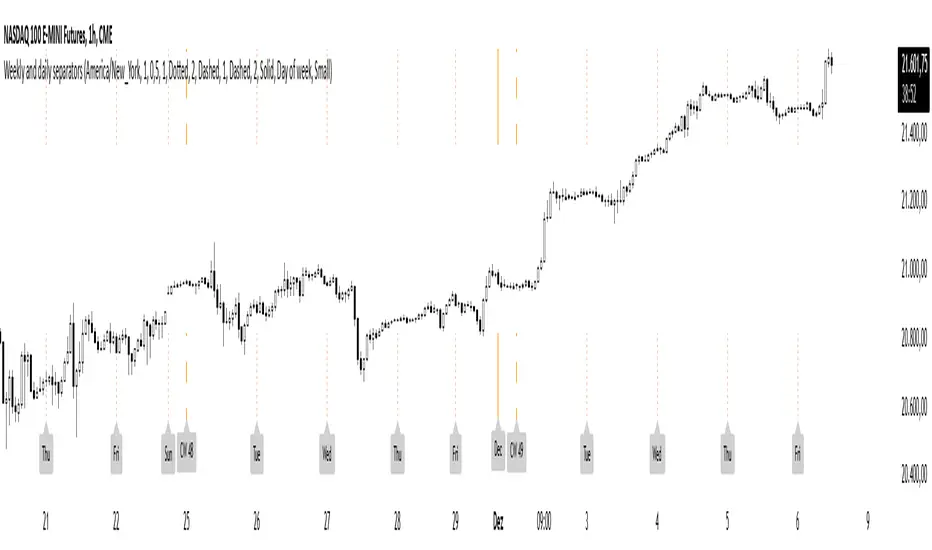
Weekly and daily separatorsThis script plots vertical line between each trading week (thick, solid) and smaller lines (dotted) between each trading day. This helps kepping a better overview on the aspect of time on the higher timeframes below 1D. The distance of the lines to the top and bottom of the chart is controlled by your chart settings menu under Appearance -> Margins.
ADR/AWR/AMR Average Daily+Weekly+Monthly Range[Traders Reality]Advanced ADR/AWR/AMR indicator created for Traders Reality community, as well as the greater trading community.
Thanks to the TR community discord guys: infernix, peshocore and xtech5192
Everything is modular and can be turned on/off, including a customisable table showing daily/weekly/monthly average pips/dollars.
If you just want the average daily range lines for example, you can just disable everything else. You can choose how many days to look back; as well as for weeks or months.
Check out Traders Reality on YouTube if you want to see this implemented as part of Tino's strategy that utilizes market manipulation, imbalances, times of day etc.
Price regularly reverses from ADR, making it one of the few highly valuable indicators in price action/smart money trading.

RD Key Levels (Weekly, Daily, Previous vWAP)The RexDog Key Levels indicator plots the weekly open, daily open, and the previous day vWAP close.
These are all critical price levels (zones) to know when trading any market or instrument. These areas are also high probability reaction areas that you can trade using simple confirmation trading patterns.
First, I'll cover an overview of the indicator then I'll share general usage tips.
Weekly Open - default is white/orange. White is when price is above the weekly open. Orange is when price is below the weekly open.
Weekly High/Low - there are options to turn on the weekly high and lows. Default plot is circles. Green is the high. Red is the low.
Daily Open - default is green/red. Green is when price is above the daily open. Red is when price is below the daily open.
Previous vWAPs - aqua single lines. These are the closing price of the daily vWAPs.
Top Indicators - The triangles at the top of the chart signify is price is currently above or below the weekly open. This is helpful on lower timeframe charts (5m, 15m) to get a quick indication when price is far extended beyond the weekly open. Green triangle = above weekly open. Red triangle = below weekly open.
General Usage
Each one of these levels are important levels markets look use for continuation or failure of momentum and bias. I also find it extremely helpful to think of these levels as magnets, dual magnets. They both attract and repel price at the same time. Now you might say, how is that helpful to have opposing views at the same time? Be indifferent to direction, create your own rules on when these price zones repel or attract price, I have my own.
Here's the easiest way to use these price levels.
As price approaches one of these levels to expect a reaction. A reaction is price is going in one direction and price hits a price level zone and reacts in the opposite direction.
These are price zones, sometimes you will see a reaction right at the price but visualize these areas as zones of reaction.
A high percentage of the time when price approaches these level zones there will be a reaction. So trade the reaction .
How do you do that?
Simple. Trade patterns that repeat. I have 3 solid patterns I trade around these key levels:
The first pattern is early entry with precise scale in rules and a very effective protective stop loss placement.
The second pattern is wait for confirmation that the level holds. This requires more patience and for you to fully trust the chart. The benefit of this pattern is with confirmation you have even more precise stop placement.
There is a bonus third pattern I trade around these levels. I call this the confirmation and bluff entry. It's a combination of both of the patterns above. You wait for confirmation but on any pull back you call the bluff on the market and enter on key test. Trade management here is critical. In addition to the pattern you trade you should have a series of failure patterns that tell you to get out of the trade, I use 2 primary failure patterns.
I trade all markets, same system, same rules, so I'll show a few examples.
Usually I start with Bitcoin but let's start with equities:
BA - Boeing - 8 Trades
Here we see weekly low patterns, previous week low test, vwAP hold patterns, day magnets and day holding. Then 2 week failures and a double hold pattern.
These are all straightforward trades to execute following really simple patterns.
BTCUSD Previous vWAP and Day Open Trades
We see here on the circle areas both daily open and previous day vWAP zone tests. Within this chart are all 3 highly effective patterns I trade.
SPY - 7 High Probability Trades
Here we see a pDay vWAP mixed with a daily failure. Next a daily retest, then a pDay vWAP failure, then a vWAP capture and test. Then a double weekly failure test (great trade there) and finally a daily test.
I could provide more examples but most are just derivatives of the above examples.

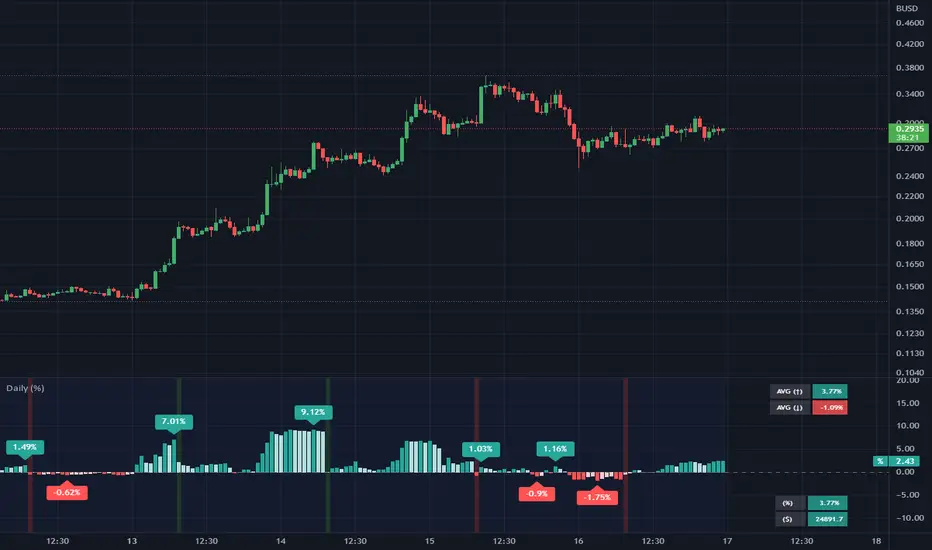
Daily (%) - Percentage Above / Below Daily [HODLER]It is a common observation in the world of cryptocurrency that the prices of most digital currencies tend to follow the price movements of Bitcoin. This means that when the price of Bitcoin increases, the prices of other cryptocurrencies usually increase as well, and when the price of Bitcoin decreases, the prices of other cryptocurrencies also tend to decrease, particularly when Bitcoin is near its daily level.
Of course, this is not unique to Bitcoin but also occurs with stocks. You can use this indicator on any asset you choose. Simply select the asset you want to track in the indicator's settings.
In the example chart, you can see CFXBUSD on a 45-minute timeframe chart with the indicator displayed below that tracks Bitcoin on a daily timeframe, as bitcoin was set as the asset in the settings of the indicator. In the lower right corner of the indicator, it will display the price of the asset "Bitcoin" and the percentage by which it is either above or below the daily price (which is calculated in the same way as on the TradingView watchlist).
This indicator can be very useful when trading other assets to closely monitor Bitcoin's (or any other chosen) activity. You can use it to check if the price is above the daily close and if it closed higher or lower than the last bar. Additionally, you can check if it closed above certain moving averages.
A useful feature of this indicator is that you can set an offset percentage for your visuals to adjust for whether the asset is up or down.
However, it is important to note that not all cryptocurrencies are directly correlated with Bitcoin's price movements, and some may even have unique factors that can cause them to behave differently in the market.
If you have any questions or suggestions regarding this indicator, I would greatly appreciate it if you could let me know in the comments.
Stock Data Table█ OVERVIEW
This is a table that shows some information about stocks. It is divided into four sections:
1) Correlation
2) Shares
3) Daily Data
4) Extended Session Data
The table is completely modular, which means you can add or remove each element from the settings menu, and it will automatically rearrange its spaces.
It is also highly customizable, to the extent that you can change almost any color, remove or change titles, invert section rows, and much more.
1) Correlation
The script checks if the stock is listed on NASDAQ, and if so, uses the QQQ (Nasdaq-100 ETF) as the reference index in the first cell; otherwise, it uses the SPY (S&P 500 ETF). The length of the correlation is shown in the second cell. The table then displays the correlation between the reference index and the other index, and the correlation between the reference index and the stock.
To make it easier to interpret the correlation values, each row's last cell is color-coded with a gradient to highlight the type of correlation, and the direction of the gradient can be customized.
The correlation coefficient is a statistical measure that quantifies the strength and direction of the relationship between two variables, indicating how changes in one variable are associated with changes in the other variable, so it can be used to identify patterns and trends.
If you are interested in correlation, I suggest taking a look at my dedicated indicator:
2) Shares
This feature provides you with quick access to key information about shares and market capitalization.
On one row, you can view the total shares outstanding and the market capitalization for the fiscal year or the quarterly year. The total shares outstanding represents the total number of shares of the stock that have been issued and are currently outstanding, regardless of whether they are held by insiders or public investors. The market capitalization is a widely used measure of the company's value as determined by the stock market, calculated by multiplying its current stock price with the total number of outstanding shares.
The other row shows the float, which is the number of shares of a company that are available for public trading, and the corresponding free-float market cap, calculated by multiplying the company's current stock price with the float. Because Pine Script does not allow retrieving information about quarterly year float, you can view the float and the free-float market cap of the fiscal year only. The data can be displayed at all times or only when the difference between the total shares outstanding and the float is significant enough to result in a difference between the market cap and free-float market cap.
The classification for market cap and free-float market cap is set in this way:
Mega Cap: $200 billion or more
Large Cap: between $10 billion and $200 billion
Mid Cap: between $2 billion and $10 billion
Small Cap: between $300 million and $2 billion
Micro Cap: less than $300 million
Penny Stocks: less than $5 (customizable)
Comparing the free-float market cap to the market cap can provide insights into the liquidity of a stock. In fact, if the float is relatively small compared to the total shares outstanding, it may be more difficult to find buyers or sellers, which could lead to increased volatility. On the other hand, a larger float indicates that the stock is more liquid and may be easier to trade, potentially resulting in lower volatility. However, market conditions can change quickly and significantly, especially for intraday traders, and the free-float can also change as insiders or other large shareholders buy or sell shares. Therefore, comparing the data of the fiscal year with that of the quarterly year may not provide the most up-to-date and accurate information for making trading decisions. This limitation can be mitigated by combining those data with other indicators and tools, such as technical analysis or news events, to gain a better understand of the stock's performance and potential trading opportunities.
3) Daily Data
This section is available on daily charts only due to the lack of accuracy of real-time daily data on other time frames. Here, you can view the Average Daily Volume (ADV) over a preferred time range (20 days by default), and the Daily Change, which represents the percentage difference between the closing price on two consecutive trading days.
ADV is useful in measuring the stock's volatility, as it provides an indication of how much trading activity there is in it. Generally speaking, stocks with higher trading volume tend to be less volatile than stocks with lower trading volume. High trading volume means there are more buyers and sellers actively trading the stock, which makes it easier for investors to buy and sell shares at fair prices. This increased liquidity can help to stabilize the stock price, reducing the potential for large swings in either direction. On the other hand, stocks with lower trading volume may experience greater volatility, as there are fewer buyers and sellers actively trading the stock. This can result in larger price swings, as it may be more difficult for investors to buy or sell shares at fair prices.
The daily percentage change can provide an indication of the stock's volatility, with larger values indicating greater volatility and risk. It can also be compared to that of a benchmark such an index or other stocks in the same sector, helping to determine whether the stock is outperforming or underperforming relative to them.
4) Extended Session Data
The fourth section is available on intraday charts only. This section provides two pieces of information: the Extended Session Change and the Pre-Market Volume.
The Extended Session Change indicates the percentage difference between the previous day's closing price and the latest price in the extended session. This gives you the extent and the direction of the price gap that occurred during extended trading hours.
The Pre-Market Volume shows the sum of all shares traded during the pre-market session. This can be helpful in understanding how much interest the stock gained before the market opened.
By default, the two rows will be visible at all times. They will stop updating after the end of their respective time range, and resume updating when it starts again. However, you can choose to automatically hide them outside of their time ranges.
Both the extended session and pre-market time ranges can be customized. Please note that if you select time ranges outside of the regular market session (as set by default), you must enable the extended session to view the corresponding rows.
█ GENERAL NOTES
• Total Shares Outstanding, Float, Average Daily Volume and Pre-Market Volume cells use a customizable color system based on two thresholds, to help you quickly identify whether the value is "too low/acceptable/too high" or "too low/not enough high/acceptable".
• If you cannot see certain data, that simply means it is not available.

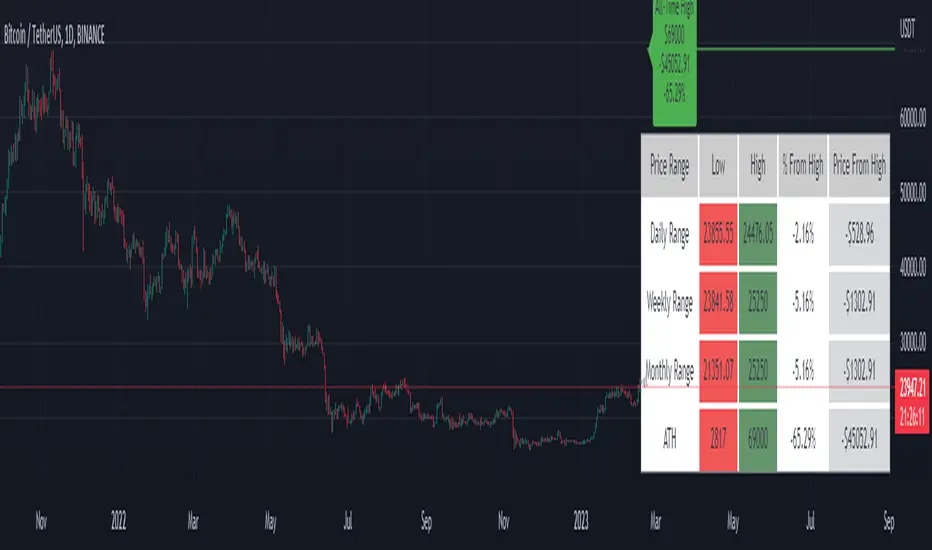
Price Range Tracker D/W/M + ATHIntroducing the Price Range Tracker - it's a tool for monitoring the price of any coin or stock. This indicator provides up-to-date information on the daily, weekly, monthly, and all-time high (ATH) prices of your selected asset.
With the Price Range Tracker, you can easily gauge how far your asset's current price is from its highest point in the daily, weekly, or monthly range. Additionally, it keeps track of the ATH of any coin, providing you with a clear understanding of your asset's historical performance.
This tracker also plots the ATH on the main chart as a label, ensuring that you are always aware of the highest point your asset has reached.
While this tool is a valuable asset for analyzing price trends, it is important to note that past performance may not always indicate future results. Market conditions can change rapidly, and strategies that have been successful in the past may not perform as well in the future. As such, it is essential to use the Price Range Tracker in conjunction with your own research and knowledge.
Please let me know if you find any bugs or would like things adding to the tracker
Finally, please note that this post and the accompanying script do not provide any financial advice. The information provided is for educational purposes only, and you should always consult a financial advisor before making any investment decisions.
Buy Sell Calendar [LuxAlgo]The Buy Sell Calendar indicator displays a calendar showing the sentiment for the current day/month. Three different methods can be used to determine this sentiment.
The calendar can also highlight the percentage of bullish days/months for a month/year.
🔶 SETTINGS
Frequency: Calendar frequency, options include "Daily" and "Monthly"
Sentiment Method: Method used to determine the sentiment for the day/month, options include: "Linreg", "Accumulated Deltas", and "Max/Min"
Timezone Offset: UTC time zone offset.
Limit Date: Limit date used by the calendar, the sentiment of days/months outside this limit will not be returned.
🔹 Calendar
Show Calendar: Determines whether to display or hide the calendar.
Location: Location of the calendar on the chart.
Size: Calendar size.
🔶 USAGE
The proposed script can allow users to quickly determine if a specific day/month is considered bullish or bearish. A green cell is used for bullish days/months, while a red one is used for bearish days/months.
Additionally vertical lines are displayed on new days/months with a color highlighting the current sentiment for this specific day/month. Note that this is done retrospectively, the color of a line set at time t might differ at time t+n .
🔶 SENTIMENT METHODS
Determining whether a day/month is bullish or bearish can be done using three different methods. Note that each method makes use of the closing price as the input, and as such can eventually return different results depending on the selected timeframe. Each method is described below:
🔹 Linreg
The Linreg method fit lines between each day/month using the method of least squares and determines if that particular day is bullish or bearish based on the line slope sign. For example, a rising line would indicate a bullish day/month.
🔹 Accumulated Deltas
The method of accumulated deltas simply accumulates bullish and bearish price changes for the current day/month, the result with the highest magnitude determines the sentiment for that day/month.
🔹 Max/Min
The max/min method computes a trailing maximum and a trailing minimum for the current day/month. The sentiment is determined by the price position relative to the average between the obtained maximum/minimum, with a bullish sentiment being determined if price is above the average.

Nick_OS RangesUNDERSTANDING THE SCRIPT:
TIMEFRAME RESOLUTION:
* You have the option to choose Daily , Weekly , or Monthly
LOOKBACK WINDOW:
* This number represents how far back you want the data to pull from
- Example: "250" would represent the past 250 Days, Weeks, or Months depending on what is selected in the Timeframe Resolution
RANGE 1 nth (Gray lines):
* This number represents the range of the nth biggest day, week, or month in the Lookback Window
- Example: "30" would represent the range of the 30th biggest day in the past 250 days. (If the Lookback Window is "250")
RANGE 2 nth (Blue lines):
* This number represents the range of the nth biggest day, week, or month in the Lookback Window
- Example: "10" would represent the range of the 10th biggest day in the past 250 days. (If the Lookback Window is "250")
RANGE 3 nth (Pink lines):
* This number represents the range of the nth biggest day, week, or month in the Lookback Window
- Example: "3" would represent the range of the 3rd biggest day in the past 250 days. (If the Lookback Window is "250")
YELLOW LINES:
* The yellow lines are the average percentage move of the inputted number in the Lookback Window
SUGGESTED INPUTS:
FOR DAILY:
Lookback Window: 250
Range 1 nth: 30
Range 2 nth: 10
Range 3 nth: 3
FOR WEEKLY:
Lookback Window: 50
Range 1 nth: 10
Range 2 nth: 5
Range 3 nth: 2
FOR MONTHLY:
Lookback Window: 12
Range 1 nth: 3
Range 2 nth: 2
Range 3 nth: 1
TIMEFRAMES TO USE (If You Have TradingView Premium):
Daily: 5 minute timeframe and higher (15 minute timeframe and higher for Futures)
Weekly: 15 minute timeframe and higher
Monthly: Daily timeframe and higher (Monthly still has issues)
TIMEFRAMES TO USE (If You DO NOT Have TradingView Premium):
Daily: 15 minute timeframe and higher
Weekly: 30 minute timeframe and higher
Monthly: Daily timeframe and higher (Monthly still has issues)
IMPORTANT RELATED NOTE:
If you decide to use a higher Lookback Window, the ranges might be off and the timeframes listed above might not apply
ISSUES THAT MIGHT BE RESOLVED IN THE FUTURE
1. If it is a shortened week (No Monday or Friday), then the Weekly Ranges will show the same ranges as last week
2. Monthly ranges will change based on any timeframe used

Key Levels by myooThis indicator plots key levels on the chart and can put a label on the price scale.
These levels can act as important support and resistance and cause big reactions.
• Open, High, Low, and EQ for the current day, previous day, current week, previous week, current month, previous month and current year.
•To show the levels on the price scale, you need to right click on the price scale, select "Labels" and turn on "Indicator and financial name labels" and "Indicator and financial value labels".
•In the settings under "Style", disable the "Labels" for a clean look.
In the settings window you can change the way the lines are drawn:
•Minimal: Lines are being drawn to the right for a clean chart.
•Standard: Lines are being drawn from the open bar of said period.
•Additionally, if you do not like to have the labels on the price scale, you can turn them of in the settings under the "Style Tab" by deactivating "Labels on price scale".
In this case, you can use the labels from the indicator itself, that are being drawn above the price line on the chart. Use the "Offset" setting to dial in the position to your preference.
Enjoy trading!

VWAP & Previous VWAP - MTF█ Volume Weighted Average Price & Previous Volume Weighted Average Price - Multi Timeframe
This script can display the daily, weekly, monthly, quarterly, yearly and rolling VWAP but also the previous ones.
█ Volume Weighted Average Price (VWAP)
The VWAP is a technical analysis tool used to measure the average price weighted by volume.
VWAP is typically used with intraday charts as a way to determine the general direction of intraday prices.
VWAP is similar to a moving average in that when price is above VWAP, prices are rising and when price is below VWAP, prices are falling.
VWAP is primarily used by technical analysts to identify market trends.
█ Rolling VWAP
The typical VWAP is designed to be used on intraday charts, as it resets at the beginning of the day.
Such VWAPs cannot be used on daily, weekly or monthly charts. Instead, this rolling VWAP uses a time period that automatically adjusts to the chart's timeframe.
You can thus use the rolling VWAP on any chart that includes volume information in its data feed.
Because the rolling VWAP uses a moving window, it does not exhibit the jumpiness of VWAP plots that reset.
For the version with standard deviation bands.
MTF VWAP & StDev Bands

Sw1tchFX - Average Daily RangeDESCRIPTION AND OVERVIEW
The Average Daily Range is a measure of volatility (typically across 5 days for the FX markets). I originally saw this being used in a trading system called ANTSSYS by Daryll Guppy and some other developers. I couldn't find it anywhere so I decided to build it from scratch.
What this does is allow you to measure volatility across various FX assets (I will apply other asset classes in the future that this is applicable to i.e. Crypto, Commodities, Blue Chip Stocks), and set realistic targets based off that volatility. Overall, this makes much more sense to me in the FX markets rather than support and resistance lines because it's based off the actual movement of the asset class. Market research shows that an asset class has a 80-85% chance to reach 75% of it's Average Daily Range (ADR).
Let's take a look at the daily ADR on the GBPNZD 15m chart. Notice how the values of the ADR act as real support and resistance based off the volatility of the asset. In this case, price did not quite reach the 75% ADR target.
Let's take a look at another example on EURNZD 15m chart. In this case, price hit the 75% target.
It's important to note that these levels do not bound the price. The probability that price exceeds it's 75% ADR is fairly low, but not impossible. Especially during important news events. Let's look at the recent USDCHF 15m chart for example.
Additionally, you can use these values to measure longer term movements (Weekly, and Monthly)
Here is a weekly view:
And a monthly view:
HOW I USE THIS
I use this in conjunction with some other indicators I've developed. Typically, I use range bars since I only care about price, not time. Additionally, averages are smoother when time is not taken into account and only price.
HOW THE CANDLE OPEN AND CLOSE IS CALCULATED
This is done based off of your own specific time zone and from the daily candle. So for me on PST, the daily candle will close at 1400. Once closed, a new ADR value is automatically calculated and added to the chart. There is an option to show past ADR values if you would like to see them or conduct additional research.


EVA - Daily Candle BoxThis is a very simple indicator who display few information about the LAST daily candle. ( it is possible to change the timeframe to have information about last week or last hour )
The green background zone is the channel between last daily candle close and last daily high.
The red background zone is the channel between last daily candle close and last daily low.
The middle line display the last daily candle close.
You can desactivate some display , and let just what you need.
If you have any idea to improve it , let me a message !
[TTI] IBD Market School––––History & Credit
This is a game-changer! Fully based on the Market School Home Study Program (Retail Price $1,500), the script takes the strict, rule-based market timing system developed by Investor's Business Daily and makes it into a easy to ready automated indicator. So that you take the ego and emotions out of the equation!
Over the years, many investors have been asking for a highly specific, quantitative method to assist them in navigating the market, stating that their existing system is too qualitative in character and focused too heavily on feel rather than predetermined principles.
The IBD Market School develops a common sense strategy that will help you enter every major market uptrend and prevent you from entering every major market downtrend/ You will discover the crucial market cues you need to pay attention to in order to manage your account with this indicator.
–––––What it does
The indicator uses 10 buys signals that will get you into the market rally early and 14 sell signal that reduce your market exposure before a downtrend.
👉 Buy Sell signals
Follow Through Days and Failed Rally Attempts
Rules around the 21-Day Moving Average
Rules around the 50-Day Moving Average
Strength and Weakness Rules
Downside Reversals
Distribution Rules
👉 Investment Allocation Rules
Recommended Portfolio Market Exposure at any given time
Buy Switch
Restrain Rules
Power-Trend
–––––How to use it
The combination of the Buy and Sell rules, together with the portfolio management rules, make sure that you are in line with the market trend The Market Exposure box gives information on the Recommended % of total portfolio exposure, that is recommended at any given time. The proliferation of Sell rules indicate danger and the Buy Switch, Restraint Rule and Power Trend indicate show how strong or weak are the current market rallies.
The indicator can be applied on any major market index.

[TTI] IBD Eureka / Phoenix Thrusts––––History & Credit
The indicator was taught to me by an advanced IBD Masterclass that I attended about 8 years ago. When it happens it is noteworthy.
–––––What it does
It shows when there is a positive breadth thrust. It calculates, based on IBD's backtested criteria a strong breadth thrust in either direction. Up or down. The IBD guidelines is to use the NYSE market for this but I have made it so that you can choose between NYSE, AMEX, NASDAQ. The best signals happen within 2 weeks of Follow Through Day.
The indicator prints 2 signals only in a form of an arrow.
1. Eureka Thrust - this is the positive breadth thrust, prints under the bar pointing up
2. Phoenix Thrust - this is the negative breadth, prints over the bar pointing down
–––––How to use it
The arrows show positive or negative environment for trading. The results happen close to the turn of the trend. It should be used as part of the general market assessment.
I use the indicator on the S&P500 or NASDAQ Composite Daily timeframe. I take into consideration this indicator to determine my market exposure.

Yearly Monthly Vertical Lines [MsF]This indicator that draws vertical lines for each year and month starting from the specified date and time.
For example, starting from August 26th, 2022,
The annual vertical lines are Aug 26th, 2022, Aug 26th, 2021, Aug 26th, 2020, Aug 26th, 2019, Aug 26th, 2018, Aug 26th, 2017...
It is useful to check the action of the chart at the event of each year and month.
Caution:
Since there is a limit to the Bar-Count that can be specified in the script language, depending on the chart period setting It may not be displayed.
-------------------------
指定した日時を起点として、年、月ごとに垂直線(縦線)を描画するインジケータです。
例えば、2022/9/1を起点とした場合、
年次のラインは、2021/9/1、2020/9/1、2019/9/1、2018/9/1、2017/9/1、2016/9/1...
に描画します。
年、月ごとのイベント時のチャートの動きを確認するのに便利です。
※過去イベント時の価格変動確認の際、手作業で垂直線を引くのが面倒なため、作成しました。
<注意>
スクリプト言語で指定できるBarCntに制限がある為、チャートの期間設定によっては
表示されない場合があります。※今後改善の余地あり

All-In-One Sessions, Weekly, Monday, Previous Highs/LowsWe are forever drawing key levels on our charts with saved drawing templates, but finding the levels, adding the labels, is all tedious stuff. We have indicators, but we have multiple different ones at a time.
What if you could just tick a box on/off?
Well now you can.
This all in one 'levels' indicator is designed to show all the key highs and lows from previous weeks, Monday, the current week, as well as an option to highlight the market sessions and their highs and lows.
There are lots of options available for extending lines and choosing their colors, so once you have set it up how you want, don't forget to save YOUR defaults.
Oorah.

Multiple Daily SMA EMA on Intra 1min 5min 15min ChartsThis script is helping you auto plot daily SMA EMA and extensions when you are looking at intraday charts. The script is customizable where user can select which ever levels they are interested in viewing. These daily lines act as support and resistance levels for intraday
The green line represent 20 EMA Daily
The yellow line represent 50 SMA Daily
The olive line represent 200 SMA Daily
The red line is upper Bollinger Band Daily
The black line is lower Bollinger Band Daily
To help you understand which lines are what I would recommend you add this indicator and select "D" timeframe and then see which lines you would like to view for your 1min chart or 5 min chart you can customize from the setting options which plot color you would like to view.

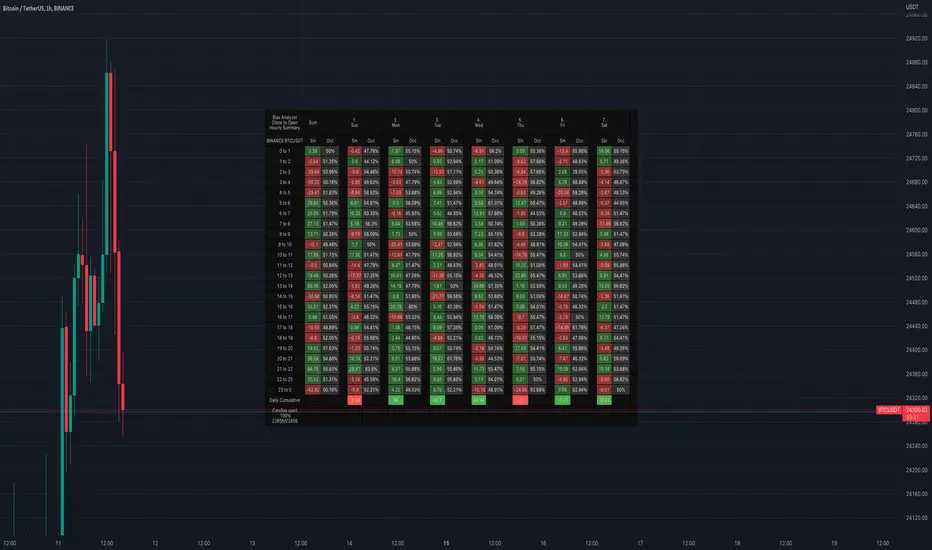
Bias AnalyzerName: Bias Analyzer
Category: Market Analyzer
Timeframe: 1H and 1D, depending on the Analysis type.
Technical Analysis: Usually when we think about a Trading System we start from an idea. This idea comes normally from observation and the study of the market.
Have we ever observed a market - for example Bitcoin - and thought that it increases at the start of a USA session? Great, this is a well-known category of Trading System and the purpose of the Bias Analyzer is to study these phenomena.
There are different types of Trading System that we can classify considering the market in-efficiency that we use to our advantage. In this case we make the Bias. Literally "inclination" or "presupposition" or precisely "tendency" of the price to go up or down in a temporal way.
The characteristics of the Bias depend on how much the Bias is persistent on the market since the analysed period. therefore we can consider:
Hourly Bias : analysing the hourly behaviours during the week. Trades normally last from a few hours to a few days.
Seasonal Bias : analysing the behaviour of the weeks in the monthly or annual context, evaluating the seasons.
Suggested usage: The possibilities of the tool are infinite, these are some scenarios of use:
Development of Intraday Trading Systems based on Hourly Bias with possible filters for specific days of the week.
Development of a Multi-day Trading System based on daily Bias with monthly analysis.
To identify the best day to execute our investment through Dollar Cost Average with a bit of healthy buy the dip
Main features:
Hourly Summary organized in Week
The cells contain the sum of the various price deltas for the single hour. The transparency indicates the frequency in which the candles close positive or negative. This information is available both in a synthetic way, as in the first column "Sum", and for each day of the week.
Hourly Details organized in different entry/exit
Shows the cumulative data of the various deltas, considering the purchase and the sale at certain times. In the rows are represented the buying hours and in the columns the selling hours.
Daily Summary organized in Months
The cells contain the summation of the various price deltas for the single day.
Hourly Details organized in different entry/exit
Allows to visualise the detailed analysis table, choosing to do it for all the months or for a specific month and shows the cumulative data of the various deltas, considering the purchase and the sale in certain days.
Configuration: You can configure the tool easily and completely.
Analysis
Calculate from Close to Open : this is the core of the whole analysis where the "Price Delta" to be calculated is defined. At this moment there is the possibility to calculate the distance between opening and closing.
Calculate in Percent or Cash : this allows to calculate the Price Delta in Percent or in Cash.
Analysis on 1H Timeframe
Show Hourly Summary on : allows to visualise the summary analysis table of the week. The cells contain the sum of the various price deltas for the single hour. The transparency indicates the frequency in which the candles close positive or negative. This information is available both in a synthetic way, as in the first column "Sum", and for each day of the week. At the bottom left there is also data which allows us to understand how many candles are being analysed. At the bottom of each day it is possible to visualise the cumulative data of the day. The position of the table is customizable.
Show Hourly Details of on : allows to visualise the detailed analysis table, choosing to do it for all days or for a specific day, and shows the cumulative data of the various deltas, considering the purchase and the sale at certain times. In the rows are represented the buying hours and in the columns the selling hours. For example, going to the table "All Days" we can see in the cell of row 13 and in column 22 the cumulative data of a possible buy on 13 and a sell at the end of 22. To facilitate the research of the values there is a configurable transparency system.
Analysis on 1D Timeframe
Show Daily Summary on : allows to visualise the summary analysis table of the month. The cells contain the summation of the various price deltas for the single day: The first row is the summation of all days of the month for all months in the analysis period, while the other rows represent the analysis for the various days of the individual months.
Show Daily Details of on : allows to visualise the detailed analysis table, choosing to do it for all the months or for a specific month and shows the cumulative data of the various deltas, considering the purchase and the sale in certain days. In the rows are represented the buying days and in the columns the selling days. For example, going to the table "All Months" we can see in the cell at row 1 and at column 3 the cumulative of a possible purchase on the 1st and the sale on the 3rd. To facilitate the research of the values, there is a configurable transparency system.
Table Layout
Size : allows to define the size of the text in the table.
Precision : it is possible to define the decimal precision of the calculations presented in the tables.
Transparency Factor : allows the application of a multiplication factor when the table calculates the transparency of detail tables.
Colours : allows to specify the colours of Profit, Loss and Neutral, besides to adapt a style coherent with the Dark Mode or Light Mode of Trading View
Volatility Filter
It is possible to directly apply a filter to the time series on which the delta is calculated. The volatility filter uses the ATR - an indicator that allows you to calculate the volatility in a given period. Briefly: the higher the ATR value, the higher the volatility. Therefore the filter works by comparing the volatility on two periods and indicates compression or expansion.
Backtest Dates
In order to facilitate the identification of in-sample and out-of-sample data, as well as the degradation of a given behaviour, it is possible to specify a period in which to do the analysis.
MTF VWAP & StDev BandsMulti Timeframe Volume Weighted Average Price with Standard Deviation Bands
I used the script "Koalafied VWAP D/W/M/Q/Y" by Koalafied_3 and made some changes, such as adding more standard deviation bands.
The script can display the daily, weekly, monthly, quarterly and yearly VWAP.
Standard deviation bands values can be changed (default values are 0.618, 1, 1.618, 2, 2.618, 3).
Also the previous standard deviation bands can be displayed.
