True Range eXpansion🕯️ TRX — True Range eXpansion
Clean Candle Bodies · Volatility Bands · Adaptive Range Envelope System
Not your grandfather’s candles. Not your brokerage’s bands.
----------------------------------------------------
TRX begins with a simple concept: visualize the true range of every candle, without the noise of flickering wicks.
From there, it grows into a fully adaptive price visualization framework.
What started as a candle-only visualizer evolved into a modular, user-controlled price engine.
From wickless candle clarity to dynamic volatility envelopes, TRX adapts to you.
There are plenty of band and channel indicators out there — Bollinger, Keltner, Donchian, Envelope, the whole crew.
But none of them are built on the true candle range, adaptive ATR shaping, and full user control like TRX.
This isn’t just another indicator — it’s a new framework.
Most bands and channels are based on close price and statistical deviation — useful, but limited.
TRX uses the full true range of each candle as its foundation, then applies customizable smoothing and directional ATR scaling to form a dynamic, volatility-reactive envelope.
The result? Bands that breathe with the market — not lag behind it.
----------------------------------------------------
🔧 Core Features:
🕯️ True Range Candles — Each candle is plotted from low to high, body-only, colored by open/close.
📈 Adjustable High/Low Moving Averages — Select your smoothing style: SMA, EMA, WMA, RMA, or HMA.
🌬️ ATR-Based Expansion — Bands dynamically breathe based on market volatility.
🔀 Per-Band Multipliers — Fine-tune expansion individually for the upper and lower bands.
⚖️ Basis Line — Optional centerline between bands for structure tracking and equilibrium zones.
🎛️ Full Visual Control — Width, transparency, color, on/off toggles for each element.
----------------------------------------------------
🧠 Default Use Case:
With the included default settings, TRX behaves like an evolved Bollinger Band system — based on True Range candle structure, not just close price and standard deviation.
----------------------------------------------------
🔄 How to Zero Out the Bands (for Minimalist Use):
Want just candles? A clean MA? Single band? You got it.
➤ Use TRX like a clean moving average:
• Set ATR Multiplier to 0
• Set both Band ATR Adjustments to 0
• Leave the Basis Line ON or OFF — your call
➤ Show only candles (no bands at all):
• Turn off "Show High/Low MAs"
• Turn off Basis Line
➤ Single-line ceiling or floor tracking:
• Set one band’s Transparency to 100
• Use the remaining band as a price envelope or support/resistance guide
----------------------------------------------------
🧬 Notes:
TRX can be made:
• Spiky or silky (via smoothing & ATR)
• Wide or tight (via multipliers)
• Subtle or aggressive (via color/transparency)
• Clean as a compass or dirty as a chaos meter
Built by accident. Tuned with intention.
Released to the world as one of the most adaptable and expressive visual overlays ever made.
Created by Sherlock_MacGyver
Customcandles

The Ultimate Buy and Sell Indicator: Unholy Grail Edition"You see, Watson, the market is not random—it simply whispers in a code too complex for the average trader. Lucky for you, I am not average."
They searched for the Holy Grail of trading for decades—promises, false prophets, and overpriced PDFs.
But they were all looking in the wrong place.
This isn’t a relic buried in the desert.
This is the Unholy Grail — a machine-forged fusion of logic, engineering, and tactical overkill .
Built by Sherlock Macgyver , this is not a mystical object. It’s a surveillance system for trend detection, signal validation, and precision entries .
⚠️ Important: This script draws its own candles.
To see it properly, disable regular candles by turning off "Body", "Wick" and "Border" colors.
🔧 What You’re Looking At
This overlay plots confirmed Buy/Sell signals , momentum-based “watch” zones , adaptive candle coloring , SuperTrend bias detection , dual Bollinger Bands , and a moving average ribbon .
It’s not “minimalist” —it’s comprehensive .
📍 Configuring the Tool: Follow the Breadcrumbs
Every setting includes a tooltip — read them . They're not filler. They explain exactly how each feature functions so you can dial this thing in like you're tuning a surveillance rig in a Cold War bunker .
If you skip them, you're walking blind in a minefield .
🕰️ Timeframes: The Signal Sweet Spot
Each asset has a tempo . You need to find the one where signals align with clarity —not chaos .
Start with 4H or 1H —work up or down from there.
Too many fakeouts? → Higher timeframe
Too slow? → Drop to 15m or 5m —but expect more noise and adjust settings accordingly.
The signals scale with time, but you must find the rhythm that best fits your asset—and your trading lifestyle .
♻️ RSI Cycle = Signal Sensitivity
This is the heart of the system . It controls how reactive the RSI engine is.
Adjust based on noise level and how often you can actually monitor your charts.
Short cycle (14–24): More signals, more speed, more noise
Longer cycle (36–64): Smoother entries, better for swing traders
Tip: If your signals feel too jittery, increase the cycle. If they lag too much, reduce it.
📉 SuperTrend: Your Trend Bias Compass
This isn’t your average SuperTrend. It adapts with RSI overlay logic and detects market “silence” via EMA compression— turning white right before the chaos . That said, you still control its aggression.
ATR Length = how many bars to average
ATR Factor = how tight or loose it hugs price
Lower = more sensitive (more trades, more noise)
Higher = confirmation only (fewer, but stronger signals)
Tweak until it feels like a sniper rifle.
No, you won’t get it perfect on the first try.
Yes, it’s worth it.
🛠️ Modular Signals: Why Things Fire (or Don’t)
Buy/Sell entries require conditions to align. The logic is modular, and that’s on purpose.
RSI signals only fire if RSI crosses its smoothed MA outside the dead zone and a “Watch” condition is active.
SuperTrend signals can be enabled to act on crossovers, optionally ignoring the Watch filter .
Watch conditions (colored squares) act as early recon and hint at possible upcoming trades.
Background color changes are “pre-signal warnings” and will repaint . Use them as leading signals, not gospel.
Want more trades? Loosen your filters .
Want sniper entries? Lock them down .
🌈 Candles and MAs: Visual Market Structure
Candles adapt in real-time to MA structure:
Green = bullish (above both fast/slow MAs)
Yellow = indecision (between)
Red = bearish (below both)
Buy/Sell signals override candles with bright orange and fuchsia —because subtlety doesn’t win wars .
You can also enable up to 8 customizable moving averages —great for confluence , trend confirmation , or just looking like a wizard .
🧠 Pro Usage Tips (TL;DR for Smart People):
Use tooltips in the settings menu —every toggle and slider is explained
Test timeframes until signal frequency and reliability match your goals
Adjust RSI cycle to reduce noise or speed up signals based on how frequently you trade
Tweak SuperTrend factor and ATR to fit volatility on your asset
Start with visual confirmation :
• Are watch signals lining up with trend zones?
• Are backgrounds firing before price moves?
• Are candle colors agreeing with signal direction?
📣 Alerts & Integration
Alerts are available for:
Buy/Sell entries (confirmed or advanced background)
Watch signals
Full band agreement (both Bollinger bands bullish or bearish)
Use these with webhook systems , bots , or your own trade journals .
Created by Sherlock Macgyver
Because sometimes the best trade…
is knowing exactly when not to take one.

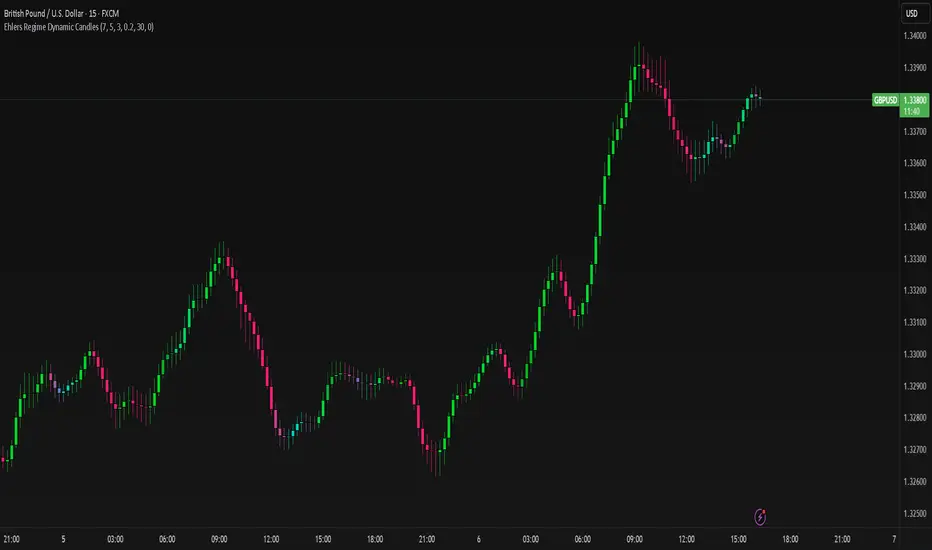
Ehlers Regime Dynamic CandlesCore Calculation Mechanism
The indicator uses advanced Ehlers signal processing techniques to identify market regimes and create dynamically colored candles that reflect market conditions.
Super Smoother Filter: Price data (open, high, low, close) is processed through an Ehlers Super Smoother Filter to reduce market noise while preserving important price movements. This creates a clearer signal for regime detection.
Autocorrelation Analysis: The core of regime detection uses autocorrelation functions at different lag periods:
Primary autocorrelation measures correlation between the current price and its previous value
Trending autocorrelation measures longer-term persistence in the data series
These values combined determine if the market is in a trending or choppy regime
(Image showing Ehlers custom candles vs default candlesticks)
Regime Strength Calculation:
-Raw signal from autocorrelation with user-defined threshold adjustment
-Adaptive scaling based on sensitivity parameter
-Optional volume validation that confirms signal strength using volume data
-Normalization to 0-1 range and smoothing for visual consistency
-Percentile ranking to provide contextually meaningful strength values
Fisher Transform: Applied to the smoothed price to identify statistical extremes, which helps adjust transparency levels during significant price movements.
Key Features & Components
Regime Detection: Identifies trending vs. choppy market conditions using Ehlers' autocorrelation techniques.
Dynamic Candle Coloring: Candles transition smoothly between three color states:
Bullish trending (typically green/teal)
Bearish trending (typically red/purple)
Choppy/neutral (typically blue/silver)
Volume Validation: Optional incorporation of volume data to confirm trend strength (stronger volume during trending periods increases confidence).
Adaptive Transparency: Candles become more opaque during statistically significant price movements based on Fisher Transform values.
Gradient Smoothing: Controls the visual transition between regime states for a more aesthetically pleasing appearance.
Customizable Colors and Style: Full control over all visual aspects including candle body/wick colors and transparency.
Configuration Options
Users can adjust the following parameters in the indicator settings:
Main Settings:
Cycle Length: Controls the lookback period for cycle detection. Lower values increase responsiveness but may introduce noise.
Gradient Smoothness: Determines how quickly colors transition when regime changes.
Trend Detection Threshold: Sets the autocorrelation strength required to classify a trend.
Trend Sensitivity: Scales regime strength calculation to produce a better distribution of values.
Use Volume: Toggles whether volume data is used to validate trend strength.
Color Settings:
Trending Regime Colors: Separate color options for bullish and bearish candle bodies and wicks.
Choppy Regime Colors: Color options for candle bodies and wicks during sideways/neutral markets.
Style Settings:
Candle Border Options: Toggle borders and adjust their color and transparency.
Adaptive Transparency: Enable/disable dynamic transparency based on statistical significance.
Base Transparency: Set the baseline transparency level for all candles.
Interpretation Notes
Color Transitions: As the market shifts between regimes, candle colors gradually transition, providing visual cues about market structure changes.
Regime Strength: The intensity of colors indicates the strength of the detected regime:
Strong trending regimes show vibrant trending colors
Weak or mixed regimes display colors closer to the choppy/neutral color
Transitions between regimes show gradient colors
Transparency Changes: More opaque candles indicate statistically significant price movements, while more transparent candles suggest routine or less significant price action.
Volume Interaction: When volume validation is enabled, trending colors become more pronounced during high volume trends and subdued during low volume periods.
Disclaimer: These are custom candles that are significantly different from normal candlesticks.
Unlike traditional candlesticks that display raw price data, these candles:
• Use Ehlers signal processing to filter and smooth price data
• Dynamically change color based on detected market regimes
• Show statistical significance through transparency
• May appear delayed compared to standard candles due to the filtering process
Traditional trading strategies dependent on candlestick patterns will not work with these.
Risk Disclaimer
Trading involves significant risk. This indicator is provided for analytical purposes only and does not constitute financial advice. Past performance is not indicative of future results. Use sound risk management practices and never trade with capital you cannot afford to lose. The Ehlers Regime Dynamic Candles indicator should be used as part of a comprehensive trading approach, not as a standalone trading system.
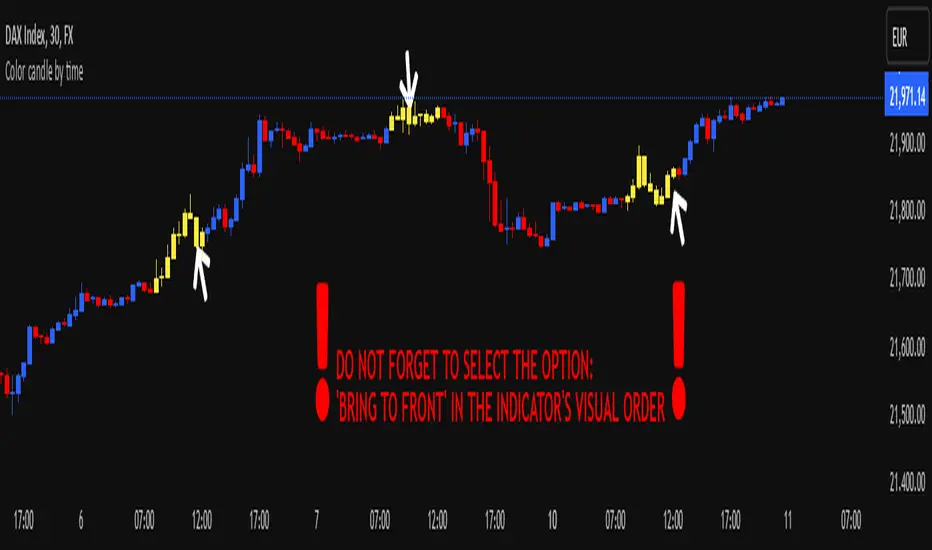
Color candle by time
This indicator, written in Pine Script v5, allows you to highlight candles (using a user-selected color) that fall within a user-defined time range. Candles outside this range maintain their original appearance.
How it Works and Key Benefits:
- Time Interval Customization: By specifying start and end hours/minutes, you can emphasize only the desired market session.
- Choice of Preferred Color: The body, wicks, and borders of the candles within the selected range are uniformly colored, based on the user’s chosen tone.
- Enhanced Focus on Price Action: By focusing on the most relevant trading hours, your analysis becomes more streamlined and intuitive, without altering the rest of the session’s candle appearance.
!! DO NOT FORGET TO SELECT THE OPTION: 'BRING TO FRONT' IN THE INDICATOR'S VISUAL ORDER !!
[FR]Custom Candles/FVG/nSideBarCustom Candles /FVG/ nSideBar
- I used this as a learning project for understanding plot()'s Better
- My goal was to see if I could use normal plots to cleanly plot FVGs on the chart using only plots with out and boxes/lines
The problem was if multiple FVGs were on back to back bars the plot fill would fill the line to the next FVG/Bar
I solved this by using 4 plots and alternating them if consecutive FVGs form
- 2 MODES
- Slim
- Normal
//////////////////////////////////////////////////////////////////////////////////////////////////////////////////////////////////////////////////////////////////////////////
-Slim
Uses 3 plotcandle() parts and divides the candle between body/wicks/open and close
by manipulating the ohlc inputs and the colors I was able to pretty make them full customizable
all components are customizable with up/down colors
-Normal
These are your normal candles but they are full customize able from components to individual up/down colors
--------------------------------------------------------------------------------------------------------------------------------------------------------------------------------------------------------------------------------------------------------
- FVGs
There are 2 FVG settings can be used with both MODES
- Big
These are the FVGs that use plots and since there isn't a 500 object limit on plots you don't need to manage them in the code and they are there how ever far you need to look back
- Slim
These use a Line and the width of the line can be adjusted for user preferences
--------------------------------------------------------------------------------------------------------------------------------------------------------------------------------------------------------------------------------------------------------
- INSIDE-BARS
These will change the color of the body of either SLIM or NORMAL Candles
--------------------------------------------------------------------------------------------------------------------------------------------------------------------------------------------------------------------------------------------------------
Drawing Snap Features Work Just Fine!
I suggest hiding your chart candles with the eye in the top left of the screen and moving the indicator to the top of your object tree
I understand that the candles in the chart pictures are impractical I was just demonstrating the functionality of the tool
Hope You Enjoy!!
FFriZz

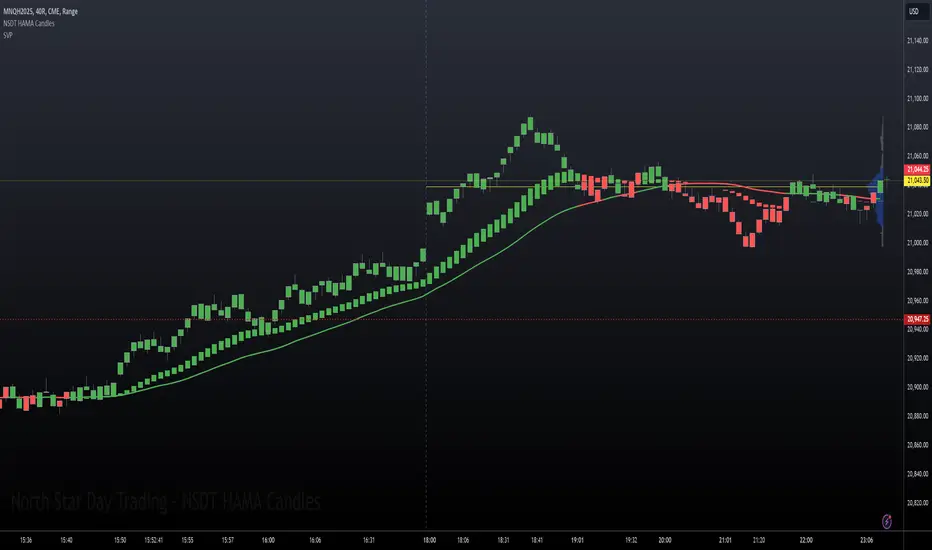
NSDT HAMA CandlesHAMA (Heiken-Ashi Moving Average) Candles are built using different moving average lengths for the open, high, low, and close. Those levels are then run through the Heiken-Ashi Candle formula to create a new hybrid candle on the chart. There is an additional Moving Average plotted as well for overall direction.
This may be used best for identifying trending markets. By referencing the HAMA Candle indicator, it may help guide you to stay in a trade a bit longer, or wait a bit longer before entering at the beginning of a potential trend.
We added a Gradient Color scheme option for a more colorful view of potential trend directional changes. The gradient code is taken from the Pinecoders Gradient Framework (Pro Advance/Decline Gradient example) at
There are three different Moving Average types to choose from. (EMA, SMA, WMA). All MA lengths can be modified. All colors can be modified. All options can be turned on or off.
This was previously an "invite-only" indicator, but we decided to publish it publicly and open source.
NSDT Bearish-Bullish CandlesThis is another interesting take on candlesticks . These Bearish-Bullish Candles do not show the wicks. Instead, the upper wick is made into a Red body and the lower wick is made into a Green body. If you match the candle body color in the chart settings (or turn off the candles completely), you get a unique way of seeing how Bearish or how Bullish a candle is because the wick will now match the body size and color.
This indicator is very similar to our NSDT Special High-Low Candles.

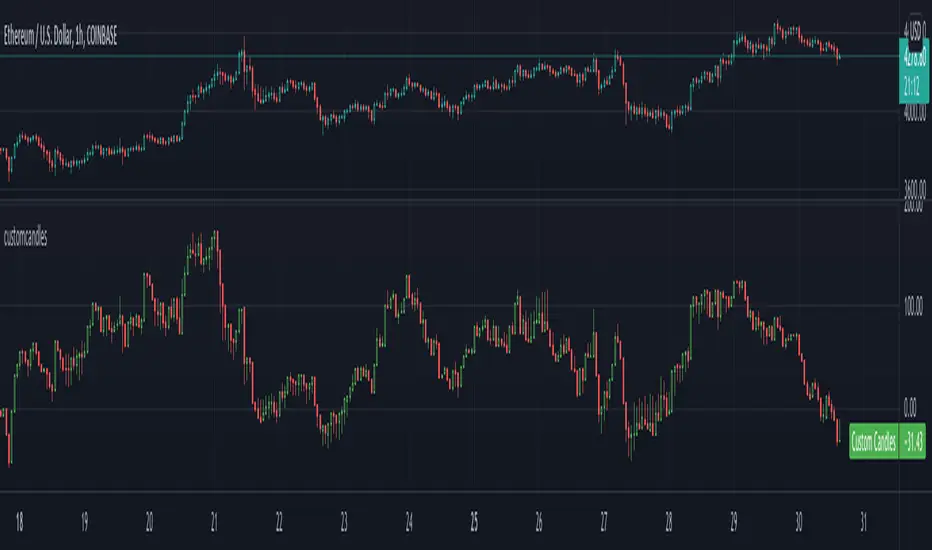
customcandlesLibrary "customcandles"
customcandles: Contains methods which can send custom candlesticks based on the input
macandles(maType, length, o, h, l, c) macandles: Provides OHLC of moving average candles
Parameters:
maType : - Moving average Type. Can be sma, ema, hma, rma, wma, vwma, swma, linreg, median
length : - Defaulted to 20. Can chose custom length
o : - Optional different open source. By default is set to open
h : - Optional different high source. By default is set to high
l : - Optional different low source. By default is set to low
c : - Optional different close source. By default is set to close
Returns: : Custom Moving Average based OHLC values
hacandles() hacandles: Provides Heikin Ashi OHLC values
Returns: : Custom Heikin Ashi OHLC values
ocandles(type, length, shortLength, longLength, method, highlowLength, sticky, percentCandles) macandles: Provides OHLC of moving average candles
Parameters:
type : - Oscillator Type. Can be cci, cmo, cog, mfi, roc, rsi, tsi, mfi
length : - Defaulted to 14. Can chose custom length
shortLength : - Used only for TSI. Default is 13
longLength : - Used only for TSI. Default is 25
method : - Valid values for method are : sma, ema, hma, rma, wma, vwma, swma, highlow, linreg, median
highlowLength : - length on which highlow of the oscillator is calculated
sticky : - overbought, oversold levels won't change unless crossed
percentCandles : - candles are generated based on percent with respect to high/low instead of actual oscillator values
Returns: : Custom Moving Average based OHLC values