Vertical Event Lines - BTC Halving & Custom DatesThis indicator plots vertical lines and labels for Bitcoin halving dates and any custom events you define directly on the price chart.
It is designed as a clean, lightweight event-timeline overlay so you can instantly see where key dates occur relative to price action.
Main features
Built-in Bitcoin halving dates (2012, 2016, 2020, 2024), plus 8 additional custom event slots with freely configurable date/time, name and color.
Vertical lines are positioned using xloc.bar_time , ensuring each event is anchored to the exact timestamp in the chart’s timeframe and timezone.
Past and current events:
A label is created once, on the first bar that crosses the event time, and placed near the bar’s high for consistent readability across symbols and timeframes.
Future events:
A separate label is shown at the bottom of the chart, making future dates clearly visible even to the right of the last bar. These labels update only on the most recent bar to keep the script efficient.
Flexible styling:
Global controls for line width, line style and label size, with per-event color selection and optional per-event overrides of global width and style.
How to use
Add the script to any chart (BTC or other symbols). It works on all timeframes.
Use the Global settings to configure default line style, line width and label appearance (size, orientation, text color).
In each Event X section, enable the event and set:
Date/time in YYYY-MM-DD HH:MM format
Event name
Color
Optional custom width/style
When scrolling through time:
Events left of the last bar show a vertical line and a one-time label at the crossing bar.
Events right of the last bar show a vertical line and a bottom label that remains visible in the future.
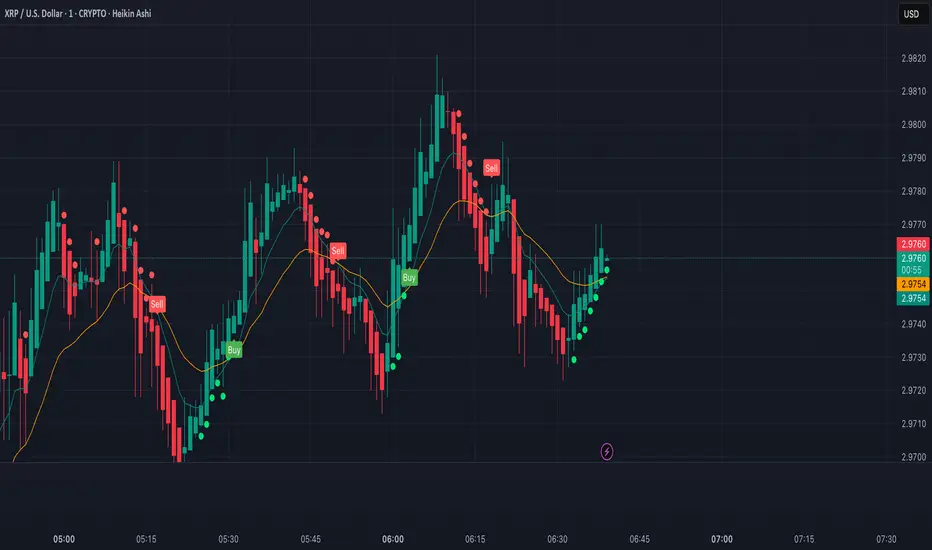
This script is intended as a visual reference tool only .
It does not generate trading signals, alerts or backtests.
Indicador Pine Script®