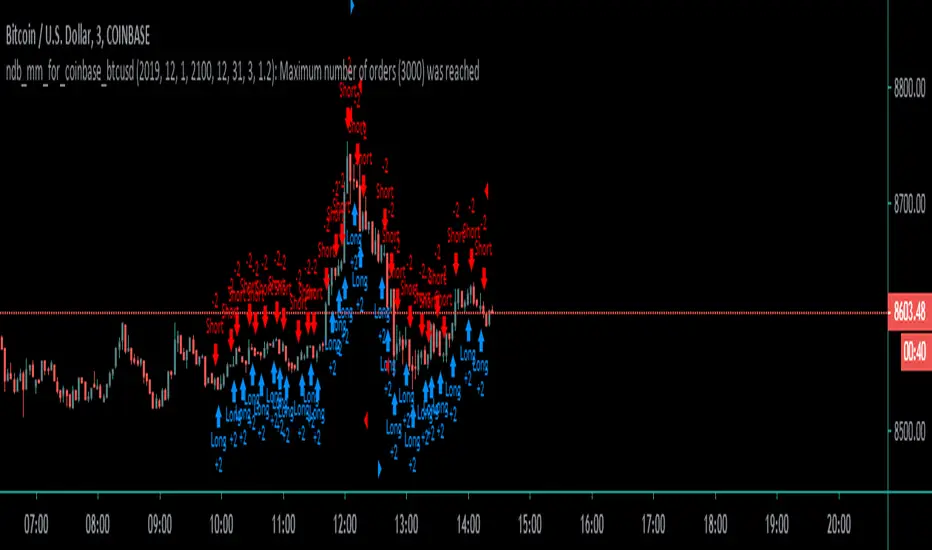
Super Guppy StrategyCM Super Guppy with Long/Short signals, backtesting, and additional options. Updated for PineScript v4.
COINBASE:BTCUSD
Features 2 primary modes, depending on your risk profile. These options are available in the settings:
"Early Signals" ON (default):
Prints a "long" on grey to green transitions AND red to gray transitions.
Prints a "short" on green to grey transitions AND gray to red transitions.
Will not print back-to-back repeated positions (i.e. green → grey → red will only print the first green → gray "short" signal and not print "short" twice).
Rotates long and short positions with no delay.
"Early Signals" OFF
Will close trades, but never open new ones, when guppy transitions to from any color to gray.
Open long: guppy transitions gray to green.
Close long: guppy transitions green to gray.
Open short: guppy transitions gray to red.
Close short: guppy transitions red to gray.
Does not rotate long and short positions back to back.
Additionally:
Can toggle on/off the 200EMA. Default is off.
Can toggle on/off short positions. Default is on.
In development: alerts
Criptomoedas

ETF / Stocks / Crypto - DCA Strategy v1Simple "benchmark" strategy for ETFs, Stocks and Crypto! Super-easy to implement for beginners, a DCA (dollar-cost-averaging) strategy means that you buy a fixed amount of an ETF / Stock / Crypto every several months. For instance, to DCA the S&P 500 (SPY), you could purchase $10,000 USD every 12 months, irrespective of the market price. Assuming the macro-economic conditions of the underlying country remain favourable, DCA strategies will result in capital gains over a period of many years, e.g. 10 years. DCA is the safest strategy that beginners can employ to make money in the markets, and all other types of strategies should be "benchmarked" against DCA; if your strategy cannot outperform DCA, then your strategy is useless.
Recommended Chart Settings:
Asset Class: ETF / Stocks / Crypto
Time Frame: H1 (Hourly) / D1 (Daily) / W1 (Weekly) / M1 (Monthly)
Necessary ETF Macro Conditions:
1. Country must have healthy demographics, good ratio of young > old
2. Country population must be increasing
3. Country must be experiencing price-inflation
Necessary Stock Conditions:
1. Growing revenue
2. Growing net income
3. Consistent net margins
4. Higher gross/net profit margin compared to its peers in the industry
5. Growing share holders equity
6. Current ratios > 1
7. Debt to equity ratio (compare to peers)
8. Debt servicing ratio < 30%
9. Wide economic moat
10. Products and services used daily, and will stay relevant for at least 1 decade
Necessary Crypto Conditions:
1. Honest founders
2. Competent technical co-founders
3. Fair or non-existent pre-mine
4. Solid marketing and PR
5. Legitimate use-cases / adoption
Default Robot Settings:
Contribution (USD): $10,000
Frequency (Months): 12
*Robot buys $10,000 worth of ETF, Stock, Crypto, regardless of the market price, every 12 months since its founding time.*
*Equity curve can be seen from the bottom panel*
Risk Warning:
This strategy is low-risk, however it assumes you have a long time horizon of at least 5 to 10 years. The longer your holding-period, the better your returns. The only thing the user has to keep-in-mind are the macro-economic conditions as stated above. If unsure, please stick to ETFs rather than buying individual stocks or cryptocurrencies.

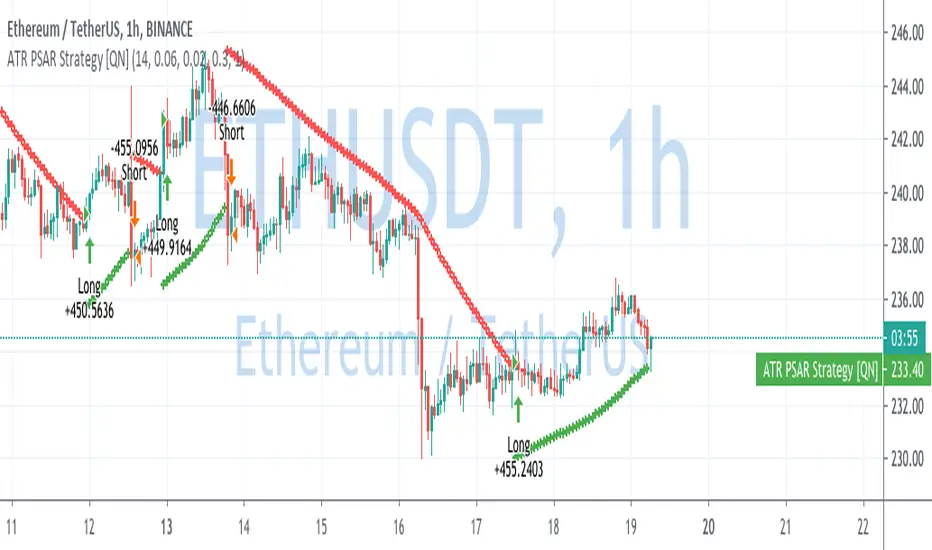
ATR Parabolic SAR Strategy [QuantNomad]I created a version of Parabolic SAR when I accelerate it not based on the difference from the extreme point but based on current ATR. So the idea is that for a more volatile market it should move faster.
Performance is calculated based on 25% equity invested and 0.1% commission.
What do you think about it? Does it make sense to do something like that?
Do you have in mind other ways I can accelerate it when the market starts to be more volatile?
Disclaimer
Please remember that past performance may not be indicative of future results.
Due to various factors, including changing market conditions, the strategy may no longer perform as good as in historical backtesting.
This post and the script don’t provide any financial advice.
EMA Slope Cross Trend Follower StrategyThis strategy uses the cross of the slopes of two EMAs having different lengths to generate trend follower signals. By default, I use 130 and 400, which behave very well.
The conditions which make the strat enter the market are:
- Fast Slope > Slow Slope and price > EMA 200 : go Long
- Fast Slope < Slow Slope and price < EMA200 : go Short
The simple slopes cross in the opposite direction, closes the position.
The strategy performs best on Bitcoin and the most liquid and capitalized Altcoins, but works greatly on volatile assets as well, in particular if they often go trending.
Works best on 4h time frame.
There's also an optional Volatility filter, which opens the position only if the difference between the two slopes is more than a specific value, which can be set in the strategy inputs. The purpose is not opening positions if price is going sideways and the noise is way > than the signal.
Enjoy it!

Coinbase_3-MIN_HFT-StrategyThis conceptual strategy trades against the short-term trend. The first position can be either long or short.
In the short-term, prices fluctuate up and down on wide spread exchanges.
And if the price moves to one side, the price tends to return to its original position momentarily.
This strategy set stop order. Stop price is calculated with upper and lower shadows.
HatiKO EnvelopesPublished source code is subject to the terms of the GNU Affero General Public License v3.0
This script describes and provides backtesting functionality to internal strategy of algorithmic crypto trading software "HatiKO bot".
Suitable for backtesting any Cryptocurrency Pair on any Exchange/Platform, any Timeframe.
Core Mechanics of this strategy are based on theory of price always returning to Moving Average + Envelopes indicator (Moving_average_envelope from Wiki)
Developement of this script and trading software is inspired by:
"Essential Technical Analysis: Tools and Techniques to Spot Market Trends" by Leigh Stevens (published on 12th of April 2002)
"Moving Average Envelopes" by ChartSchool, StockCharts platform (published on 13th of April 2015 or earlier)
"Коля Колеснік" from Crypto Times channel ("Метод сетка", published on 19th of August 2018)
"3 ways to use Moving Average Envelopes" by Rich Fitton, published on Trader's Nest (published on 28st of November 2018 or earlier)
noro's "Robot WhiteBox ShiftMA" strategy v1 script, published on TradingView platform (published on 29th of August 2018)
"Moving Average Envelopes: A Popular Trading Tool" Investopedia article (published 25th of June 2019)
and KROOL1980's blogpost on Argolabs ("Гридерство или Сетка как источник прибыли на форекс", published on 27th of February 2015)
Core Features:
1) Up to 4 Envelopes in each direction (Long/Short)
2) Use any of 6 different basis MAs, optionally use different MAs for Opening and Closure
3) Use different Timeframes for MA calculation, without any repainting and lookahead bias.
4) Fixed order size, not Martingale strategy
5) Close open position earlier by using Deviation parameter
6) PineScript v4 code
Options description:
Lot - % from your initial balance to use for order size calculation
Timeframe Short - Timeframe to use for Short Opening MA calculation, can be chosen from dropdown list, default is Current Graph Timeframe
MA Type Short - Type of MA to use for Short Opening MA calculation, can be chosen from dropdown list, default is SMA
Data Short - Source of Price for Short Opening MA calculation, can be chosen from dropdown list, default is OHLC4
MA Length Short - Period used for Short Opening MA calculation, should be >=1, default is 3
MA offset Short - Offset for MA value used for Short Envelopes calculation, should be >= 0, default is 0
Timeframe Long - Timeframe to use for Long Opening MA calculation, can be chosen from dropdown list, default is Current Graph Timeframe
MA Type Long - Type of MA to use for Long Opening MA calculation, can be chosen from dropdown list, default is SMA
Data Long - Source of Price for Long Opening MA calculation, can be chosen from dropdown list, default is OHLC4
MA Length Long - Period used for Long Opening MA calculation, should be >=1, default is 3
MA offset Long - Offset for MA value used for Long Envelopes calculation, should be >= 0, default is 0
Mode close MA Short - Enable different MA for Short position Closure, default is "false". If false, Closure MA = Opening MA
Timeframe Short Close - Timeframe to use for Short Position Closure MA calculation, can be chosen from dropdown list, default is Current Graph Timeframe
MA Type Close Short - Type of MA to use for Short Position Closure MA calculation, can be chosen from dropdown list, default is SMA
Data Short Close - Source of Price for Short Closure MA calculation, can be chosen from dropdown list, default is OHLC4
MA Length Short Close - Period used for Short Opening MA calculation, should be >=1, default is 3
Short Deviation - % to move from MA value, used to close position above or beyond MA, can be negative, default is 0
MA offset Short Close - Offset for MA value used for Short Position Closure calculation, should be >= 0, default is 0
Mode close MA Long - Enable different MA for Long position Closure, default is "false". If false, Closure MA = Opening MA
Timeframe Long Close - Timeframe to use for Long Position Closure MA calculation, can be chosen from dropdown list, default is Current Graph Timeframe
MA Type Close Long - Type of MA to use for Long Position Closure MA calculation, can be chosen from dropdown list, default is SMA
Data Long Close - Source of Price for Long Closure MA calculation, can be chosen from dropdown list, default is OHLC4
MA Length Long Close - Period used for Long Opening MA calculation, should be >=1, default is 3
Long Deviation - % to move from MA value, used to close position above or beyond MA, can be negative, default is 0
MA offset Long Close - Offset for MA value used for Long Position Closure calculation, should be >= 0, default is 0
Short Shift 1..4 - % from MA value to put Envelopes at, for Shorts numbers should be positive, the higher is number, the higher should be Shift position, example: "Shift 1 = 1, shift 2 = 2, etc."
Long Shift 1..4 - % from MA value to put Envelopes at, for Longs numbers should be negative, the lower is number, the lower should be Shift position, example: "Shift 1 = -1, shift 2 = -2, etc."
From Year 20XX - Backtesting Starting Year number, only 20xx supported as script is cryptocurrency-oriented.
To Year 20XX - Backtesting Final Year number, only 20xx supported as script is cryptocurrency-oriented.
From Month - Years starting Month, optional tweaking, changing not recommended
To Month - Years ending Month, optional tweaking, changing not recommended
From day - Months starting day, optional tweaking, changing not recommended
To day - Months ending day, optional tweaking, changing not recommended
Graph notes:
Green lines - Long Envelopes.
Red lines - Short Envelopes.
Orange line - MA for closing of Short positions.
Lime line - MA for closing of Long positions.
**************************************************************************************************************************************************************************************************************
Опубликованный исходный код регулируется Условиями Стандартной Общественной Лицензии GNU Affero v3.0
Этот скрипт описывает и предоставляет функции бектеста для внутренней стратегии алгоритмического программного обеспечения "HatiKO bot".
Подходит для тестирования любой криптовалютной пары на любой бирже/платформе, на любом таймфрейме.
Кор-механика этой стратегии основана на теории всегда возвращающейся к значению МА цены с использованием индикатора Envelopes (Moving_average_envelope from Wiki)
Разработка этого скрипта и программного обеспечения для торговли вдохновлена следующими источниками:
Книга "Essential Technical Analysis: Tools and Techniques to Spot Market Trends" Ли Стивенса (опубликовано 12 апреля 2002 года)
«Moving Average Envelopes» от ChartSchool, платформа StockCharts (опубликовано 13 апреля 2015 года или раньше)
«Коля Колеснік» с канала Crypto Times («Метод сетка», опубликовано 19 августа 2018 года)
«3 ways to use Moving Average Envelopes» Рича Фиттона, опубликованные в «Trader's Nest» (опубликовано 28 ноября 2018 года или раньше)
Скрипт стратегии noro "Robot WhiteBox ShiftMA" v1, опубликованный на платформе TradingView(опубликовано 29 августа 2018 года)
«Moving Average Envelopes: A Popular Trading Tool», статья Investopedia (опубликовано 25 июня 2019 года)
Блог KROOL1980 из Argolabs («Гридерство или Сетка как источник прибыли на форекс», опубликовано 27 февраля 2015 года)
Основные особенности:
1) До 4-х Ордеров в каждом из направлении (Лонг / Шорт)
2) Выбор из 6-ти разных базовых МА, опционально используйте разные МА для открытия и закрытия.
3) Используйте разные таймфреймы для расчета MA, без перерисовки и "эффекта стеклянного шара".
4) Фиксированный размер ордера, а не стратегия Мартингейла
5) Возможность закрытия открытой позиции заблаговременно, используя параметр Deviation
6) Код реализован на PineScript v4
Описание параметров:
Lot - % от вашего первоначального баланса, используется при расчете размера Ордера
Timeframe Short - таймфрейм, используемый для расчета МА Открытия Шорт позиций, может быть выбран из списка, по умолчанию - таймфрейм текущего графика
MA Type Short - тип MA, используемый для расчета МА Открытия Шорт позиций, может быть выбран из списка, по умолчанию SMA
Data Short - источник цены для расчета МА Открытия Шорт позиций, может быть выбран из списка, по умолчанию OHLC4
MA Length Short - период, используемый для расчета МА Открытия Шорт позиций, должен быть >= 1, по умолчанию 3
MA Offset Short - смещение значения MA, используемого для расчета Шорт Ордеров, должно быть >= 0, по умолчанию 0
Timeframe Long - таймфрейм, используемый для расчета МА Открытия Лонг позиций, может быть выбран из списка, по умолчанию - таймфрейм текущего графика
MA Type Long - тип MA, используемый для расчета МА Открытия Лонг позиций, может быть выбран из списка, по умолчанию SMA
Data Long - источник цены для расчета МА Открытия Лонг позиций, может быть выбран из списка, по умолчанию OHLC4
MA Length Long - период, используемый для расчета МА Открытия Лонг позиций, должен быть >= 1, по умолчанию 3
MA Offset Long - смещение значения MA, используемого для расчета Лонг Ордеров, должно быть >= 0, по умолчанию 0
Mode close MA Short - Включает отдельное MA для закрытия Шорт позиции, по умолчанию «false». Если false, MA Закрытия = MA Открытия
Timeframe Short Close - таймфрейм, используемый для расчета МА Закрытия Шорт позиций, может быть выбран из списка, по умолчанию - таймфрейм текущего графика
MA Type Close Short - тип MA, используемый при расчете МА Закрытия Шорт позиции. Mожно выбрать из списка, по умолчанию SMA
Data Short Close - источник цены для расчета МА Закрытия Шорт позиций, может быть выбран из списка, по умолчанию OHLC4
MA Length Short Close - период, используемый для расчета МА Закрытия Шорт позиции, должен быть >= 1, по умолчанию 3
Short Deviation - % отклонения от значения MA, используется для закрытия позиции выше или ниже рассчитанного значения MA, может быть отрицательным, по умолчанию 0
MA Offset Short Close - смещение значения MA, используемого для расчета закрытия Шорт позиции, должно быть >= 0, по умолчанию 0
Mode close MA Long - Включает разные MA для закрытия Лонг позиции, по умолчанию «false». Если false, MA Закрытия = MA Открытия
Timeframe Long Close - таймфрейм, используемый для расчета МА Закрытия Лонг позиций, может быть выбран из списка, по умолчанию - таймфрейм текущего графика
MA Type Close Long - тип MA, используемый при расчете МА Закрытия Лонг позиции. Mожно выбрать из списка, по умолчанию SMA
Data Long Close - источник цены для расчета МА Закрытия Лонг позиций, может быть выбран из списка, по умолчанию OHLC4
MA Length Long Close - период, используемый для расчета МА Закрытия Лонг позиции, должен быть >= 1, по умолчанию 3
Long Deviation -% для перехода от значения MA, используется для закрытия позиции выше или ниже рассчитанного значения MA, может быть отрицательным, по умолчанию 0
MA Offset Long Close - смещение значения MA, используемого для расчета закрытия Лонг позиции, должно быть >= 0, по умолчанию 0
Short Shift 1..4 - % от значения MA для размещения Ордеров, для Шорт Ордеров должен быть положительным, чем выше номер, тем выше должна располагаться позиция Shift, например: «Shift 1 = 1, Shift 2 = 2 и т.д. "
Long Shift 1..4 - % от значения MA для размещения Ордеров, для Лонг Ордеров должно быть отрицательным, чем ниже число, тем ниже должна располагаться позиция Shift, например: «Shift 1 = -1, Shift 2 = -2, и т.д."
From Year 20XX - Год начала тестирования, из-за ориентированности на криптовалюты поддерживаются только значения формата 20хх.
To Year 20XX - Год окончания тестирования, из-за ориентированности на криптовалюты поддерживаются только значения формата 20хх.
From Month - Начальный месяц, опционально, менять не рекомендуется
To Month - Конечный месяц, опционально, менять не рекомендуется
From day - Начальный день месяца, опционально, менять не рекомендуется
To day - Конечный день месяца, опционально, менять не рекомендуется
Пояснения к графику:
Зеленые линии - Лонг Ордера.
Красные линии - Шорт Ордера.
Оранжевая линия - MA Закрытия Шорт позиций.
Лаймовая линия - MA Закрытия Лонг позиций.

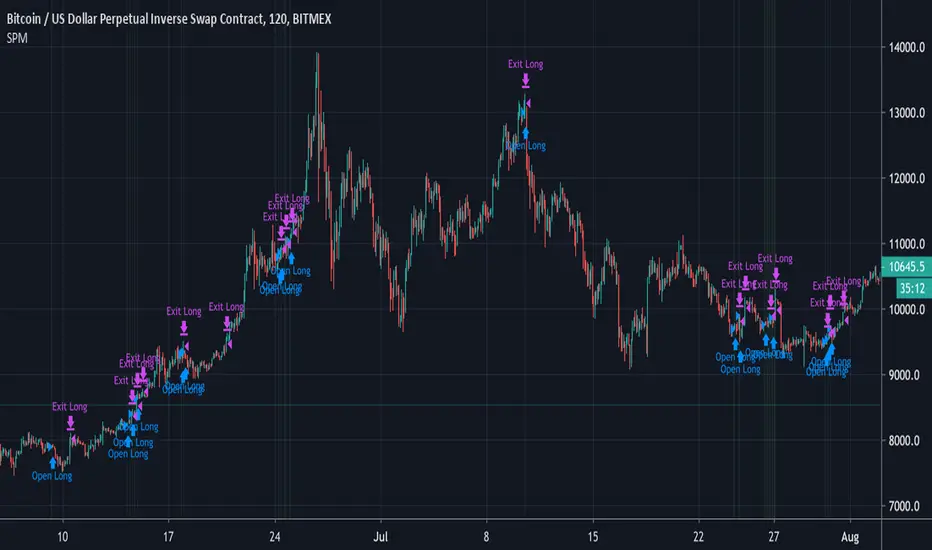
Leverage Strategy and a few words on risk/opportunityHello traders,
I started this script as a joke for someone... finally appears it could be used for educational content
Let's talk about leverage and margin call
Margin Call
A margin call is the broker's demand that an investor deposit additional money or securities so that the account is brought up to the minimum value, known as the maintenance margin.
A margin call usually means that one or more of the securities held in the margin account has decreased in value below a certain point.
Leverage
A leverage is a system which allows the trader to open positions much larger than his own capital. ... “Leverage” usually refers to the ratio between the position value and the investment needed,
Strat
The strategy simulates long/short positions on a 4h high/low breakout based on the chart candle close.
The panel below shows the strategy equity curve. Activating the margin call option will show when the account would be margin called giving the settings
Casino
I'm not doing any financial recommendation here.
I made this strategy so that people include more risk management metrics into their strategy.
From the code, we see it's fairly easy to calculate a leveraged position size and a margin call flag - when that flag is hit, the system stops trading.
I simplified things to the extreme here but my point is that the leverage is a double-edge sword gift.
Assuming we always take the same position sizing, increasing the leverage speed up how fast a margin could be ..... called. (bad joke? feel free to tell me). Not saying it will, saying it introduces more risk by design.
Then one could say "I'll just turn off that stupid margin call option". And that's when someone starts backtesting with unrealistic market conditions.
Finally...
When I backtest I always assume the worst in every scenario possible (because I'm French), I always try to minimize the risk first (also because I'm French), keeping as close from 0 as possible (French again)
Then I add the "opportunity" component, looking to catch the maximum of opportunity while keeping the risk low.
It's like a Rubix cube puzzle - decreasing the risk is one side of the equation but whenever I try to catch more opportunity... my risks increases.
Then I update my risk... and now the opportunity decreases... (#wut #wen #simple)
Completely removing the risk from a trading strategy isn't something I wouldn't dare doing.
Trading involves risk. Being obsessed by decreasing the risk is what I do BEST :)
Dave

Simple Price Momentum - How To Create A Simple Trading StrategyThis script was built using a logical approach to trading systems. All the details can be found in a step by step guide below. I hope you enjoy it. I am really glad to be part of this community. Thank you all. I hope you not only succeed on your trading career but also enjoy it.
docs.google.com
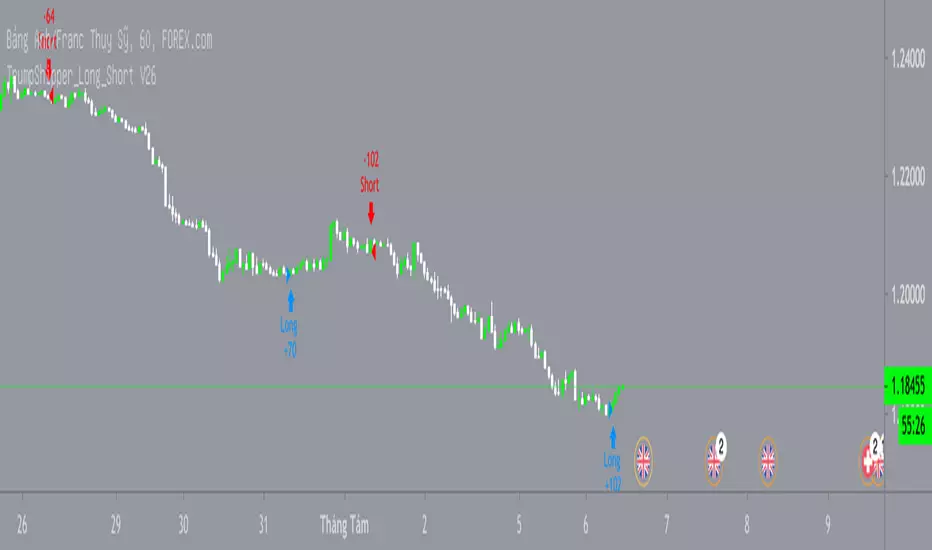
Extreme ScalpingThis is a test of an easy scalping method: buy if actual close is below forecast close and sell if actual close is above forecast close. Take profit and stop loss shall be very small (few pips) as in most of scalping strategies.
No filter is used for only long or only short positions, but you can select buy only or sell only based on other indicators or whatever you feel is the direction of trading.
NOTE: you can add this strategy to your chart but you should modify the backtest day otherwise you will get an error due to calculation limits of pine script. For example, on one minute chart, you should set the backtest day from today only. For past days, set both start day and and day.
I have also a study with alarms.
Please use comment section for any feedback.

REAL STRATEGY : Dow_Factor_MFI/RSI_DVOG_StrategyI'm actually one of those who think it's more important to extract clues from indicators than strategy, but I wanted to test the data about the probability and dow factor I've shared for a long time.
Usually, Bitcoin is used as an eye stain for strategy success, since the graph has increased significantly from the beginning.
To prevent this, I used a commission and in the last lines of document I shared Bitmex's Bitcoin and Ethereum 1W test results.
I don't think there's a factor to repaint. ( Warn me if u see or observe )
I considered Bitcoin because I found working with liquid parities much more realistic.
Ethereum and Bitmex have been featured as a spot and may soon find a place at the CME , so I've evaluated the Ethereum .
But since the Ethereum Bitmex was also spot new, I deleted results that were less than 10 closed trades.
Since the Dow Theory also looks at the harmony in the indices, just try it in the Cryptocurrency market.
Use as indicator in other markets. Support with channels, trend lines with big periods and other supportive indicators.
And my personal suggestion : Use this script and indicator TF : 4H and above.
Specifications :
Commission. ( % 0.125 )
Switchable Methods ( Relative Strength Index / Money Flow Index )
Alarms. (Buy / Sell )
Position closure when horizontal market rates weighs.
Progressive gradual buy/sell alarms.
Clean code layout that will not cause repaint. (Caution : source = close )
Switchable barcolor option (I / 0 )
*****Test results :*****
drive.google.com
Summary:
It was a realistic test.
It has achieved great success in some markets, but as I mentioned earlier, use it only to gain insight into the price movements of cryptos.
Use as indicator in other markets.
This code is open source under the MIT license. If you have any improvements or corrections to suggest, please send me a pull request via the github repository : github.com
Stay tuned ! Noldo.

Lancelot vstop intraday trending strategyDear all,
Free strategy again.
I found using 3 volatility stop with different settings could be very helpful when trading an intraday trending market.
With the ATR setting or 5, 10, 15, we can weed out many false break.
Vstop setting is OHLC4.
On the other hand, this strategy also utilize Renko as part of the strategy, so you could say this strategy is mainly an intraday break out trend following strategy.
Works well on BTCUSD XBTUSD, as well as other major liquid alt Pairs.
And lastly,
Save Hong Kong, the revolution of our times.

QuarryLake v4As some of you requested, I will make the code for QuarryLake Open for you all.
I have also updated the script in version 4.
This strategy consists of 3 indicators that I found works quite well together.
Keltner Channel, Waddah Attah Explosion, and Volatility Stop .
KC Period = 200
KCATR = 5
Vstop Period = 3
Vstop Mult = 1.5
Long when close > KC, close > Vstop, WAE trendUp
Short when close < KC, close < Vstop, WAE trendDown
Works well on BTCUSD XBTUSD , as well as other major liquid Pair.
This strategy utilized a modified Kelly position sizing for BTCUSD Bitstamp , feel free to modify it to your needs.
And lastly,
Save Hong Kong, the revolution of our times.

Lancelot RR StrategyDear all,
Free strategy again.
This strategy consists of 2 indicators I think works well with each other as a trend following strategy.
The 2 indicators are Renko chart and Relative Vigor Index.
This is a long-only breakout strategy that aims to capture the majority of the trend.
Works well on BTCUSD XBTUSD, as well as other major liquid Pair.
Please acknowledge my effort by like and follow.
And lastly,
Save Hong Kong, the revolution of our times.

QuantCat Mom Finder Strategy (1H)QuantCat Momentum Finder Strategy
This strategy is designed to be used on the 1 hour time frame, on all x/btc pairs.
The beautiful thing is it plots the take profit, and stoploss for you for each entry- where I would say use the stoploss for sure and feel with water with how the price action is looking when in profit.
In this strategy, I actually implemented my own trading style into building the strategy. Having to replicate my own trading strategy into an algorithm, I can't make it exactly perfect to how I would trade, but what I can do is try and program the parameters that give it the absolute best chance of making a big move with a small drawdown- which replicates part of my momentum trading style. Here I am using RSI, MACD, EMA and trend filtering values to find moments where there has been a momentum change to play the rest of the move. It only picks the best entries.
There is always a 3-4 R/R move on average with with these trades, meaning 1 in 4 only need to hit to be a break even trader- where most of these strategies have about 35% hit rate.
The stoploss is so crucial to minimise any damage from huge unexpected candles, the strategies can just be used for entries as well, you don't have to stick to the exact formula- of the long and short system, but this by itself is profitable.
The system nets positive results on
-ETH/BTC
-LTC/BTC
-XRP/BTC
-ADA/BTC
-NEO/BTC etc.
We also have a free 15M strategy available too.
You can join our discord server to get live alerts for the strategy as well as speak to our devs! Link in signature below!!!

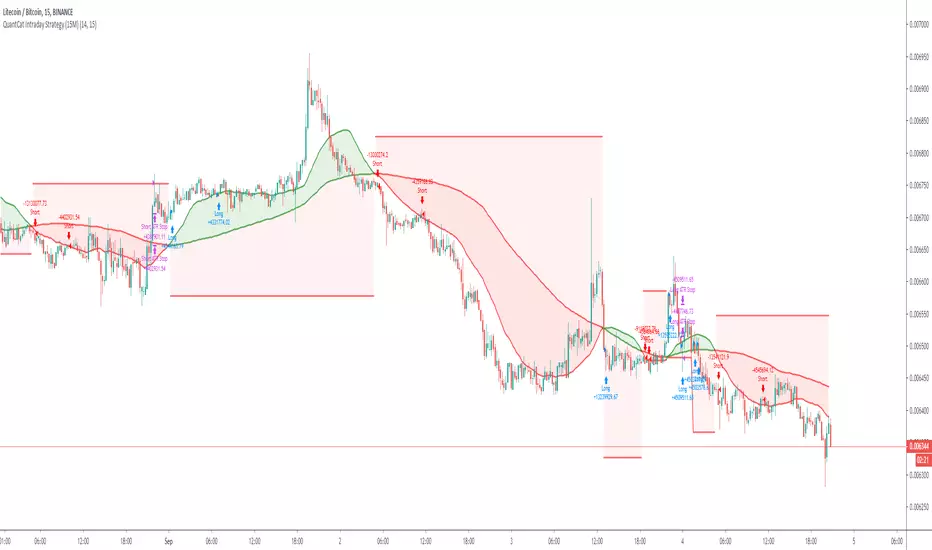
QuantCat Intraday Strategy (15M)QuantCat Intraday Strategy
This strategy is designed to be used on the 15 minute time frame, on liquid x/btc pairs and BTC/USD.
It works by having 2 moving averages, automatic stop loss calculation, and taking positions on MA crosses and MA zone bounces for confirmation.
Stoploss is so crucial to minimise any damage from huge unexpected candles, the strategies can just be used for entries as well, you don't have to stick to the exact formula- of the long and short system, but this by itself is profitable.
The system nets positive results on
-BTC/USD
-ETH/BTC
-LTC/BTC
-XRP/BTC
There is a small element of trend filtering also for the MA's, but I found adding it in actually hindered performance when testing and training the strategies unless it was using a loose value.
You can get live alerts for this strategy and speak to our developers by joining our server on discord! (Link in signature)
DAKELAX-XRPUSDT Bollinger Band Strategy for TradebotlerDAKELAX-XRPUSDT is a Tradebotler strategy designed to run on XRPUSDT for binance, it's a simple reverse to mean strategy and when backtested on may-aug 2019 on H1 timeframe it performs pretty well in backtest as well as running live.
In order to get started install the Tradebotler extension and connect the strategy with Binance or other crypto exchanges of your choice such as Kraken, Bitstamp, Bitmex, Bittrex, Polyneux etc, etc.

Simple Alt Coin Strategy - EMA and MACD w/Profit and StopThis script prints BUY and SELL signals based on settings you input. I use it to save time while scrolling through charts deciding what alts I want to look at.
BUY SIGNALS
Positive EMA Crossover
Positive MACD Crossover
Single Candle Gains
SELL SIGNALS
Profit Capture
Stop Loss
I don't trade based just on the BUY or SELL from this strategy, but I have found that these indicators do very well well looking at the large cap alt coins. It backtests well.
Default Settings EMA 5/12/50, MACD 9/12/26, Single Candle Gain 10%, Stop 10%, Profit Capture 45%


MACD + Stochastic + RSI StrategyMy strategy uses a combination of three indicators MACD Stochastic RSI.
The Idea is to buy when (MACD > Signal and RSI > 50 and Stochastic > 50) occures at the same time
This strategy works well on stocks and cryptos especially during market breaking up after consolidation
The best results are on Daily charts, so its NOT a scalping strategy. But it can work also on 1H charts.
The strategy does not have any stops and profit targets, so we can take all the market can give us at the moment.
The exit point only when MACD goes under Signal
Its Preformance is quite stable.
So, use it, trade it.
If it will help you to imprive your trading results, please donate me
BTC: 12kd1F8buWisUBdq27BBwRkUvzW7Ey3og5

CS Basic Scripts - Stochastic Special (Strategy)This Stochastic Special Strategy features inputs for:
- Custom Backtesting Date Range
- Long and Short Strategy Discinctions
- Utilize SMI, RSI, Martingale, and Body-Filter Strategy
- Adjust the SMI Percent Lengths and Limit
- Automate with the Autoview Trading Bot
Strategy script may be tested by favoriting and adding to any chart.
Study script is available for automated trading at www.cryptoscores.org

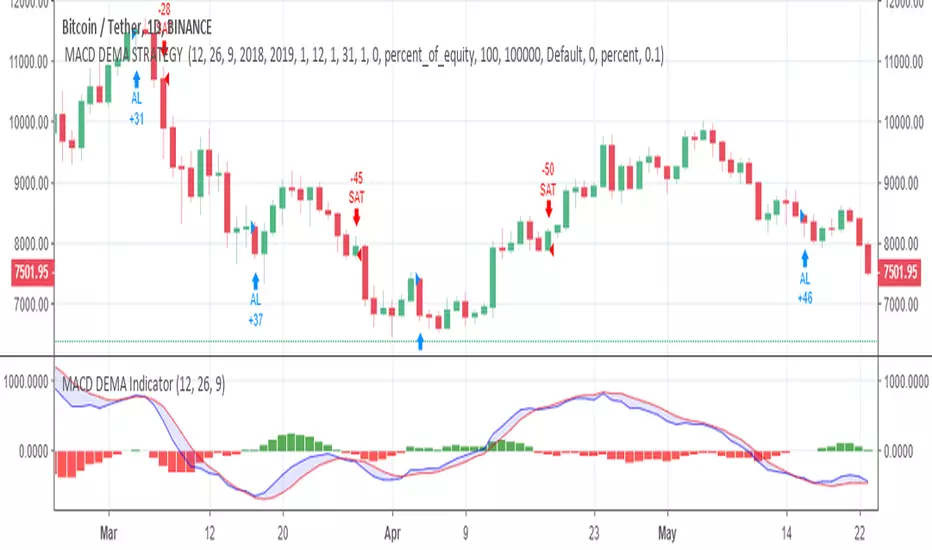
MACD DEMA STRATEGY A strategy based on ToFFF MACD DEMA indicator
Even so , ı dont recommended using MACD DEMA alone.
Combine its code with your favorite indicators.
You can visit ToFFF's indicator :
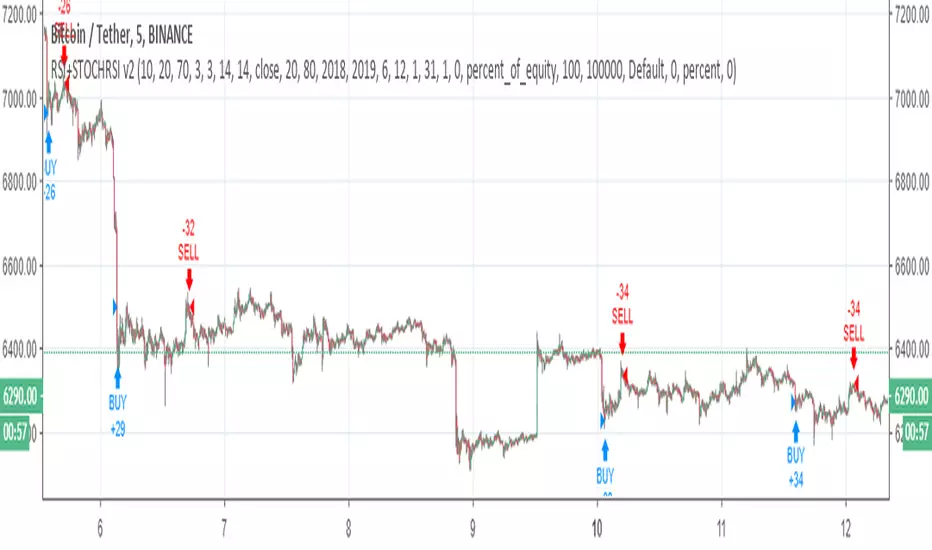
RSI+STOCHRSI v2RSI + STOCHASTIC RSI combination v2 ( for v1 )
For 5 min
Changes
Stcoh RSI creates signal with crossover
RSI created signal with an equation ( above or below the line) ,crossover was added.