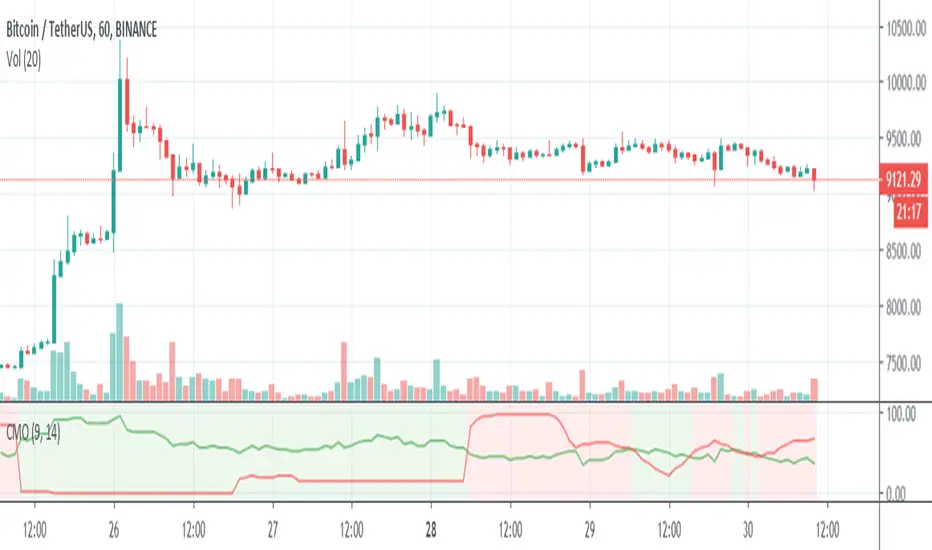
CMOCMO is reading the values of price movements.
Long ==> the green line is over the red one OR the background is green
short ==> the red line is over the green one OR the background is red
Criptomoedas
The Extensive IndicatorThe extensive Indicator reads many kinds of signals and price movements.
Basically,
Long ==> Plus symbol (+) is green and at least 2 other symbols are green ### stop loss when plus symbol is red and any 2 other symbols are red.
Short ==> Plus symbol (+) is red and at least 2 other symbols are red ### stop loss when plus symbol is green and any 2 other symbols are green.

AOOAOO is just working with volume so it's perfect for cryptocurrency and refers if the people are buying or selling.
Long ==> background is green
short ==> background is red

AMAAMA is a mixed indicator that includes exponential moving average and support and resistance levels by each candle and gives you the best value to go long or short.
it reads the volume as well which you could see it on the background color.
once the price closed over the green line then you can make a long order (buy) and the stop loss if the price closed under the red line, and vice versa.
the black line is just to make it as additional support and resistance level
Long ==> price closed over black and green lines ### stop loss if price closed under the black and red lines
short ==> price closed under black and red lines ### stop loess if price closed over the black and green lines.
Background refers to the volume movements so if it's green means people are buying and if red means selling.
I attached EMA and special moving average indicator so you can make them as support and resistance levels once you see price is closing to one of them.

The Power of MovementThe Power of Movement is the indicator that reads the difference of many moving average values and gives a result that is compared with another indicator.
long ==> the green line is over the red one
Short ==> the red line is over the green one.

BTC Volume absolute (fiat vs Tether vs futures)BTC volume split by fiat, Tether and futures in USD
fiat = COINBASE + BITFLYER + BITSTAMP + KRAKEN
Tether = BITFINEX + BINANCE + HUOBI + HITBTC
futures = BITMEX + BYBIT

OracleWhere to use?
Oracle gives the best performance on ETH/USD but also works for BTC/USD and some other charts like XAU/USD ( Gold ). Fails for almost all other cryptocurrencies.
Use 1d or 4h time frames only. 2h and 3h also work in some cases. Use Heikin Ashi candles for the best results.
The strategy is still being tested. Use at your own risk.
How to use?
Arrows start pointing upwards and candle closes above the Orange line - Price is likely to go up
Arrows start pointing downwards and candle closes below the Orange line - Price is likely to go down
Also, the orange line can be used as a mental stop loss point.

MKAST-IndexThis is one of my free for all Indicators.
The TJ-Index is something I have been working on for quite a while and always was wanting to have on my charts, yet it took me longer than expected to finally finish it.
Now it is done and you can simply favourite this script and add it to your chart.
It is made out of 2 main parts.
Part 1:
15 Indicators and conditions like
-Delta MACD,
-Crypto Indicator,
-RSI,
-MACD,
-Momentum,
-CCI,
-OBV,
-Stochastic,
-CMF,
-Raw Buy and Sell Volume Domination,
-Super Guppy,
-Ichimoku,
-DIOSC,
-Volume Weighted MACD,
-Golden cross/Death Cross
Part 2:
The white line - the index itself.
So how this works is, you see 15 horizontal lines in green and red alternating, mentioned in that order above, if a bullish condition islet the horizontal line turn green, if it is a bearish condition, it is red.
The white index line, is basically depicting the number of bullish conditions at the same time.
I have seen that it is extremely powerful for divergences and especially thinking to take any position, checking if the index is high or low at the time.
An extra feature is that if ALL bullish or bearish conditions are met, the background of the oscillator will color itself green or red.
You can also turn on and off the horizontal lines for the easier user of the TJ-Index.
For now, the code will remain hidden, since I still have some important parts of this Index in my main Invite Only Indicator.
I will be publishing an open version of the TJ-Index soy ou can incorporate it in your own indicators.
Should you be interested in my main indicator or scripting work, feel free to DM me.

Codex NY|LDN SessionsPRIVATE SCRIPT published strictly for use/testing by close acquaintances for the Bitcoin and cryptocurrency markets.
Study shows London and New York trading sessions to help provide a closer look at how traditional hours/futures can/do effect the market.

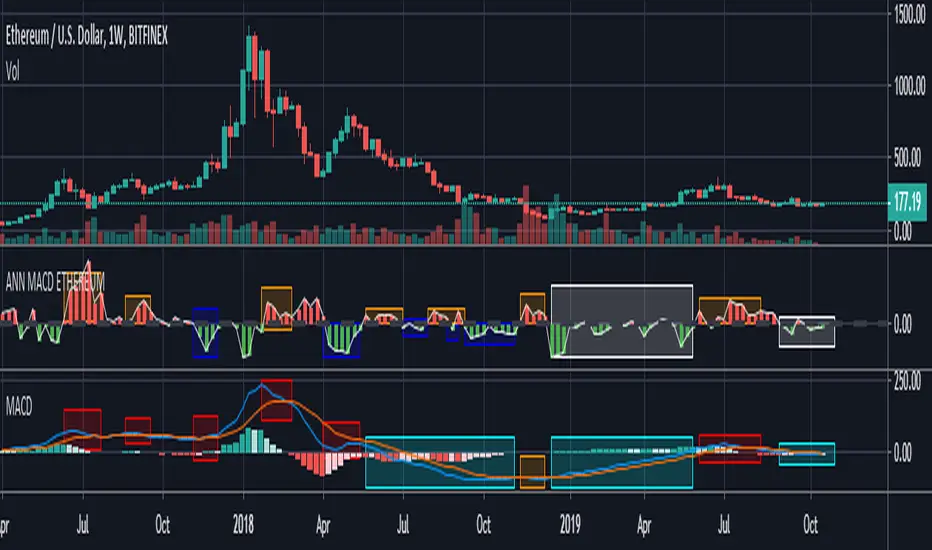
ANN MACD ETHEREUM
This script is trained with Ethereum (Timeframe : 4 hours ).
Details :
Input columns: 19
Output columns: 1
Excluded columns: 0
Training example rows: 300
Validating example rows: 0
Querying example rows: 0
Excluded example rows: 0
Duplicated example rows: 0
Input nodes connected: 19
Hidden layer 1 nodes: 8
Hidden layer 2 nodes: 1
Hidden layer 3 nodes: 0
Output nodes: 1
Learning rate: 0.7000
Momentum: 0.8000
Training error: 0.009378 ( That's a very good error coefficient. )
Many thanks to wroclai for help.
Deep learning series will continue!
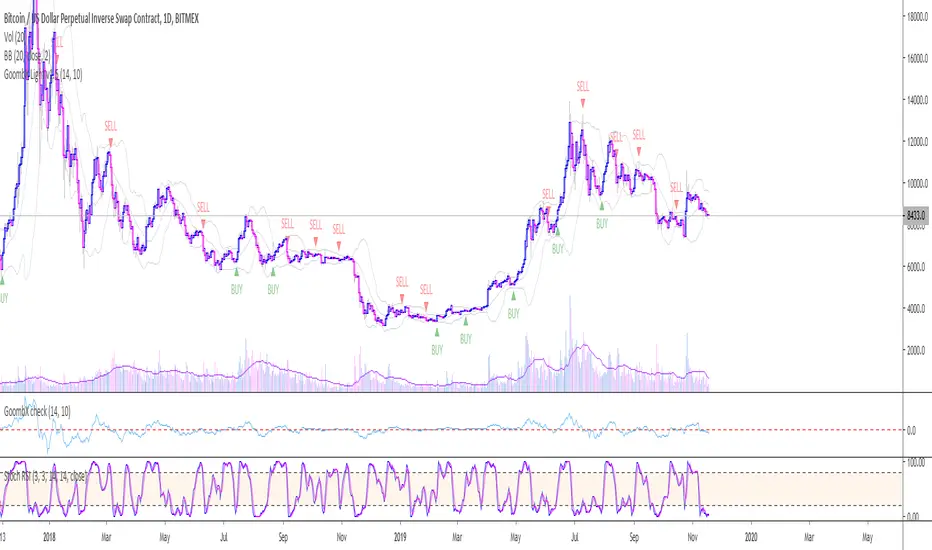
GoombX Light - Get in the trendThis is an MA and stoch RSI based indicator which looks for particular crosses to identify strong trends.
It produces clear signals for:
- BUY when it detects a significant MA cross and the right stoch RSI conditions OR when the SELL signal hits a Stop Loss (adjustable in settings)
- SELL when it detects a significant MA cross and the right stoch RSI conditions OR when the BUY signal hits a Stop Loss (adjustable in settings)
In testing it it performed best on daily chart with a 14 days Lookback window.
NOTE that a signal is only definitive once the trigger candle has closed.
I offer a full featured version which prints STOPS and trade CLOSE. Contact me on Twitter for details on how to gain access.
To setup an alert with GoombX Light, follow these steps:
- Set up GoombX Light on your chart with the desired parameters and Time Frame
- Click on alerts in the right side of the screen and then Add (+)
- Under Conditions, choose the alert you are looking for (BUY or SELL)
- Under Options, choose "Once per bar close"
- Create

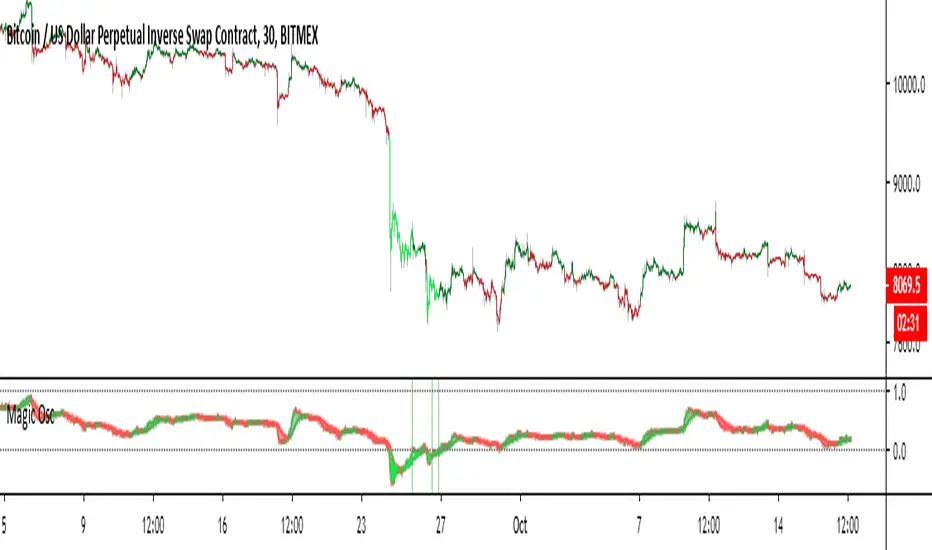
Magical Onion Oscillator V1This script is a oscillator that has many features. It is designed to give infrequent but super high quality signals. The basic concept is that when the fast line goes over 1, price is overbought, and when the fast line dips below 0, price is oversold. This is reflected by both the fill color on the oscillator, and by coloring the bars. When the area between the two lines is green, the trend is up, and when the fill color is red, the trend is down. The trend feature is not the primary use for this oscillator, the overbought/oversold signals are much more powerful.
Signals
When the bars are colored bright red or green, that means the price is overbought/oversold.
When the fill color is green, the trend is up. When the fill color is red, the trend is down.
Entry signals are given by the vertical green or red stripes in the oscillator window.
Settings
Timeframes 1-4 These settings are to change the time frames the oscillator uses to do calculations. The defaults should work fine for most time frames, but I allow you to modify these for extremely small or large timeframes. The input needs to be a multiplied minute, day, week, or month. For example if you would like to use this on the 1min chart, a possible setup could be 60,240,720,D. This would correspond to 1hr, 4hr, 12hr, D. If you wanted to use it on a larger timeframe like the daily, you could use M,2M,3M,4M. Which would mean 1,2,3,4 months. The default timeframes are very good for the charts in the range of 30min to 4hr.
Fast Length This is the smoothing factor for the fast line. The default is recommended, but you are free to customize as needed. Note that a higher value here will decrease the amount of signals.
Slow Length This is the smoothing factor for the slow length. It will work similarly to the short length, smaller values will increase signal frequency, but also make the trend signal choppier.
Adjustment Lag Turning this value down will cause the indicator to remain oversold and overbought for shorter periods. This will decrease the amount of signals. Turning it up will have the opposite effect.
Color Bars Toggling this turns on and off the bar coloring.
Color Lines According to Trend Toggling this option colors the oscillator lines according to the trend direction.
Please send me a message or leave a comment if you have any questions, good luck.
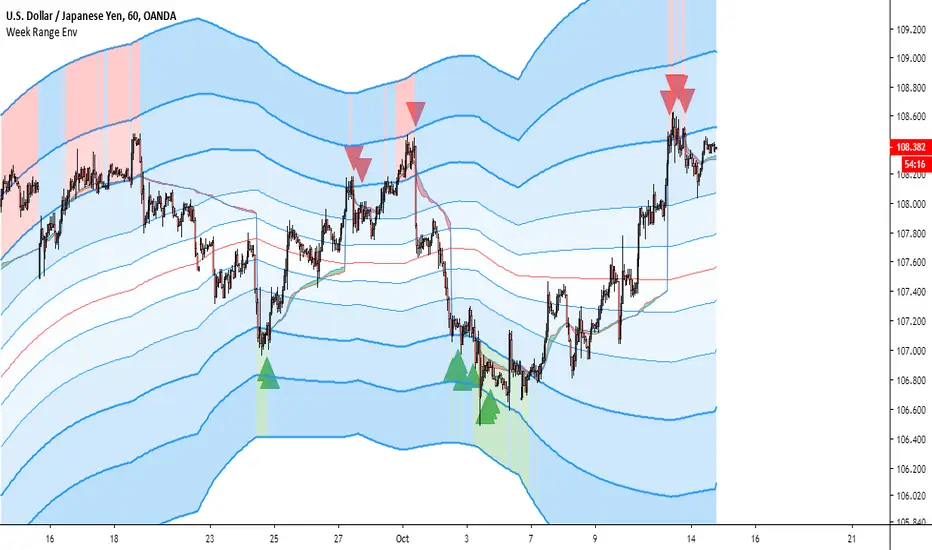
Dynamic Weekly Price Envelope
This is a indicator that I have been developing and personally using for over a year. The basic concept is a dynamic range that is derived from the previous weeks range. The main philosophy followed when designing this indicator was that it should be applicable to all asset classes, and it should provide objective price levels of support and resistance that do not change when price approaches them. This indicator is most useful in range bound price action, but gives a lot of useful information on any market condition at a glance. The indicator also generates a custom vwap that reflects the volume weighted price since the price broke significant levels.
Indicator Description
The indicators most important price levels are the top 3 lines and the bottom 3 lines. These lines are distinguished by their wider line thickness with default settings. These levels act as support and resistance, and the price entering these regions indicates that the asset is overbought or oversold. A setting is available to highlight in red or green when price is overbought or oversold. Here is an example:
This example also demonstrates one of my personal favorite signals, which is when the price reenters the central channel, then retests the overbought/oversold region, as it does in the example, shown by the second set of red arrows.
Timeframes
This indicator reacts dynamically, so the levels will look different on different timeframes. The hourly chart works best from my experience in forex and crypto with default settings, but in general lower timeframes will give a more accurate picture during extreme price action. Note: assets that have shorter sessions generally should use a smaller timeframe. I like to use 15min on stocks, this is similar to the hour chart in crypto or forex. Take this GBPUSD chart for example:
As you can see the price has a very extreme impulse, and all resistances are passed. You can see that the lines still act as support when price falls back into the range, but the indicator is not very useful when price exits the range. The solution for this is to drop down to a lower timeframe that will adjust faster to the extreme price movement.
Here you can see that the range shifts with the price movement, indicating support levels throughout the entire price impulse.
I will also drop down to lower timeframes if I want to utilize the price levels within the channel as support and resistance levels for intraday trading. Here is an example with price level interactions indicated by red and green arrows.
THe most significant levels are still the centerline and the top and bottom three levels, but the inner lines also are nice for intraday support and resistance.
Larger time frames like the daily chart also are useful. Let's take the daily Bitcoin chart as an example:
On larger timeframes,
If price is below the central red line price is trending down, and if price is above central red line, the trend is up
The asset trading outside of the entire range indicates that the trend is very strong, reentry into the channel indicates that price is likely to consolidate.
The outer lines still serve as significant support and resistance.
Settings
I have configured the default settings to perform well for most assets, but I allow the user to change settings as they desire.
Line Color - this setting changes the color of the lines.
Fill Color - this setting changes the fill color used for the indicator
Line Transparency - The transparency of the lines, set to 100 to completely hide all lines
Base Fill Transparency - This setting changes the base transparency for the channel, this transparency will be used for the outermost bands
Transparency Gradient Step - each band will become this amount more transparent as they come closer to the centerline
Adjustment Lag - this adjusts how quickly the channel adjusts when the top and bottom levels are breached. I have always used 100, but using much higher or lower values gives interesting results.
Show Signals - This enables basic swing signals to be shown by red and green triangles. Note that this is only one signal, and the system actually has many signals outside of these triangles. They only indicate optimal entries for a swing trading technique based on the indicator.
Show Oversold/Overbought Price - ticking this box results in the fill color changing to green when price is oversold, and red when the price is overbought.
That about covers all the basics for using this indicator, please reach out with comments or messages if you would like to know anything more. Thanks for reading, and I hope you can use this tool to help your analysis. A monthly version and a refined strategy are in the works and will be published soon.
That One Indicator (Free) - [Backtester]This Backtester comes with the following indicators:
Bollinger Bands
ADX
Moving Average Trend Confirmation Filter ( EMA , SMA , DEMA , TEMA , WMA , VWMA , SMMA , HullMA, LSMA , ALMA , SSMA, TMA, ZLEMA )
And a few more indicators in the back-end to increase accuracy
This strategy works really well as a scalper on lower Time Frames as well as on higher Time Frames. Besides that you can also trade it on pretty much any coin or asset.
The alerts script is not repainting. We advise to use alerts on “Once Per Bar Close”.
If you’d like to automate this strategy you can do that by using our alerts script with AutoView, ProfitView, ProfitTrailer, CryptoHopper etc.
Alerts are set very clearly as Long and Short to avoid confusion.
Feel free to leave a comment and share it with your friends.

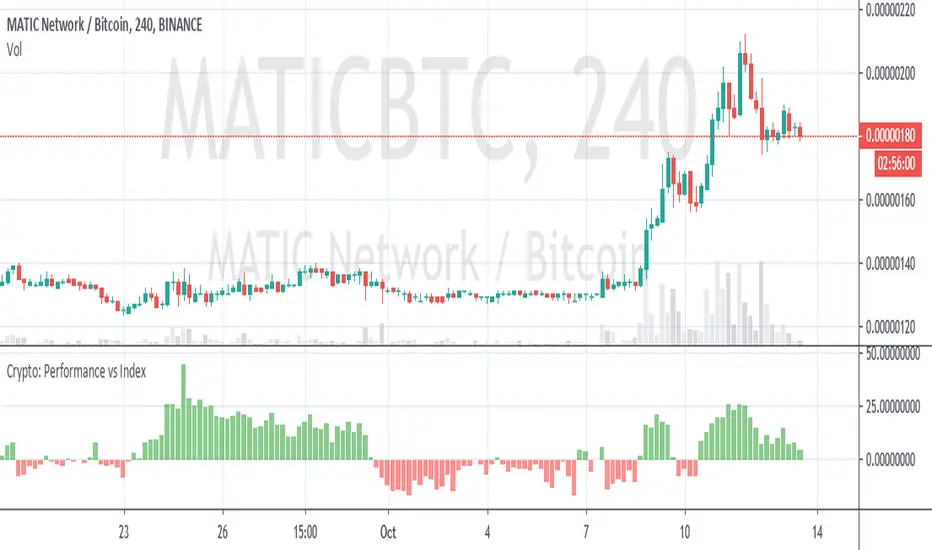
Crypto Performance vs IndexQuickly shows you if an altcoin is outperforming or underperforming it's peers. You can compare again indexes of high cap, mid cap and low cap indexes, which are provided by FTX.com. I intend to add some more features but am currently a bit busy so wanted to get it published as I've been finding it useful
InfoPanel - SeasonalityThis panel will show which is the best month to buy a stock, index or ETF or even a cryptocurrency in the past 5 years.
Script to use only with MONTHLY timeframe.
Thanks to: RicardoSantos for his hard work.
Please use comment section for any feedback.

Extreme ScalpingThis is a test of an easy scalping method: buy if actual close is below forecast close and sell if actual close is above forecast close. Take profit and stop loss shall be very small (few pips) as in most of scalping strategies.
No filter is used for only long or only short positions, but you can select buy only or sell only based on other indicators or whatever you feel is the direction of trading.
NOTE: you can add this strategy to your chart but you should modify the backtest day otherwise you will get an error due to calculation limits of pine script. For example, on one minute chart, you should set the backtest day from today only. For past days, set both start day and and day.
I have also a study with alarms.
Please use comment section for any feedback.

InfoPanel Divergence IndicatorThis panel spots divergences of some well knonw indicators. It may be usefull because you have all indicators in one panel only.
Also, you can check on chart which indicator gives better results of each pair on stock or index or crypto.
TO DO: to add custom indicators.
thanks to: RicardoSantos for his script of panel coding
Tradingview scripts
Other members of TV community (I cannot remember the source and inspiration of all snipets)
Please use comment section for any feedback.

InfoPanel Indicators microtrendThis panel shows current value and trend of some well knonw indicators. It may be usefull because you have all indicators in one panel only.
thanks to: RicardoSantos for his script of panel coding
Tradingview scripts
Please use comment section for any feedback.

REAL STRATEGY : Dow_Factor_MFI/RSI_DVOG_StrategyI'm actually one of those who think it's more important to extract clues from indicators than strategy, but I wanted to test the data about the probability and dow factor I've shared for a long time.
Usually, Bitcoin is used as an eye stain for strategy success, since the graph has increased significantly from the beginning.
To prevent this, I used a commission and in the last lines of document I shared Bitmex's Bitcoin and Ethereum 1W test results.
I don't think there's a factor to repaint. ( Warn me if u see or observe )
I considered Bitcoin because I found working with liquid parities much more realistic.
Ethereum and Bitmex have been featured as a spot and may soon find a place at the CME , so I've evaluated the Ethereum .
But since the Ethereum Bitmex was also spot new, I deleted results that were less than 10 closed trades.
Since the Dow Theory also looks at the harmony in the indices, just try it in the Cryptocurrency market.
Use as indicator in other markets. Support with channels, trend lines with big periods and other supportive indicators.
And my personal suggestion : Use this script and indicator TF : 4H and above.
Specifications :
Commission. ( % 0.125 )
Switchable Methods ( Relative Strength Index / Money Flow Index )
Alarms. (Buy / Sell )
Position closure when horizontal market rates weighs.
Progressive gradual buy/sell alarms.
Clean code layout that will not cause repaint. (Caution : source = close )
Switchable barcolor option (I / 0 )
*****Test results :*****
drive.google.com
Summary:
It was a realistic test.
It has achieved great success in some markets, but as I mentioned earlier, use it only to gain insight into the price movements of cryptos.
Use as indicator in other markets.
This code is open source under the MIT license. If you have any improvements or corrections to suggest, please send me a pull request via the github repository : github.com
Stay tuned ! Noldo.

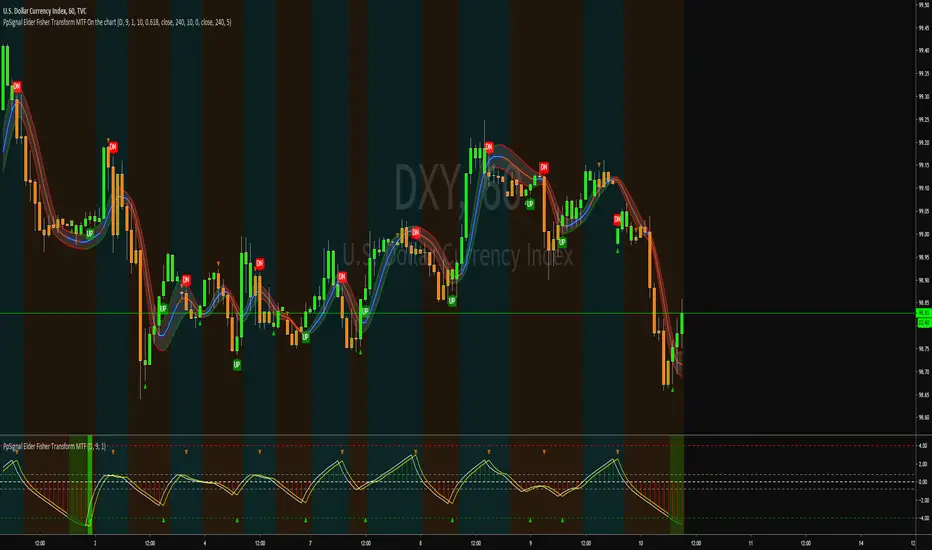
PpSignal Elder Fisher Transform MTFWhat is the Fisher Transform Indicator?
The Fisher Transform is a technical indicator created by J.F. Ehlers that converts prices into a Gaussian normal distribution. In this way, the indicator highlights when prices have moved to an extreme, based on recent prices. This may help in spotting turning points in the price of an asset. It also helps show the trend and isolate the price waves within a trend.
The Fisher Transform attempts to normalize asset prices, thus making turning points in price clearer.
Some traders look for extreme readings to signal potential price reversal areas, while others watch for a change in direction of the Fisher Transform.
The Fisher Transform formula is typically applied to price, but it can also be applied to other indicators.
Asset prices are not normally distributed, so attempts to normalize prices via an indicator may not always provide a reliable signal.
The Fisher Transform Explained
The Fisher Transform enables traders to create a Gaussian normal distribution, which converts data that isn't typically normal distributed (like market prices). In essence, the transformation makes peak swings relatively rare events to help better identify price reversals on a chart. The technical indicator is commonly used by traders looking for leading signals rather than lagging
indicators.
How to use the script?
Buy Long signal when the histogram is green and the background is aqua.
Sell signal when the histogram is red and the background is orange.
More signal in the script
you ave two scalping signals, when the move average high (gray color) is over the low signal (yellow) you will see a triangle this i a good signal for anticipating to the long signal.
and viceversa when the low signal is below to the high signal, you will see an orange triangle.
Beast ATR (Average True Range)Average true range (ATR) stands for Average True Range which measures how much price moves on average. It has to be used as a volatility indicator that shows how much an asset moves, on average, during a given time frame.
Understanding volatility is important to make the right trading decisions as we will see later. Understanding how volatility changes with market context can help you make much better trading decisions as well.
I like to use this one for margin trading and on lower tf (1h, 2h, 4h).
