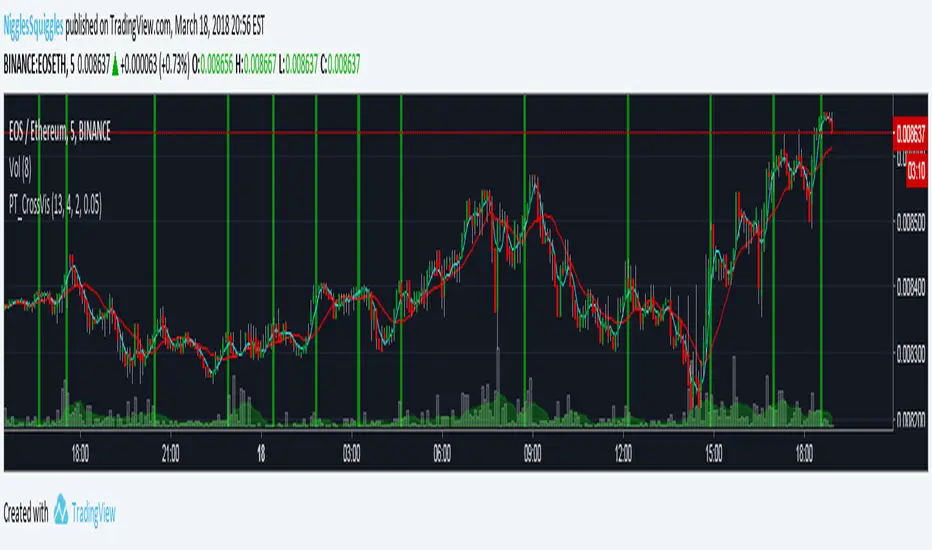
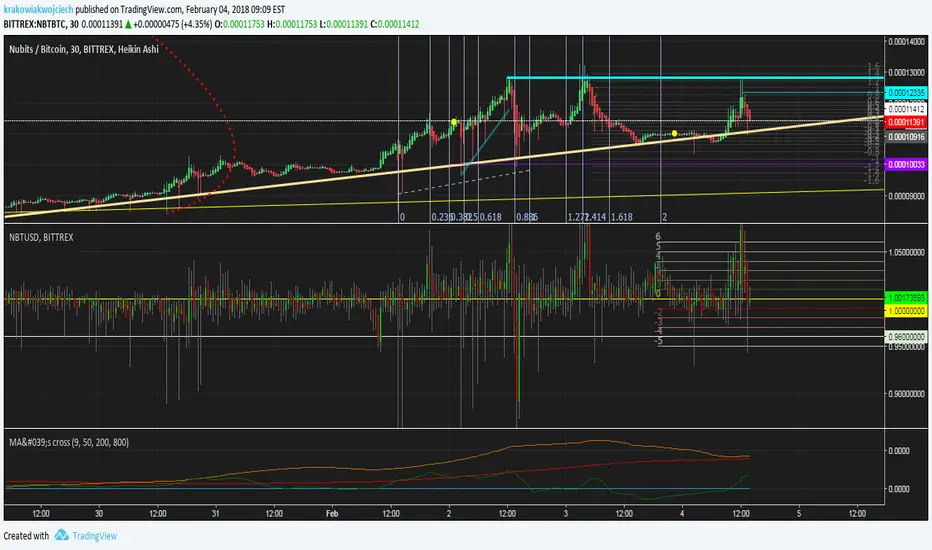
PT_MA Cross VisualiserThis indicator is designed for use with Profit Trailer's CROSS strategies.
The user can select either EMA or SMA averages and input their own buy value settings.
Crossover
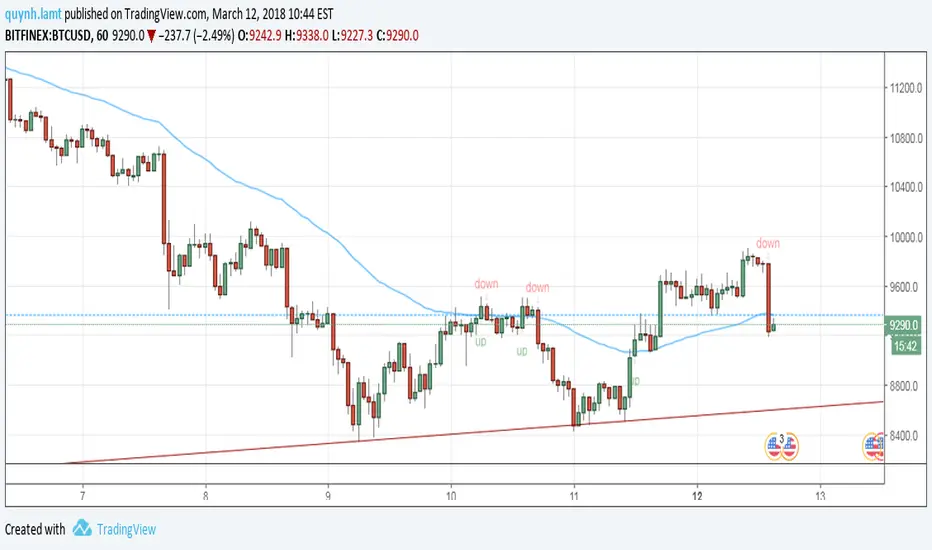
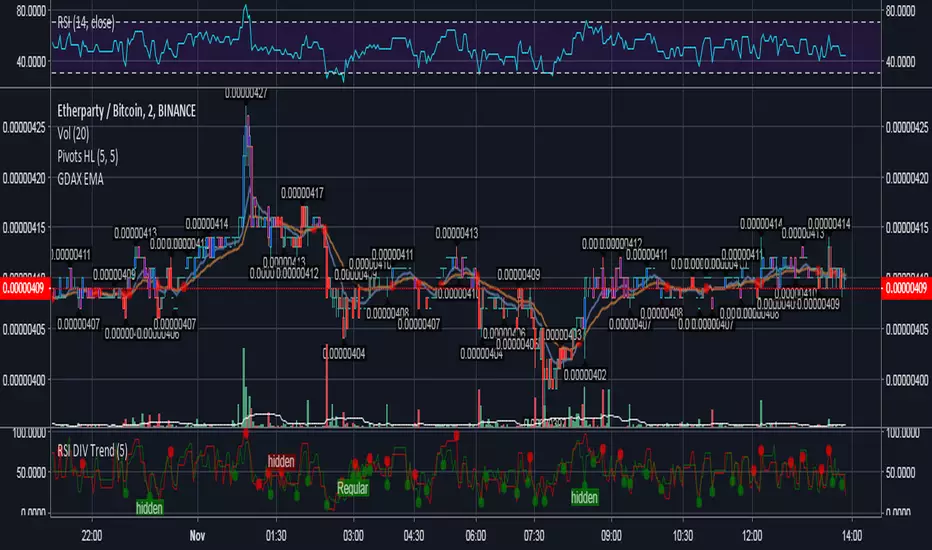
GDAX EMA Cross[26,12]This indicator allow to show the EMA of the price similar to GDAX user interface.
The purpose of this indicator is twice:
Allowing the user to show a double EMA with the possibility to show when a EMA crossing happens.
Showing in a more user friendly interface the GDAX ema line.
As a matter of fact is proven that those 2 EMA act as support/resistance during Bulls/Bear periods. The indicator works fine in the GDax timeframes, or rather 5m, 15m, 1h and daily excluding 3h and 6h as they're less used at the moment.

NeoButane Speciality Moving AveragesWhere we're going, we don't need candlesticks.
When the color changes: crossovers and crossunders
Color bright: uptrend
Color dark: downtrend
Switches optional for a longterm trend MA and crosses for crosses.
Much more planned.


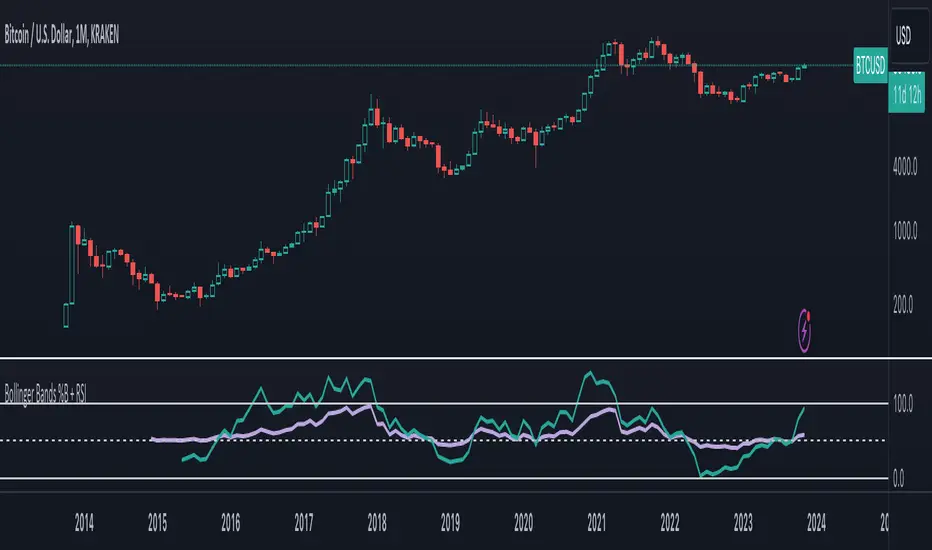
Bollinger Bands %B + RSIBollinger Bands %b and RSI in one, and a experimental RSI cloud based in BB formula.
RSI scale goes from 0.00-1.00 instead of 0 -100.

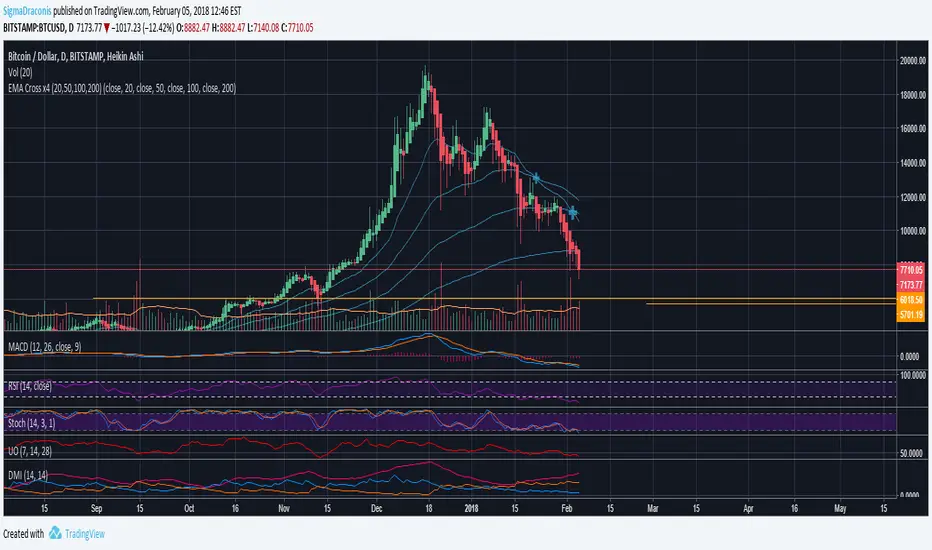
EMA Cross x4 (20,50,100,200)4 plots of EMAs and its crossings:
- 20/50 EMA
- 20/100 EMA
- 50/100 EMA
- 50/200 EMA

3 EMAs | 1 IndicatorExponential Moving Average (EMA) 14, 50 & 200 (default values) with cross indication of 14/50 and vice versa.
Values can be amended based on whatever EMA periods you use.

Triple Moving Average Crossover IndicatorGo Long as the fastMA crosses above the slowMA (All Green Fill)
Go Short as the fastMA crosses below and other MA (Red)
Prep for next movement when the fill colours are mixed together.
Back this up with volume and momentum indicators.
I'm currently working on turning this into a strategy.
Please let me know what you think, as this is my first indicator.

TRIX Histogram R1-12 by JustUncleLCreated by request.
Description:
This study is an implementation of the Standard TRIX indicator (a momentum oscillator), shown in coloured histogram format by default, with optional Bar colouring of TRIX zero cross overs. Other options include showing TRIX as a line graph instead of histogram and an optional TRIX signal line with difference histogram (to highlight signal line crosses).
References:
forex-indicators.net
"TRIX MA" by munkeefonix


Intraday - Exponential Moving Average 3 CrossOverA Simple EMA crossover strategy for intraday traders.
A Buy signal is triggered when a green arrow is followed by a blue arrow.
A Sell signal is triggered when a red arrow is followed by a purple arrow.
To remove false positives, combine this with other indicators.

EMARCOThis is the study of the ratio of the MACD exponential moving averages, 0.993 and 1.003 were used to define the overextended positions since this is the highest the oscillator usually goes, price tends to reverse when overextended. RE1 (ratio equation 1) = the fast Exponential Moving Average (12 points) divided by the slow Exponential Moving Average (26 points) and RE2 is reciprocal. Here we see that when the RE1 is greater than RE2 price tends to drop and so when the opposite is true

[INDICATOR]Renko Emulator OCC v1 by JustUncleLThis "Study" project has been created by request and is used in conjunction with the "Strategy" version.
*** EXPERIMENTAL ***
*** USE AT YOUR OWN RISK ***
Description:
Indicator based around Renko Bar Chart emulator (ATR) with direction change used to signal buy/sell trades.
I have generally found that setting the strategy ATR resolution to 3-5x that of the chart you are viewing tends to yield the good results, regardless of which chart time used. Positions get taken automatically following THE Renko Bar after a crossover.

Triple Guppy CrossGUPPY MULTIPLE ESTIMATED MOVING AVERAGE (EMA) is for Trend Trading. This script uses three sets of crosses to give us an indicator of possible trend reversal. Red cross is the first alert, followed by blue and black. Black cross being the strongest, red cross weakest.
More information about Guppy Trading can be found in the link below

Trend MA 20Simple to use for anyone trading a 20 length moving average.
Crossover is signaled once 20 MA crosses 1 MA at close of selected time interval.

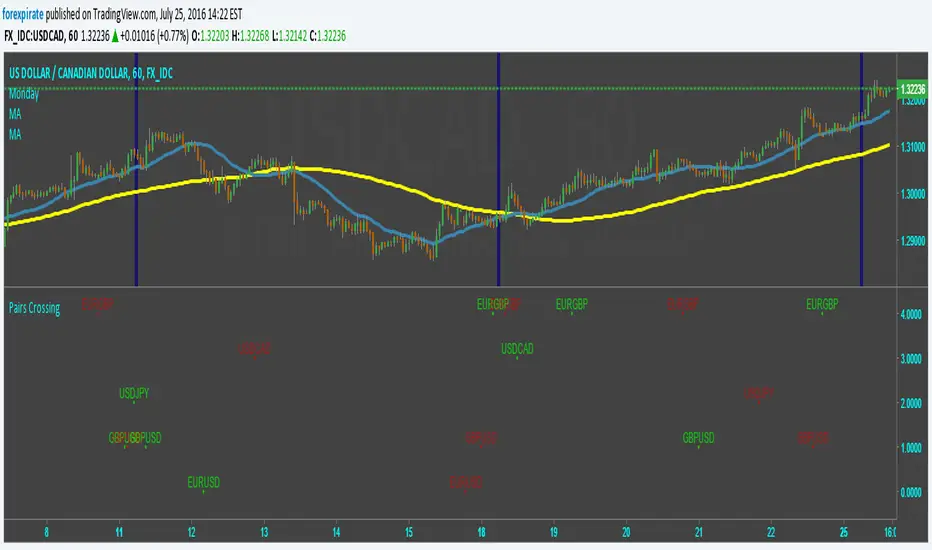
Pairs SMA Cross Over/UnderIndicator shows when a pair's SMAs cross-above or cross-under. You pick the pairs by changing the s#-corresponding to the p# matching the pair you want. The other variable numbers are out of order but it doesn't matter expect to the look of the script.
Indicator420double hull moving average crossover
hull moving average / volume weighted moving average crossover
Red dot = SELL
Green dot = BUY
or
Longest MA color change to green = BUY
Longest MA color change to red = SELL
by SeaSide420

RN MACD SignalsThis is my simple way to quickly see MACD signals without having the MACD taking up space. The one at the bottom is for display to show how this works. A crossover occurs when the arrow flips over. The position of the arrow tells you if it is currently above or below the zero line. You can change the script to overlay and have it show up above or below price also. Let me know what you think.
