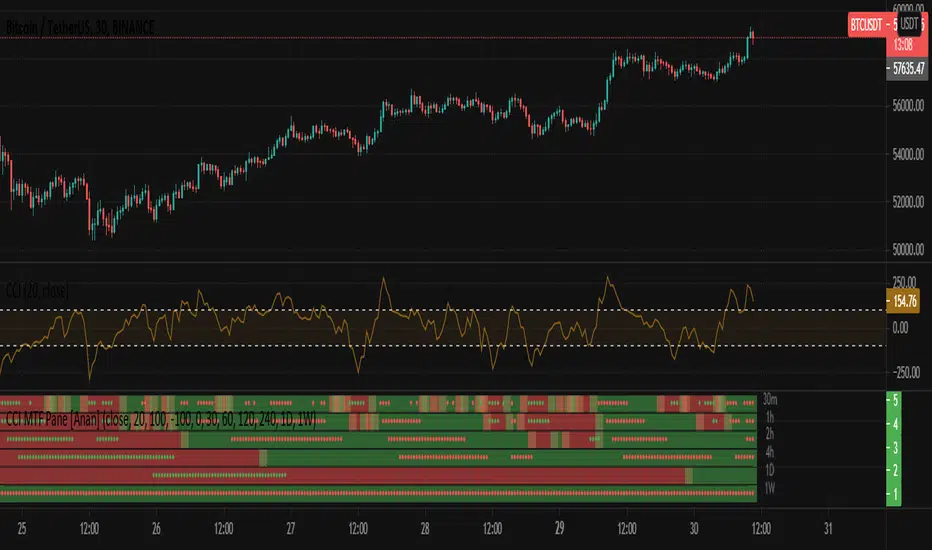
CCI MTF Pane [Anan]Hello friends,
This is CCI MTF Pane:
Green Line : CCI >= 0
RED Line : CCI < 0
Green Dot : CCI Oversold >= 100
Red Dot : CCI Overbought <= -100
You can modify these values from indicator settings.
Canal Índice de Commodities (CCI)
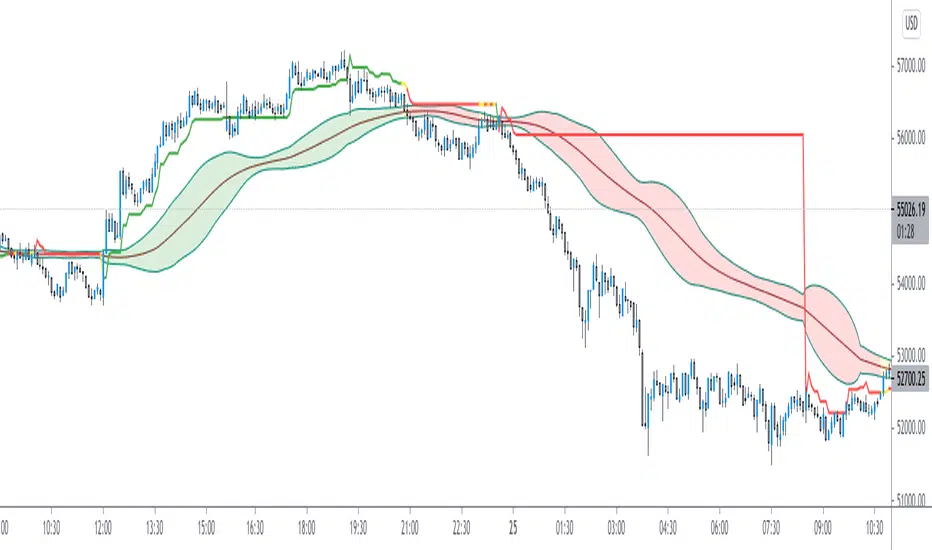
CCI Super BandsCCi Super Bands ,
Is an Indicator to plot Commodity Channel Index Projections over the Price Chart
It's offers interesting price Analysis
There are two major parts to the indicator!
1. The Optimal CCI Line
2. A CCI Standard Deviation Bands
Color Codes Meaning:
Red : Strength in Bearish Intent
Green : Strength in Bullish Intent
Yellow : Consolidation estimations
Try to play with this indicator
and Enjoy
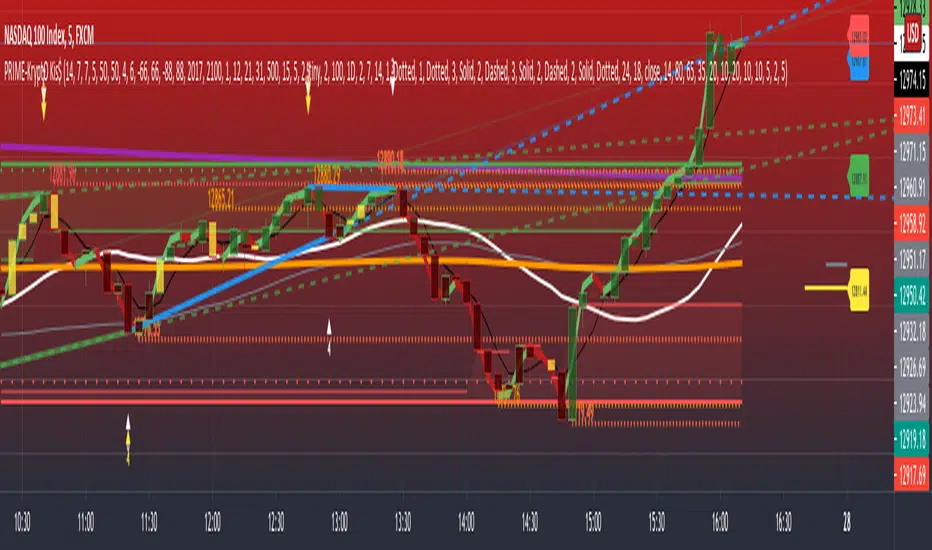
PRIME - Krypto Kiss+CCI+VPIntroducing from Prime Academy, the experimental "KryptO Kis$" algorithm, which combines our most powerful scripts all in one indicator. Available to the user are a full options platform to adjust parameters as well as individually blind indications for precise chart analysis. The following algorithms have been utilized:
* Prime Pulse (3 Candle System) - The original impulse and momentum indication system, it take rsi and tsi data to provide users with the indication of initial impulses, as well as a yellow candle to ascertain when there is a possible change of momentum in the current impulse.
* 5 SMA - The original Sniper Cross system seen from previous strategies, using the 4, 21, 50, 185, and 800 SMA's to determine changes of trend, continuation and support levels.
*CCI Indication on Chart - The system provides realtime CCI data in correlation to price positions within the general chart matrix, receiving system variables from various crosses on the 100 to -100 scale for CCI. Bullish and Bearish indications are clearly defined by separate colors.
* Volume Profile with tags - This system provides current volume data for the current time frame and sequence, also giving available tags at prices holding high volume orders, historically and present as indicated by the difference in length of indications. color saturations indicate the intensity of volume at the price in question .
* Shadow ZoneZ - Provides Support and resistance levels using rsi overbought and over sold data, sourced on the close of previous prices. Also embedded in the code is an additional volume confluence via indications of dotted lines with prices available, giving sequence positions of "Whales" and their support and resistance levels by order volume at price.
* An added bonus of the Shadow ZoneZ is the auto trend line and trend channel function , as well as the highlighted zones of liquidity waiting to be filled from previous impulses and lack of present retracements.
Any questions can be directed here on site via Direct Message. Any feedback is welcomed, and thank you in advance. Trade Well, Family!
- Dee Prime
//Disclaimer:
//Trading success is all about following your trading strategy and the indicators should fit within your trading strategy, and not to be traded upon solely
//The script is for informational and educational purposes only. Use of the script does not constitute professional and/or financial advice.
//You alone have the sole responsibility of evaluating the script output and risks associated with the use of the script.
//In exchange for using the script, you agree not to hold the publishing TradingView user liable for any possible claim for damages arising from any decision you make based on use of the script.
PRIME - R.o.c.M Ind. W/ TrendsThis experimental script is a variant of a model that allows a separate indicator window to be opened, revealing data for on balance volume, rsi, consumer commodity index and momentum indications. By use of the settings key, you can change the parameter of the source input as well as the desired lengths. After data compilation, the indicator will automatically draw any trend lines applicable to what is presented. The additional code is an attempt to allow the system to apply pivot points for alerts within the indicator itself.
Disclaimer:
Trading success is all about following your trading strategy and the indicators should fit within your trading strategy, and not to be traded upon solely
The script is for informational and educational purposes only. Use of the script does not constitute professional and/or financial advice. You alone have the sole responsibility of evaluating the script output and risks associated with the use of the script. In exchange for using the script, you agree not to hold the publishing TradingView user liable for any possible claim for damages arising from any decision you make based on use of the script

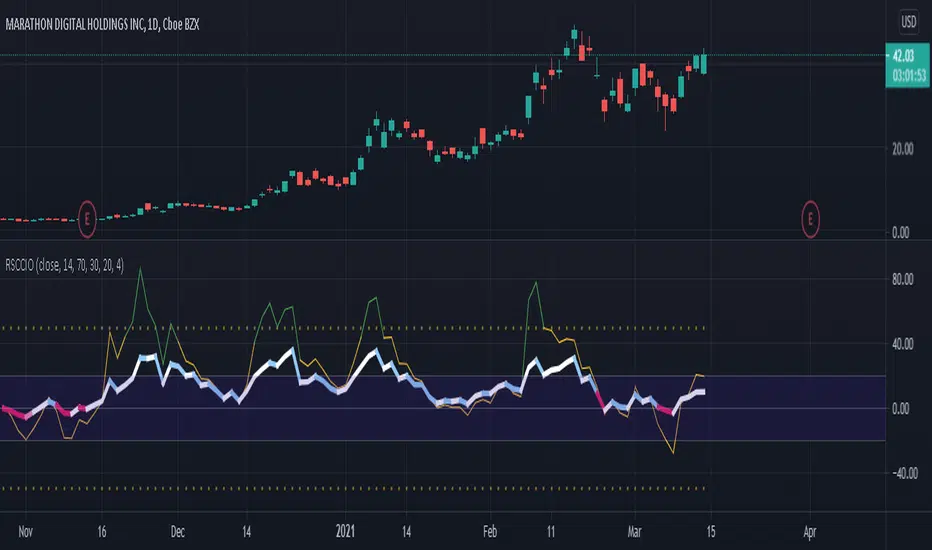
[SK] RSI/CCI Correlating OscillatorThe combination of RSI and CCI can be a powerful tool to efficiently signal the strength of the trend and upcoming reversals.
The magic comes when you're able to correlate both indicators correctly, this is the power I give you with the RSCCIO.
I've added additional features to each indicator that make signals more clear and easier to identify.
On the RSI
Directional color coding similar to what you can find on a MACD. This helps to identify the general trend ( above or below midline ) and the of the movement within.
For precise correlation the RSI is adjusted to a midline of 0. You can still enter the overbought/oversold levels as you'd expect on a regular RSI and it will be automatically adjusted.
On the CCI
Extreme strength / weakness color coding when the value exceeds the range makes signals more clear.
For precise correlation with the RSI, we need to scale down the value of the CCI with the Sensitivity Input. The default value works overall but feel free to play around to adjust the scale of the CCI movement.
---
RSI Relative Strength Index
The RSI is a momentum indicator that measures the magnitude of recent price changes. An asset is usually considered overbought when the RSI is above 70% and oversold when it is below 30%.
CCI Commodity Channel Index
The CCI was originally developed to spot trend changes. Use the CCI on the longer-term chart to establish the dominant trend and on the shorter-term chart to isolate pullbacks and generate trade signals.
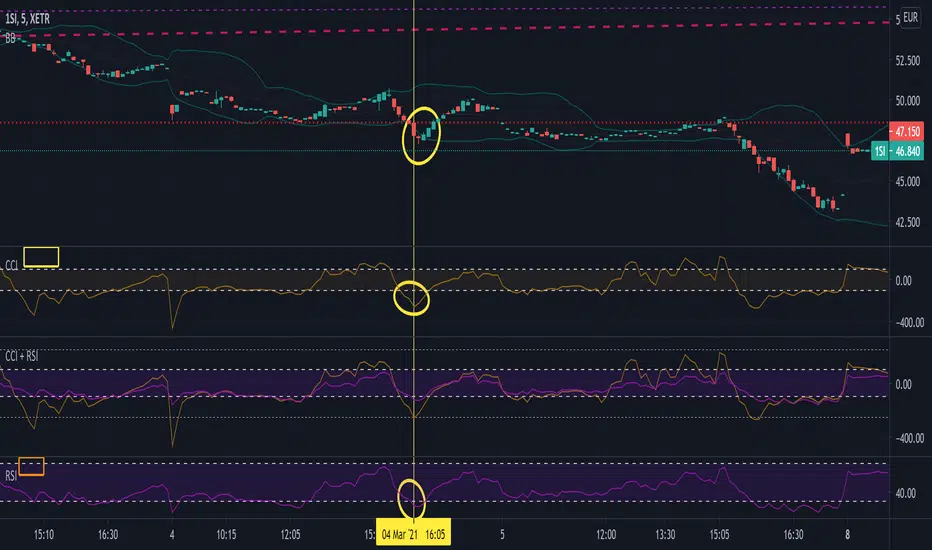
Commodity Channel Index + Relative Strength Index (Same Scale)Mashup, combining (adjusted) RSI and CCI.
These two indicators serve similar functions, but on different scales. I combined the two versions from the TradingView Built-In library into one chart, keeping the default setting for the CCI signal lines and fitting the RSI's default signal lines to them, so that they line up. I therefore adjusted the RSI to match the approximate range of the CCI and added additional lines to represent the maximum and minimum values of the RSI (0 - 100).
I did that by multiplying the RSI with 5, and subtracting 250.
Adjusted RSI = (RSI * 5) - 250
So the upper signal line (default: 70) now matches the line used for the CCI at 100. The lower signal line (default: 30) lines up with -100.
If you want to adjust them, you need to use the formula. I annotated the code if you want to dive deeper.
This indicator uses the original code and styling of the default Built-In RSI and CCI. Credit goes to the appropriate developers. My only intent is to mash up both of these indicators, making it easier to compare them.
Interpreting this indicator is the same as interpreting the underlying indicators. If you find any unexpected correlations, comment.
MTF CCI with timeframe control function and signal/alertJapanese below. / 日本語説明は下記
Summary
This indicator shows CCI of the current timeframe and another CCI from upper timeframe as MTF CCI with ability to show signals and set alerts when crossing upper/bottom bands.
For general use of CCI, please refer to the link below(by TradingView)
jp.tradingview.com
How is it different from other MTF CCI indicators?
Problems with other MTF CCI indicators are;
-If you set higher timeframe CCI(MTF CCI), it will also be shown on further higher time frames.
i.e. If you set 4hour chart’s CCI on 1 hour or lower time frame charts, it will also appear on daily and weekly chart, which is not necessary.
To tackle these problems, this indicator has incorporated functions below.
-To be able to control timeframes where MTF CCI is displayed to eliminate unnecessary information when you open higher time frame’s charts.
For example, if you select daily timeframe for MTF CCI, the CCI will be shown only on 4 hour or lower timeframes.
These are the values added on this indicator.
Specifications
-This indicator shows one CCI from the current timeframe and another CCI from another timeframe(MTF).
-For MTF CCI, you can select upper timeframe from monthly, weekly, daily, 4hour, 1hour, 30mins, 15mins, 5mins.
Again, if you select weekly for MTF, for instance, then MTF CCI will be displayed on daily or lower timeframes. Other timeframes work same.
-For both CCI(current timeframe) and CCI(MTF), signals will be shown when they cross over/under upper band and lower band, which you can control display on style tab of the indicator.
-Alert can be set same as signal conditions.
Please see the sample chart below.
Brown triangle is signal for CCI(current timeframe) and maroon signal is for MTF CCI.
--------------------------------------------------------------------------------------------------
現在時間軸のCCIと上位足のCCIを表示するマルチタイムフレームCCI(MTF CCI)インジケーターです。アッパーバンド、ロワーバンドと交差した時にシグナルを表示するとともに、アラートの設定も可能です。
CCIの一般的な使い方は以下のリンク(TradingView)を参照ください。
jp.tradingview.com
他のマルチタイムフレームCCIとの違い
他のマルチタイムフレームCCIのインジケーターでは、以下の問題に直面します。
・上位足のCCIを表示すると、さらに上位足でもそのCCIが表示され見にくくなる。
例: 4時間足のCCIを下位足で表示可能な様に設定すると、日足や週足でも表示され、チャートがノイズだらけに・・・
この問題に対して、このインジケーターでは、
・上位足のCCIを表示する時間軸を制御することで上位足で不必要な情報を表示させない。
という機能を加えることでこれらの問題を解決しています。
機能概要
・このインジケーターでは現在の時間軸のCCIと上位足から一つのCCIを表示します。
・上位足は月足、週足、日足、4時間足、1時間足、30分足、15分足、5分足から選択することが可能です。
・上位足のCCIは選択した時間軸未満の時間軸に表示されます。
例:
日足のCCI : 4時間足、1時間足、30分足、15分足、5分足、1分足チャートにのみ表示
4時間足のCCI : 1時間足、30分足、15分足、5分足、1分足チャートにのみ表示
・上位足のCCIは選択した時間軸未満の時間軸に表示されます。
・現在時間軸のCCI、MTF CCIともに、アッパーバンド/ロワーバンドと交差したタイミングでシグナルを表示することができます。(アッパーバンド/ロワーバンドそれぞれに対して上に交差、下に交差のタイミングで表示されます。不要なものはスタイル設定画面で非表示とすることができます。)
・シグナルは設定画面で表示・非表示の切り替えができます。
・シグナルと同じ条件でアラート通知の設定が可能です。
サンプルチャート
1時間足に4時間足のCCIを表示したものです。茶色の三角が現在時間軸のCCIのシグナル。赤の三角がMTF CCIのシグナルです。

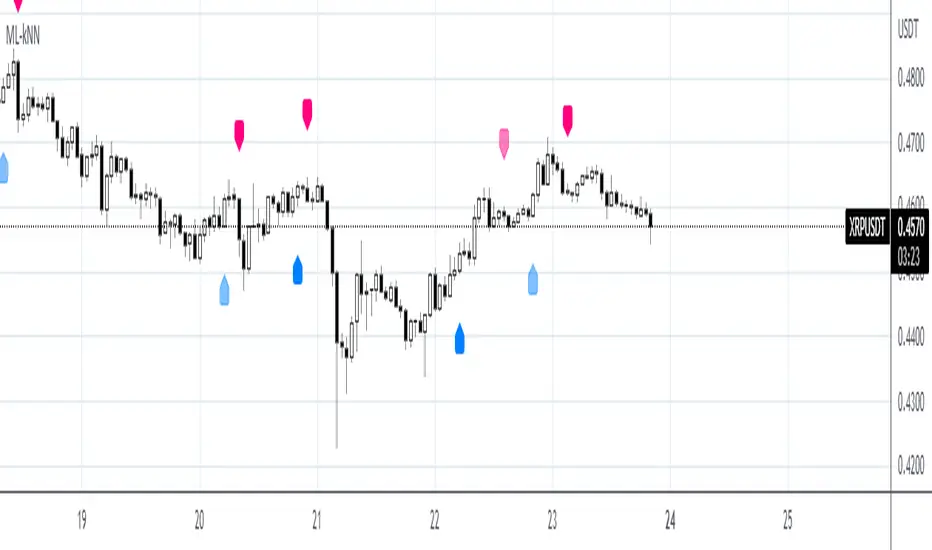
Machine Learning: kNN-based Strategy (update)kNN-based Strategy (FX and Crypto)
Description:
This update to the popular kNN-based strategy features:
improvements in the business logic,
an adjustible k value for the kNN model,
one more feature (MOM),
a streamlined signal filter and
some other minor fixes.
Now this script works in all timeframes !
I intentionally decided to publish this script separately
in order for the users to see the differences.

Trend MagicTrend Magic is originally a MT platform (MetaTrader) indicator and it can be used with any forex trading systems / strategies for additional confirmation of trading entries or exits. Converted the MT platform code to TradingView Pine version 4. Also you can use Multiple Time Frame.
It also works well with Crypto and Stock Markets.
Trend Magic consists of two main calculation parts as momentum and volatility:
First part is ATR based (like ATR Trailing Stop) logic, second part is all about CCI which also determines the color of Trend Magic.
Blue: when CCI is positive
Red: when CCI is negative
Also added alert condition regarding price crosses :
when LOW CrossesAbove TM
and HIGH CrossesBelow TM
Enjoy
Kıvanç Özbilgiç

The WWG Plan Indicator V2█ OVERALL
This indicator was specifically created for the Walsh Wealth Group.
In short it is a fusion of some of the most basic and widely used indicators to show overbought patterns and trend reversals.
Its best usage is with LTF scalping and agressive profit taking but can also be used to find HTF dips and buy-zones.
█ FEATURES
Buy Signal (Buy):
Printed only with all confirmations triggered
Small Buy Signal (B1 & B2)
Printed if some of the confirmations are triggered and can be treated as DCA entries or for further
confirmation with other indicators and basic TA.
Crayons (Color Bars):
Blue: RSI is oversold
Olive: RSI and Stoch RSI are oversold
Yellow: RSI, Stoch RSI are oversold and lower Bollinger Bands are crossed by Low
Orange: RSI, Stoch RSI and CCI are oversold
Trailing SL:
If activated in the config, a trailing SL can be displayed on the chart based on ATR.
█ SETTINGS
The underlying indicators used are RSI, Stoch RSI, Bollinger Bands, MACD and CCI.
All possible configs can be changed in the config settings.
█ GENERAL INFORMATION
Depending on the settings, the indicator performance will be highly affected.
This indicator is only displaying highly oversold areas and events of trend reversal it is not a *God*-Signal and will print false positives.
█ ALERTS
An alert for the main buy-signal is implemented and can be used via the TV alert functionality.

StochRSI x RSI x CCI x EMAsWanted to put this out there. Kind of a rough explanation but basically I wanted to build an indicator that takes out emotions and is easy to read. The indicator is basically RSI, stochRSI, CCI, and EMAs into an easy to read package. The traffic lights at the end will tell you if stochRSI/RSI and price action above according to EMA ribbon are in agreement. RSI with a period of 2 also always seemed very useful to me but it was just extremely distracting to look at it. I tried to make many rules in this indicator to find as much confluence between RSI, stochRSI, CCI, and EMAs to help you make better decisions. What is shown on the indicator is not necessarily a buy/sell signal. It should be seen as a way to view strength of price and possible momentum changes.
I find that one of the biggest distractions of indicators is taking your eyes off what is really happening at the chart above. This indicator uses popular and well used tools and helps you to get an easier visual of what is happening.
Purple lines at top and bottom: Short RSI ob/os
Red/orange and blue/green lines at top and bottom: When stochRSI kd and CCI also crosses +/- 100 or 200
Blue background: when stochRSI k > d and short RSI crosses above 30
Red background: when stochRSI k < d and short RSI crosses below 70
Green crosses: StochRSI is above 80 and making higher highs
Red X crosses: StochRSI is below 20 and making lower lows
Red/green fill of stochRSI and purple/blue dots on RSI: When short RSI and stochRSI are both ob/os
Red/green fill of RSI: Green when Long rsi > 50, red when Long rsi < 50
60/40 lines: Possible support/resistance for RSI
Traffic lights
1st light: Long RSI > EMA and stoch RSI k>d or vice versa
2nd light: Price above EMA 1 and 2 or vice versa
3rd light: when lights 1 and 2 are in agreement
Hope you enjoy!

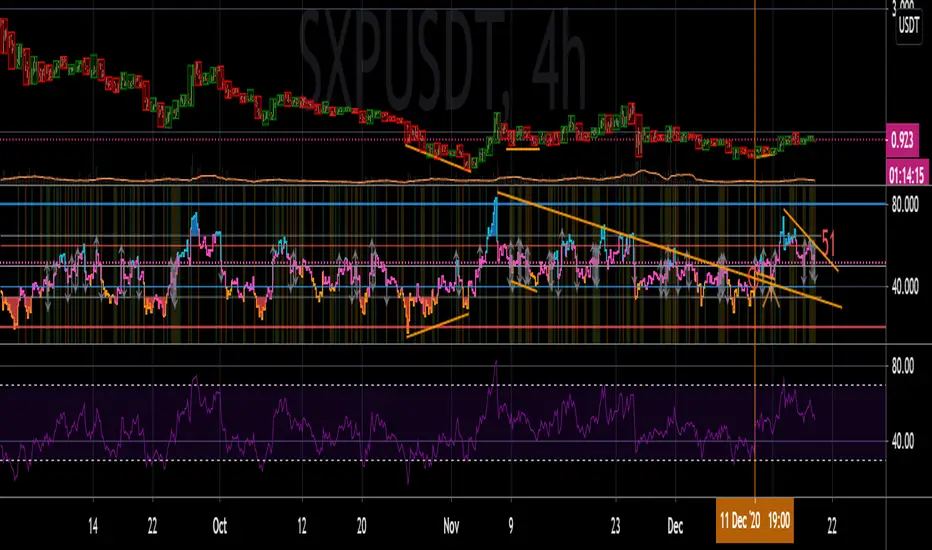
SRSI/CCI :: ALLinPower v10.0
Everything you see in this indicator has beed designed with purpose to ease your trading with visual technical analysis of the market. It pulls data from 7 different TimeFrames and it can not be more simpler visual representation of its calculations when applied on chart.
When applied on chart, you will see two sets of WAVES. First set is made out of SRSI calculation and the second is made out of CCI calculation. Both of them follows the same rules.
Background GREEN/RED wave is made out of Multiple Timeframes and it represents a TREND. GREEN for LONG, RED for SHORT trend.
Over the background wave there is a wave made of current TimeFrame data and its main purpose is to see when the POWER of certain direction will diminish. The less time little wave stays in current trend the more likely is that it will change the trend based on lack of power the market is getting in certain direction.
HOW TO USE IT?
Rule 1.
TIMEFRAMES
Choose the best TimeFrame for the job. I use: 1min, 2min, 3min, 5min, 8min, 13min, 21min, 34min or 56min (golden ratio). You can also pick a different TF but only to up to 1h TF chart as it does not work well with TF over 1h. Smaller TF is used for SCALPING of DAY TRADING higher TF is used for SWING TRADING. You get the picture?
Rule 2
TO ENTER BUY/LONG POSITION: When big trend wave is below the middle line and coloured in RED and little wave just entered the area and exits it very soon after. Basically when RED straight line gets smaller and smaller (the POWER of SHORT diminishes) it is a sign for LONG.
TO ENTER SELL/SHORT POSITION: When big trend wave is over the middle line and coloured in GREEN and little wave just entered the area and exits it very soon after. Basically when GREEN straight line gets smaller and smaller (the POWER of LONG diminishes) it is a sign for SHORT.
To ease yourself the spotting of this instances just follow the GREEN/RED dots and use ALERTS (choose BUY POWER for LONG signals or choose SELL POWER for SHORT signals) to make yourself free from staring at a computer/mobile all the time and just wait for a signal.
Rule 3
CAUTION
Do not rush to enter a position and try to predict what indicator will do next. It does not end well.
Be aware you are not exiting a position in panic that would be too soon or even worse, you get married to bad trade and you are not exiting even though you should exit by many signals you get.
Use risk management strategy to protect your capital.
Follow the rules and make your trading easier and better.

Machine Learning: kNN-based StrategykNN-based Strategy (FX and Crypto)
Description:
This strategy uses a classic machine learning algorithm - k Nearest Neighbours (kNN) - to let you find a prediction for the next (tomorrow's, next month's, etc.) market move. Being an unsupervised machine learning algorithm, kNN is one of the most simple learning algorithms.
To do a prediction of the next market move, the kNN algorithm uses the historic data, collected in 3 arrays - feature1, feature2 and directions, - and finds the k-nearest
neighbours of the current indicator(s) values.
The two dimensional kNN algorithm just has a look on what has happened in the past when the two indicators had a similar level. It then looks at the k nearest neighbours,
sees their state and thus classifies the current point.
The kNN algorithm offers a framework to test all kinds of indicators easily to see if they have got any *predictive value*. One can easily add cog, wpr and others.
Note: TradingViews's playback feature helps to see this strategy in action.
Warning: Signals ARE repainting.
Style tags: Trend Following, Trend Analysis
Asset class: Equities, Futures, ETFs, Currencies and Commodities
Dataset: FX Minutes/Hours+++/Days
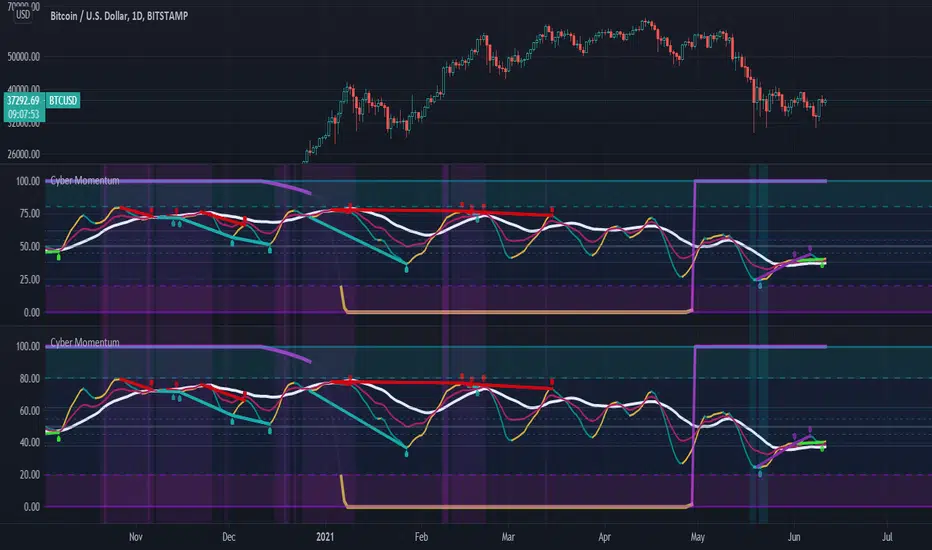
Cyber Momentum V2This Oscillator is another version of my previous Oscillator Cyber Momentum … in this version the CCI formula added to the core calculation therefore there is small differential behavior rather than Cyber Momentum because of different calculation methods …
But both of them are in the same concept; the most optimized signals are those that are in confluence of Cyber Momentum and Cyber Momentum V2 ...

Cyber MomentumThis oscillator is the combination of different settings RSI , RSX , STOCHRSI , MSI ,... in a Stochastic function that can help traders to understand the weakness and strength of momentum in candle sticks in different time frames.
This oscillator organized by three Line , control zone and Divergence Line
1:) Fast Line
2:) Slow Line
3:) Heavy Line
4:) Neutral Zone between Fibo 38.2% & 61.8%
5:) Bullish Control Zone
6:) Bearish Control Zone
7:) Divergence Line
And there are two theories of finding tradable signals behind those parts .
The first and the most simplest theory is the situation that the Fast Line has the possibility to be supported by Slow or Heavy Lines and basically reverse its slope !!
But there are some rules and notes for this theory ... First of all the accuracy and rate of that is variable in three main categories of situation
1:) with or without price action reversal structure like reversal pattern (Head&Shoulder , Quasimodo , .... )
2:) with or without regular divergence
3:) in which control zone ?
So basically the most powerful setup occurs when price action is already in the reversal structure and the potential to have at least one drive of regular divergence exist and also the Fast Line is in the opposite control zone of the current time frame trend .... so obviously if one of those rules will not be satisfied so the signal will be the less value
The second theory is the signals that occur after the reversal, obviously a sign of trend continuation. there are two type of that you can use with this oscillator
The first one happens when price reverses its trend and this oscillator is moving to the neutral zone ... so if at least one drive of hidden divergence exist the neutral zone will have good possibility to reverse the slope of the oscillator obviously this would happen usually after hidden divergence confirmed .
and the second one is basically the first type but after the reversal Subsequently in the outside of the bullish/bearish control zone ... those kinds of signals are NOT the reversal potency signal at all !! they designed for trend continuation... be careful of them and try trade with your old friend trend ! .... also The existence of hidden divergences will be better for trade in this kind of signals .
The idea of this oscillator was inspired by @mrhashem Borjas Tarh Momentum.
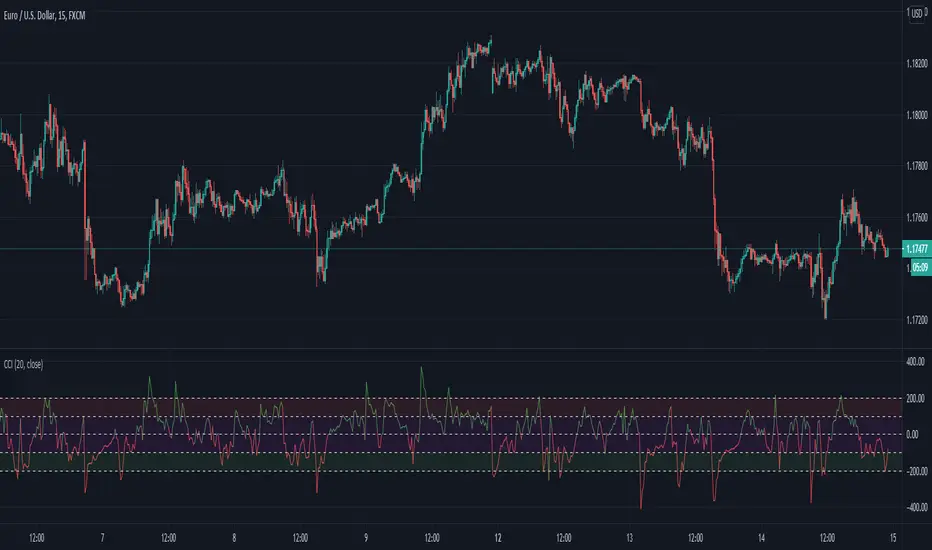
CCI colored RSIKnowing how to write code will hopefully be my saving grace with trading. Regardless, I have things to learn yet and the CCI indicator seems to get a lot of respect from chart-art minimalists.
On Investopedia, it says, “The CCI compares the current price to an average price over a period of time. The indicator fluctuates above or below zero, moving into positive or negative territory. While most values, approximately 75%, fall between -100 and +100, about 25% of the values fall outside this range, indicating a lot of weakness or strength in the price movement”
So I decided to have the regular RSI colored with information from the CCI that I just learned about. RSI color changes depending on whether or not the CCI was extended beyond the –100 and 100 extremities, as this indicates trend strength, and helps to not exit a trade early. Arrows are drawn for when the CCI crosses the 0 point of the CCI, which if overlaid, is the 50 on the RSI.
I have also added the option of having the background shaded according to CCI signals. Crosses OVER the –100 and 100 are the early and late bullish signals, while crosses UNDER the –100 and 100 are early and late bearish. I added to the RSI according to how Investopedia says to trade the CCI here.
www.investopedia.com
I added lines to the RSI to delineate the zones that Constance Brown talks about in her work with the RSI.
I kept the code simple to demonstrate my process, editing out lines instead of deleting, etc. I hope it helps somebody new to programming in Pine Script be able to hop right in.
Happy Turkey Day! Gobble Gobble. Say “Gobble Gobble” out loud. Do it.
Edit: Gratuity options removed. Try not to support terrorism this holiday season. And ffs turn off that race-baiting fact-destroying humanity threatening trash on your tv. We fight terrorism all day up in this mf. Savin stupid hoes and everything. Because it's the right thing to do. Not because Soros said so and paid TradingView enough.
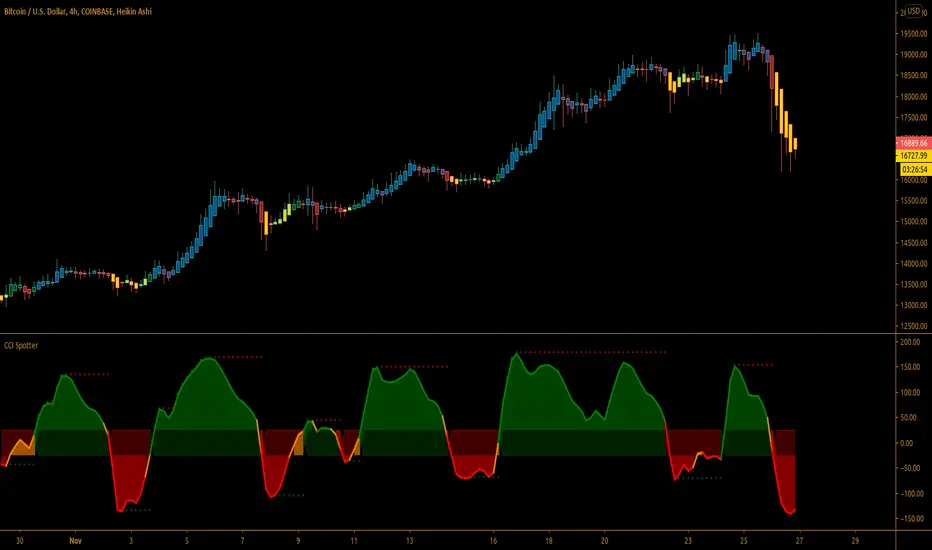
Simple CCI Spotter™TradeChartist Simple CCI Spotter is an elegant version of the classic CCI indicator and helps spot price trends using visually engaging and appealing CCI plot and background. The Bull and the Bear background fills are highly useful for traders who like to visually understand areas of entry and exit based on CCI .
===================================================================================================================
What does Simple CCI Spotter do?
Plots CCI with visually engaging colours for Bull and Bear zones (Green and Red) with optional background fill.
Plots CCI coloured bars on main chart based on user preferred Upper and Lower CCI bands (Default - 25/-25).
Plots CCI based on EMA smoothing (1 for Regular CCI without smoothing).
Plots Heikin Ashi CCI if enabled from indicator settings.
Plots CCI highs of Bull Zone and RSI lows of Bear Zone. Helps visually spot divergences.
===================================================================================================================
Note:
Default Settings:
5 period EMA Smoothed CCI .
For Heikin Ashi CCI on normal bars, enable ᴜsᴇ ʜᴇɪᴋɪɴ ᴀsʜɪ ᴄᴄɪ and change EMA CCI sᴍᴏᴏᴛʜɪɴɢ to 1.
===================================================================================================================
ALLinDivergence v12.60 :: PinPoint BUY/SELL OpportunitiesEasy to spot BUY/LONG or SELL/SHORT ENTRY POINT opportunities.
Just follow this 9 RULES!
Rule 1. ONLY THINK OF GETTING IN A POSITION when BackgroundWave is coloured GREEN and ON POSITIVE SIDE of Flat White Line
Rule 2. ONLY THINK OF GETTING IN A POSITION when BackgroundWave is coloured RED and ON NEGATIVE SIDE of Flat White LineRule
Rule 3. ENTER BUY POSITION (Same Direction) when HigherHighs of MiniWave are coloured GREEN and they are getting BIGGER - needs to be confirmed with RULE 1.
Rule 4. ENTER BUY POSITION (Change) when LowerLows of MiniWave are coloured RED and they are getting SMALLER - needs to be confirmed with RULE 2.
Rule 5. ENTER SELL POSITION (Change) when HigherHighs of MiniWave are coloured GREEN and they are getting SMALLER - needs to be confirmed with RULE 1.
Rule 6. ENTER SELL POSITION (Same Direction) when LowerLows of MiniWave are coloured RED and they are getting BIGGER- needs to be confirmed with RULE 2.
Rule 7. Draw DIVERGENCE TRENDLINES on HIGHS or LOWS to ease your "spotting capabilities" and to be able to set up whatever ALERT you need
Rule 8. IF NOT SURE - CLOSE THE POSITION
Rule 9. DO NOT BE GREEDY - FOLLOW THE PLAN, whatever it is - but definitely THE PLAN SHOULD EXIST)
TIP:
1. First choose your favourite TimeFrame (mine is 30min) and draw all the Lines you need for better preview of the situation and LOCK them (believe me!:)
2. After some move (BUY/SELL) is just about to get confirmed on 30min TF, you can go on lesser TF (i usually analyze 1min, 3 min, 9 min and 15 min) down to TF that its GREEN/RED waves still makes sense (does that makes sense?)
3. On smaller TF you will get confirmation faster but sometimes they are more unreliable than in bigger TF. But if it aligns with a confirmation from 30min TF than i guess it should be OK to judge a bit early:)

Improved Commodity Channel IndexI took the normal CCI version and I made it better and more pleasantly visual.
At the same time now the CCI changes color based on the direction is going to take
We also have more levels, to define even better the current situation.
Details are simple :
green color cci = uptrend - > buy
red color cci = downtrend - > sell
Ehlers Adaptive Commodity Channel Index V1 [CC]The Adaptive Commodity Channel Index V1 was created by John Ehlers (Rocket Science For Traders pgs 236-237) and this is the typical Commodity Channel formula with the introduction of adaptive lengths based on his earlier work with indicators such as the Mother of Adaptive Moving Averages. For longer term signals you would get a bullish signal when CCI is above 0 and a bearish signal when CCI falls below 0. For shorter term signals you would get a bullish signal when crosses over it's overbought level or when it crosses above it's oversold level or vice versa. I have included both signals to make it easier.
Let me know if you want a custom script written or if you have a special request for me

CCI Strategy v2This was a strategy I found based on MT4. It takes CCI readings, then transforms them into a weighted moving average illustration. This is represented as:
Red Line - A six period moving average taken from CCI (NOT PRICE)
Green Line - A sixty-six period moving average taken from CCI (NOT PRICE)
Blue Line - CCI plotted
I have also added some levels and bollinger bands to highlight changes in activity.
The strategy is:
BUY - When the red line crosses upwards over green line.
SELL - When the red line crosses downwards over green line.
Extra confirmation is available by watching the blue line, it should be above red to buy, below red to sell. If the blue line drops in the opposite direction, this may be an opportunity to buy on a pull back.
If you wish for any modications to be applied, please do not hesitate to contact me.

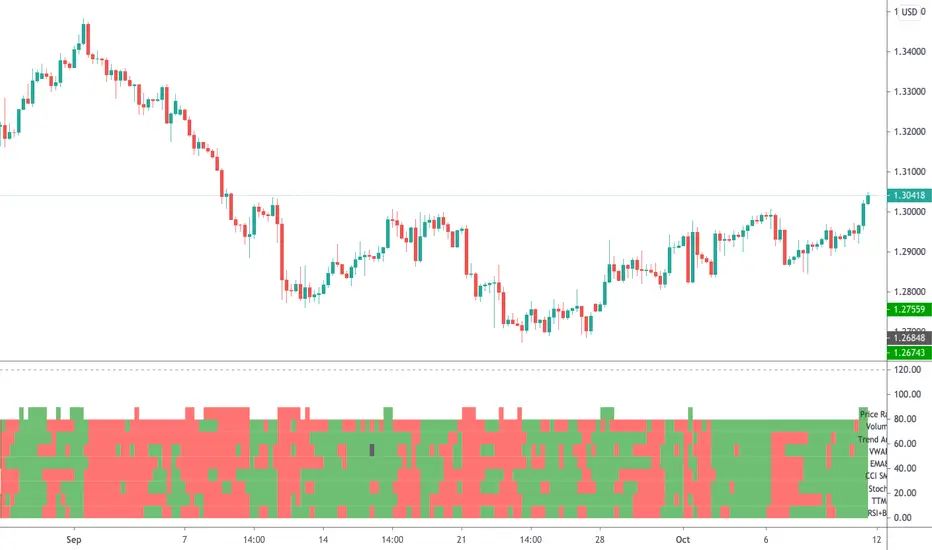
Radar Screen v3This is a combination of various indicators that very rarely conflict, thus giving us a good understanding:
- "Price Rally" detecting whether price is rallying, giving us confidence it will continue.
- Volume - knowing volume is going with the trend is a good confidence check.
- Trend Angle - This will go red or green depending on whether the price angle is going up or down, taken over three bars.
- VWAP for all of these stock traders.
- EMA8 is a very sensitive moving average, good for short term trades.
- CCI SMA is a strategy I commonly use, please check out my other indicators for a functional description.
- Stochastics is used throughout many systems.
- RSI BB shows where price is rebounding of the bollinger band and then moving up or down.
As per all of my indicators, the system is simple - The more green lines you see, the stronger the buy signal. The more red lines you see, the stronger the sell. If its a 50/50 mix of red and green, then don't trade.
I can customise this further or add other strategies, please message me.
CCI & EMA_CROSS_PaydarCCI & EMA_CROSS_Paydar
Hello everyone
This indicator is actually a very efficient oscillator,
This system is a unique combination of indicators CCI and EMA, which of course has special settings, these settings are adjusted as much as possible due to signaling.
As you can see in the picture:
CCI: the two colors line, green and red, are actually the same indicator CCI that I set to 20.
*Note that in index CCI I have set the lines +100 and -100 to +75 and -75 for less error and a stronger signal to sell or buy.
EMA: The white line, which is in the form of steps, is in fact the same indicator of EMA, which I have considered as a value of 9.
_________________________________________________________________________________________________________
Instructions
-> areas:
Zone +75 to +200 = positive range or incremental price or bullish
Zone +75 to -75 = Neutral range or almost constant price (no fluctuations or very wet fluctuations)
Zone -75 to -200 = single range or discount price or bearish
->How to use:
Buy = In the bearish range, if line CCI intersects line EMA upwards and goes to the neutral zone.
None = if the index (or index lines) collide in the neutral zone
Sell = In the bullish range, if line CCI intersects line EMA down and goes to the neutral zone.
-> Please comment on this system or if you have a good experience in changing the values of the indicators or it seems to you, please share.
With great respect to:
Who had published the main idea of this system.
