The Consolidator [Pattern Foresight]Overview
This Consolidator script uses detection logic to chart bullish and bearish consolidation markers and to chart shaded high/low price range lines (with green shading between the bottom range line and the price for bullish trends and with red shading between the top range line and the price for bearish trends). A consolidation point is telling you: “Price has gone quiet here. Expect expansion—likely a breakout—once volume returns.” Low volatility squeezes often lead to a breakout.
The Consolidator attempts to identify periods where the price is moving sideways, compressing into a tighter range, forming a base or coil, or preparing for a trend continuation or reversal.
Bullish Consolidation Markers - Bullish consolidation occurs when the price is coiling but buyers are in control. These are useful to help detect bull flags, ascending triangles, tight bases before breakouts.
Bearish Consolidation Markers - These are useful to help detect bear flags, descending triangles, distribution periods.
Why this indicator is unique
The Consolidator attempts to be a predictive pattern-recognition system, not a simple channel indicator by measuring consolidation tightness and high/low price ranges. The range lines help visualize the “coil” where price is compressing. Consolidation markers classify which side of the coil price is leaning toward: bullish pressure or bearish pressure. The script attempts to detect structural bullish patterns with breakout intelligence.
Usage
Consolidation Lookback - Controls how many bars are examined when determining the consolidation “box.” Think of it as: “How wide of a window do you want to search for a sideways range?” Shorter lookback (10–20): Tighter, more sensitive consolidations, faster signals, more false positives, and useful for scalping and day trading. Longer lookback (30–60): Larger, more stable consolidation zones, fewer false positives, and better for swing trading.
Tolerance Percent - Defines how “flat” highs/lows must be to qualify as consolidation. This is the key part of compression detection. Lower tolerance (0.3–0.6%): Only very tight ranges qualify with fewer but higher-quality consolidation zones. Higher tolerance (0.7–1.5%): wider ranges and more consolidation signals. Small changes to tolerance drastically change the number of consolidation markers (higher = more consolidation markers).
Disclaimer:
This script is for informational purposes only. Nothing contained herein should be construed as financial, investment, or trading advice. The author is not a financial advisor and is not providing personalized recommendations. All trading involves risk, including the potential loss of principal. The author makes no assurances of accuracy, performance, or future results. History may not reflect future performance. You are solely responsible for your own investment decisions and agree to use this script entirely at your own risk.
COIL

PCCE + False Breakout DetectorPCCE + False Breakout Detector
Type: Invite‑Only Indicator (closed source)
Purpose: Identify volatility compression (“coil”) and the first expansion after it, while filtering failed breakouts (bull/bear traps).
What it does — in plain language
This tool unifies two complementary behaviours that often appear back‑to‑back around strong moves:
1. Price Coil Compression & Expansion (PCCE) – finds compact ranges created by shrinking candle bodies, wick dominance, and contracting range relative to recent history. When price expands out of that coil with strength, it prints a Burst↑ / Burst↓ label.
2. False Breakout Detection – monitors recent swing extremes. If price closes beyond a prior high/low but re‑enters that range within a short window, it marks a trap (❌ red for failed bullish breakout, ❌ green for failed bearish breakout).
Why combine them?
PCCE tells you where the next move is likely brewing; the trap filter validates whether the breakout is genuine or failing. Used together they turn raw breakouts into structured, risk‑aware opportunities.
How it works — concepts behind the calculations
1) Detecting “Coil” (compression)
• Body contraction: Count of consecutive bars where |close-open| is decreasing within a sliding window.
• Wick dominance: Average (upper wick + lower wick) / body must exceed a threshold → indecision/liquidity probing.
• Relative range: Current high‑low over the window must be smaller than the average of prior windows (tight market).
• Coil zone: When the above conditions align, the most recent high/low envelope defines the coil’s bounds.
2) Confirming “Burst” (expansion)
A breakout through the coil high/low is only labelled when:
• Body thrust: current body > moving‑average body × multiplier (large real body).
• Relative volume: volume > moving‑average volume × multiplier (participation filter).
• Trend alignment (optional): close vs EMA to avoid counter‑trend bursts.
• Cooldown: minimum bars between signals to reduce clustering.
Result: Burst↑ if closing beyond coil high with thrust; Burst↓ if closing beyond coil low with thrust.
3) Flagging failed breakouts (traps)
• Track recent swing high/low from a lookback excluding the current bar.
• If a bar closes beyond that swing but within N bars price closes back inside the swing range → flag a trap:
• Bull trap: ❌ red above bar (break above failed)
• Bear trap: ❌ green below bar (break below failed)
⸻
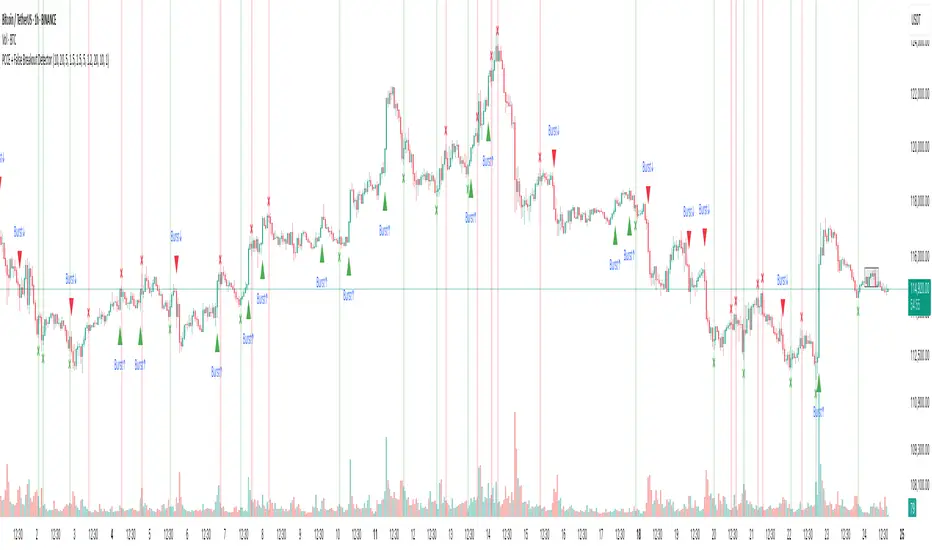
What you see on the chart
• Coil zone: a shaded box (tight range envelope).
• Burst labels: Burst↑ (triangle up) and Burst↓ (triangle down) at confirmed expansion bars.
• Trap markers: ❌ red (failed bullish breakout), ❌ green (failed bearish breakout).
• Alerts: “Burst Up”, “Burst Down” (fires on bar close only).
⸻
How to use it
1. Preparation : When a coil box forms, mark the zone and wait.
2. Trigger : A Burst label confirms the first expansion with thrust/volume; treat it as an entry cue only within your own plan.
3. Validation : If a ❌ trap appears shortly after a break, treat it as caution/exit info; the breakout is failing.
4. Context : Best on 15m–4H. Combine with higher‑timeframe bias, nearby S/R, and risk controls.
5. Parameters to tune :
• Coil window, wick‑to‑body threshold, and range tightness
• Body/volume multipliers
• EMA trend filter on/off
• Trap lookback and confirmation bars
• Cooldown bars
⸻
Originality & usefulness
• Behaviour‑first compression scoring: Coil detection blends monotonic body shrink, wick dominance, and relative range contraction—not generic bands or a single oscillator.
• Two‑stage discipline: A burst is not just any break; it requires body thrust + relative volume (+ optional trend) to reduce noise.
• Immediate invalidation layer: The trap filter is evaluated right after the burst context, turning breakouts into risk‑aware signals rather than blind entries.
• Operator controls: Cooldown + multipliers let traders adapt the strictness to instrument/session behaviour.
⸻
Repainting & limitations
• Signals are evaluated on bar close; no lookahead, no request.security() with lookahead_on.
• Coil boxes while forming can update until confirmed; Burst/Trap labels do not repaint after their bar closes.
• News spikes and illiquid hours can still create noise; adjust multipliers and cooldown for your market.
⸻
Disclaimer
This indicator is an educational decision‑support tool, not financial advice. Markets are uncertain; past behaviour does not guarantee future results. Use with your own analysis and risk management.
Coiled Moving AveragesThis indicator detects when 3 moving averages converge and become coiled. This indicates volatility contraction which often leads to volatility expansion, i.e. large price movements.
Moving averages are considered coiled when the percent difference from each moving average to the others is less than the Coil Tolerance % input value.
This indicator is unique in that it detects when moving averages converge within a specified percent range. This is in contrast to other indicators that only detect moving average crossovers, or the distance between price and a moving average.
This indicator includes options such as:
- % difference between the MAs to be considered coiled
- type and length of MAs
- background color to indicate when the MAs are coiled
- arrows to indicate if price is above or below the MAs when they become coiled
While coiling predicts an increased probability for volatility expansion, it does not necessarily predict the direction of expansion. However, the arrows which indicate whether price is above or below the moving average coil may increase the odds of a move in that direction. Bullish alignment of the moving averages (faster MAs above the slower MAs) may also increase the odds of a bullish break, while bearish alignment may increase the odds of a bearish break.
Note that mean reversion back to the MA coil is common after initial volatility expansion. This can present an entry opportunity for traders, as mean reversion may be followed by continuation in the direction of the initial break.
Experiment with different settings and timeframes to see how coiled MAs can help predict the onset of volatility.

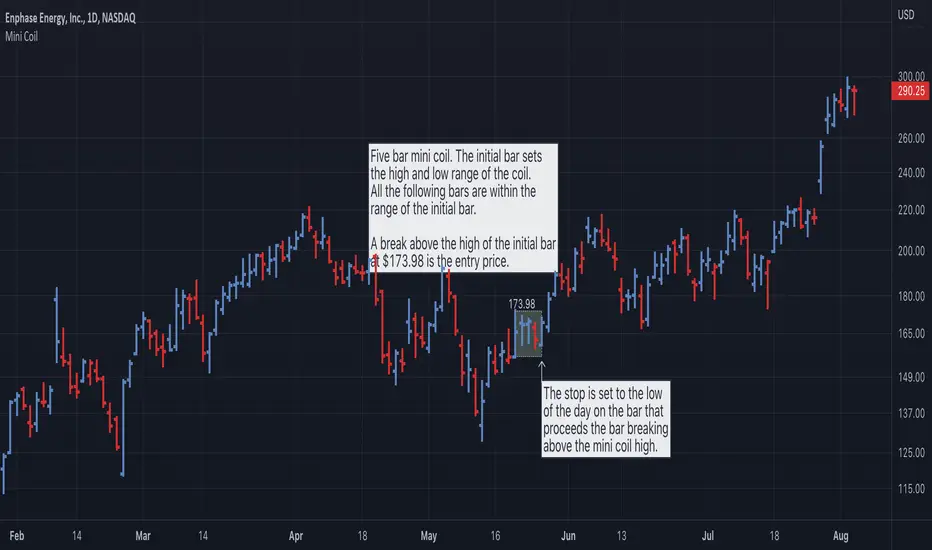
Mini Coil With Real Range [LevelUp]A mini coil is a low risk setup that can be used within a longer term pattern. The coiling action represents a tightening of volatility and is most effective when price is no more than 10-15% above a prior base.
The mini coil was created by Matt Caruso, @CarusoInsights, a professional investor and top performer in the 2020 US Investing Championship, finishing with a 346% return.
Mini Coil Setup
▪ Given an initial bar, at a minimum, two bars follow that don't exceed the high or low of the initial bar.
▪ The entry is when there is a break above the high of the initial bar.
▪ A common stop is the low of the last bar before the breakout.
Unique Features
▪ Real Range
When the initial bar open is a gap up greater than the previous bar close, when using the real range, the start of the mini coil is the close of the bar prior to the gap up. See the examples below for more information.
▪ Thresholds
During the formation of a mini coil, price may deviate slightly above or below the high or low of the initial bar. It can be helpful to set a threshold which allows for small percentage moves, above or below, yet still consider the price to be within the high/low range of the initial bar.
▪ Breakout Price
To help track the potential breakout price, there is an option to show the high of the initial bar.
Mini Coil Examples
DDOG - Real Range
AAPL - Historical Mini Coils
AMD - Real Range and Threshold %