Highlight monday and friday with price actionSimple script to show you mondays and fridays and to show you the current open and previous close price plus current close on the candle you are sitting on.
I use this script to back test options strategies, and to look for major price divergence.
This is meant to be used on day candles.
Close

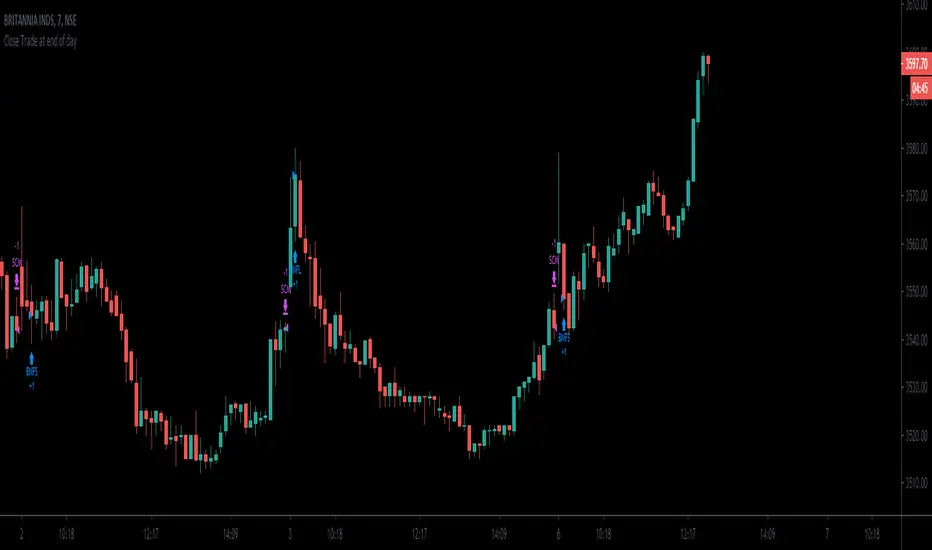
Close Trade at end of day script serves as an example how we can close trades at end of day.
can be session controlled or the time controlled.
the session should be adjusted to be earlier than the candle time.
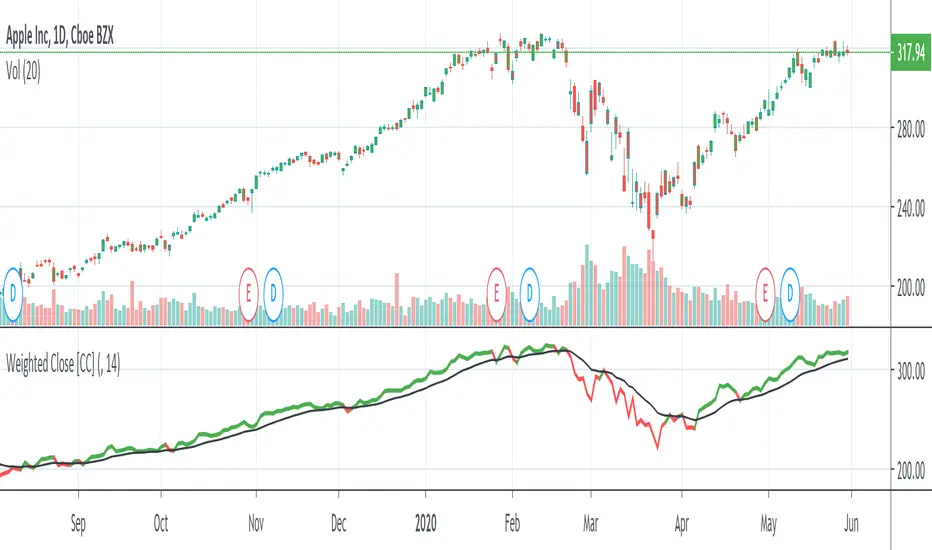
Weighted Close [CC]The weighted close isn't an option for an input yet on TV so here is my contribution. It gives more weight to the close prices and I have included a signal line to look for buy and sell signals. Buy when the indicator goes over its signal line and sell when it falls below it.
This was a special request so let me know what other scripts you would like to see me publish or if you want something custom done!
Higher and lower close indicatorSome strategies depend on a higher or lower close than the previous bar's close. With lower time frames and small bars, this can be time consuming. The indicator reduces the time for such decisions by colour indicating the condition. A higher close than the previous bar is denoted by a green dot at the bottom of the screen, red for a lower close and blue for an equal close.
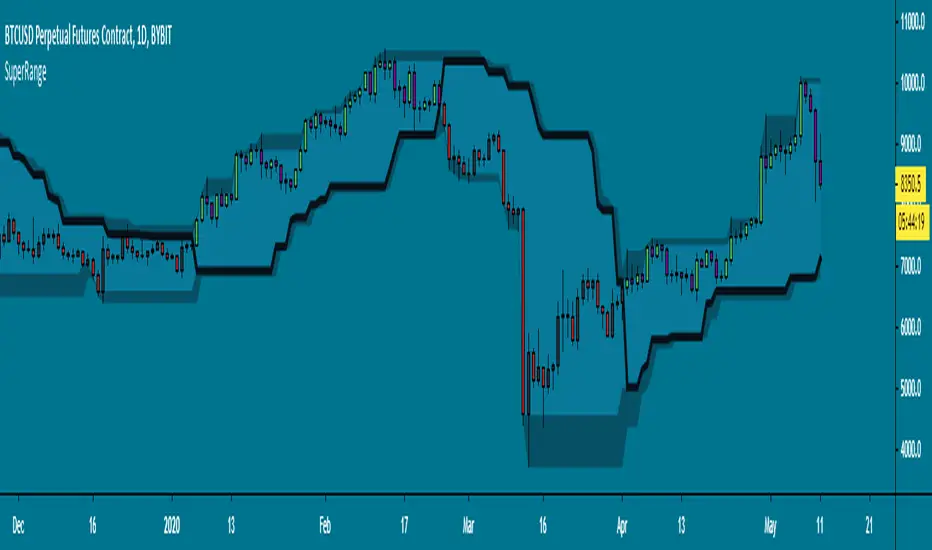
SuperRange - evoA SuperTrend like indicator based on highest and lowest candle close from a few bars back. It looks almost the same as Donchian Channels but with a dominant trend direction inside (Black line).
Uptrend: Candle closed higher than highest close
Downtrend: Candle closed lower than lowest close
This works best on higher time frames since a daily close is more powerful than a 15 minute close.
A few examples how you could use this:
Use support & resistance
Apply a moving average
Buy and sell the break-out
All perfect world examples, this does not happen all the time off course.. Its just for the idea. There are many ways to trade this so feel free to share in the comments, good luck and follow the trend! :)
Monthly MA Close Generates buy or sell signal if monthly candle closes above or below the signal MA.
Long positions only.
Inputs:
-Change timeframe MA
-Change period MA
-Use SMA or EMA
-Display MA
-Use another ticker as signal
-Select time period for backtesting
This script is not necessarily written to maximize profits, but to minimize losses.
Although it can outperform 'Buy & Hold' on some occasions when there is a multiple month bearisch trend.
You can optimise this strategy by changing the signal MA inputs.
I would suggest aiming for the best Profit Factor starting from the monthly ("M") setting.
You can always fine-tune the results at a lower timeframe.
The option to use another ticker for providing signals can give you a more stable and unified results.
For example using AMEX:SPY as signal with default parameters gives better results with NASDAQ:AAPL than if you would use NASDAQ:AAPL itself.
I used the anti-repainting function from PineCoders to prevent repainting.
This script is best used for multi-month trading positions & Daily or 4H setting of your chart.

NSDT Daily Gap RangeSimple script that plots the range between the previous day close and the current day open. This makes it easier to reference the gap up or gap down zone throughout the day.

Highlight Last Bar of: D | W | M | Hour| H4 | MinutesSimple script highlighting a vertical line on the last bar of the Day/ Week/ Month/ Hour/ H4/ minute etc.
Helps maintain visibility of higher timeframes when on lower timeframes.
Quickly identify end of period levels.
D/W/M/Y OpenThis is just a small Script
It show you:
Low and high of
Yesterday, last week, last month and last year
+
Open today

Yearly OHLplots Yearly Open, High, Low levels
Interesting interactions to note at previous yearly opens

Candle OpenerIllustrates open and close of the superior candles; the timeframe is choosable from pulldown menu.
Label shows the price of the open and indicate chosen superior candle's status (bull/bear) according to the current close.
インジケーターの設定ドロップダウンメニューから上位足の始値と終値をスイッチングできるので、タイムフレームを跨がずに現在足からラインを引くことができます。表示した上位足の始値を示すラベルは、当該足が陽線か陰線かによって色が反転します。
ライントレードの補助用インジケータとしてご利用ください。

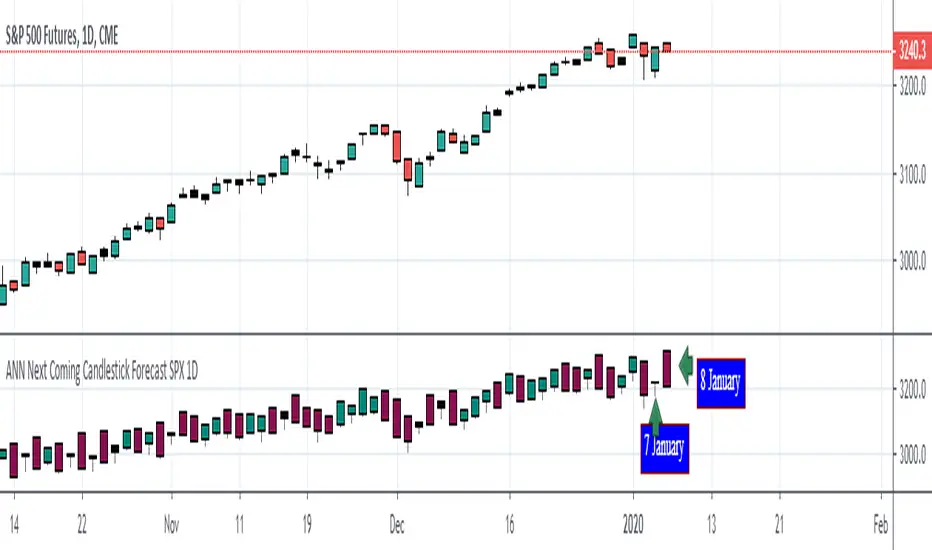
ANN Next Coming Candlestick Forecast SPX 1D v1.0WARNING:
Experimental and incomplete.
Script is open to development and will be developed.
This is just version 1.0
STRUCTURE
This script is trained according to the open, close, high and low values of the bars.
It is tried to predict the future values of opening, closing, high and low values.
A few simple codes were used to correlate expectation with current values. (You can see between line 129 - 159 )
Therefore, they are all individually trained.
You can see in functions.
The average training error of each variable is less than 0.011.
NOTE :
This script is designed for experimental use on S & P 500 and connected instruments only on 1-day bars.
The Plotcandle function is inspired by the following script of alexgrover :
Since we estimate the next values, our error rates should be much lower for all candlestick values. This is just first version to show logic.
I will continue to look for other variables to reach average error = 0.001 - 0.005 for each candlestick status.
Feel free to use and improve , this is open-source.
Best regards.
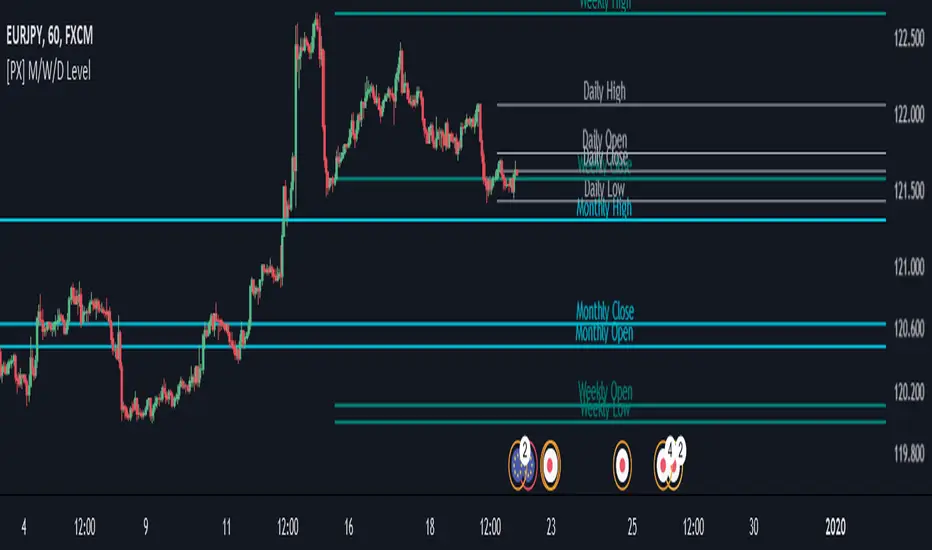
[PX] M/W/D LevelHey guys,
this script shows monthly, weekly and daily OHLC data represented as horizontal level.
I tried to make it as user-friendly as possible. Therefore, you can add different colors and styles for each level, as well as turn them on and off.
With the "Label Offset" -parameter you are in control where the label text should appear. You can shift it from left to right and vice-versa. To shift it to the left choose a negative value. To shift it to the right use a positive one.
This best setting for me personally is the "Candle Selection" -dropdown. This allows you to decide wether you want to show the previous candles OHLC-data or the current live OHLC-data.
!!CAUTION!! If you use the "Current Month/Week/Day" -selection be aware that values shown are "live"-data of the current candle. Therefore, values will change the same way your chart keeps changing on live data.
The "Previous Month/Week/Day" -selection on the other hand is historical data and therefore only changes once we reached a new month/week/day.
If you like my work, consider leaving a like :)
Happy trading!
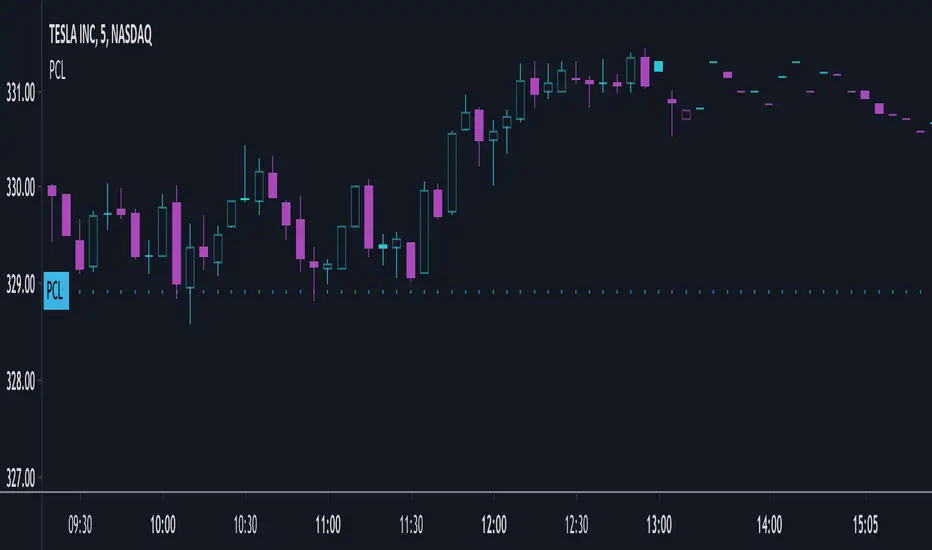
(PCL) Previous CloseI have recently been reading How to Day Trade for a Living by Andrew Aziz and one of the important support and resistance levels he talks about is the Previous Day Close Price.
I did not find an indicator that would simply plot this so I wrote a short simple pine script to plot the indicator.
Please feel free to edit or suggest improvements.
[AU] Open Close MidlineSimple open, close, midline indicator for 3D, W, M. Much less complex than Levels.
Candle (High/Low/Close)-MTF [Anan]
Hello Friends,,
This is just multi time frame candle plot (High / Low / Close) on your current chart resolution.

Previous OHLC LevelsQuick dirty code for personal use. Plots previous OHLC levels based on a selected time-frame on the chart.
Not bad if you want to see different time-frame levels.
Fill function can serve to highlight the daily range (high-low or open-close) on non-standard charts
Uses base code from JayRogers

Close-to-Close % Change DistributionThis is a graphical representation of things you see everyday in your watchlists - % Changes. This tool uses the entire history of an instrument. Different instruments have different distributions.
Oil
Gold
Bitcoin

OC indicatorIndicator to show previous open and close of a certain time frame.
Available timeframe :
H1
H4
Daily
Weekly
Monthly
You can disable previous option to show actual data but result will be 'weird' as it works on futur data (non closed candles).
When plotted, circle show open and cross show close. Color dependson the TF.

Support/Resistance Zones x3Support and Resistance Levels + Zones for 3 time frames, based on volume at fractal levels with Zones based on wick size which is a true reflection of a Zone when compared to other S/R Zone scripts which only use a thick line not based on anything.
Original script is thanks to synapticex I have just migrated to version 3, heavily modified it and added Support and Resistance Zones.

Pivot Points, Daily, Weekly, Open and Close lines What is a Pivot Point?
A pivot point is a technical analysis indicator, or calculations, used to determine the overall trend of the market over different time frames. The pivot point itself is simply the average of the high, low and closing prices from the previous trading day. On the subsequent day, trading above the pivot point is thought to indicate ongoing bullish sentiment, while trading below the pivot point indicates bearish sentiment.
The pivot point is the basis for the indicator, but it also includes other support and resistance levels that are projected based on the pivot point calculation. All these levels help traders see where the price could experience support or resistance. Similarly, if the price moves through these levels it lets the trader know the price is trending in that direction.
When the price of an asset is trading above the pivot point, it indicates the day is bullish or positive.
When the price of an asset is trading below the pivot point, it indicates the day is bearish or negative.
The indicator typically includes four additional levels: S1, S2, R1, and R2. These stand for support one and two, and resistance one and two.
Support and resistance one and two may cause reversals, but they may also be used to confirm the trend. For example, if the price is falling and moves below S1, it helps confirm the downtrend and indicate a possible continuation to S2.
This Script includes the Mid Pivot Points, Open and Close levels

Range: OHLC vs Previous OHLCThis will plot your choice of OHLC (or any of the averaging choices) of the current candle compared to the previous candle.
For example if you choose "high" for the input and set the chart to daily, you'll see the currently daily high vs the previous daily high.
Green candle represent a higher high and the length of the candle represents how much higher.
Red candles represent a lower high than the previous day and the length is by how much lower.
This indicator is pretty straight forward, look for me to build on this with something a little more elaborate in the near future.
