Candles Colored Green/Red According To Buy & Sell PressureCANDLES COLORED GREEN OR RED ACCORDING TO BUY & SELL PRESSURE
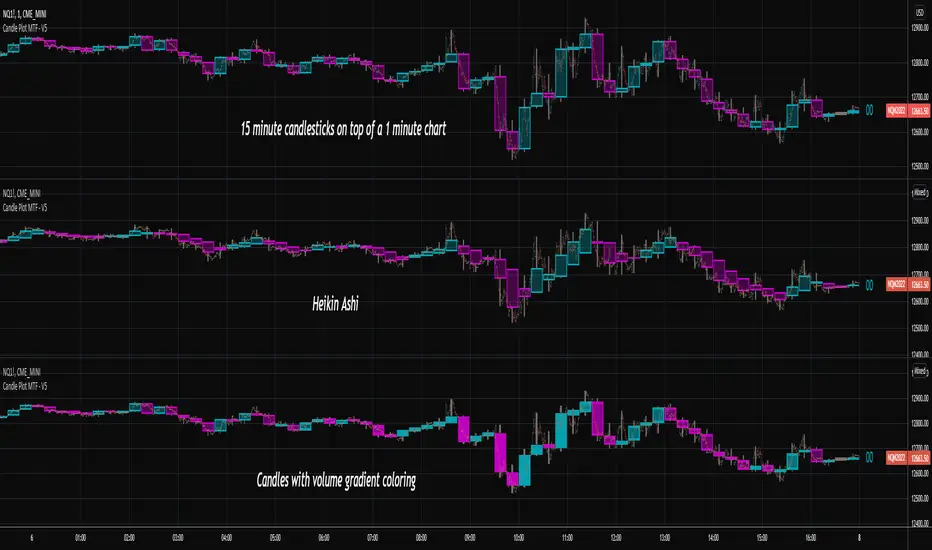
This indicator paints each candle green, red or blue depending on whether the buy/sell pressure for that candle is bullish, bearish or neutral.
***TURN OFF NORMAL CANDLE COLORS***
For this script to show properly on the chart, make sure you go to chart settings(gear icon in top right corner) and in the symbol tab, uncheck body, borders and wick.
***HOW TO USE***
When the directional movement index indicator shows more buying pressure than selling pressure, the candle will appear lime green. This indicates bullish buying pressure.
When the directional movement index indicator shows more selling pressure than buying pressure, the candle will appear red. This indicates bearish selling pressure.
When the directional movement index indicator shows the same amount of buy and sell pressure, the candle will appear blue. This indicates neutral buy/sell pressure.
Use the color changes to see if there is more buying or selling to pinpoint reversals and understand current market buying. Wait to enter or exit positions until the candles turn the opposite color.
***MARKETS***
This indicator can be used as a signal on all markets, including stocks, crypto, futures and forex.
***TIMEFRAMES***
This DMI color coded candlestick indicator can be used on all timeframes.
***TIPS***
Try using numerous indicators of ours on your chart so you can instantly see the bullish or bearish trend of multiple indicators in real time without having to analyze the data. Some of our favorites are our Auto Fibonacci, Directional Movement Index, Color Coded Buy & Sell Pressure Volume Profile, Auto Support And Resistance and Money Flow Index in combination with this Buy & Sell pressure Candle indicator.
Indicador Pine Script®