AnkeAlgo A68 strategy™ || AnkeAlgo®[16.6]## ✅ Multi-Timeframe Trend Strategy Based on MFI and Momentum Factors
### 📌 Overview
This strategy combines **Money Flow Index (MFI)** and **Momentum** to identify trend continuation and momentum reversal opportunities in the crypto market. It focuses on volume-weighted capital flow and price strength, generating trend-biased signals suitable for swing and intraday traders.
---
### 📊 Technical Indicators Used
| Indicator | Purpose |
|-----------|---------|
| **MFI (Money Flow Index)** | Detects capital inflow/outflow and filters range-bound markets |
| **Momentum Indicator** | Measures price acceleration and confirms breakout strength |
| **Optional: ATR / EMA Filters** | Can be added for volatility stop or trend validation |
---
### ⚙️ Core Logic
- **Trend Confirmation**: MFI exceeds threshold and aligns with price direction
- **Momentum Entry Trigger**: Trades are executed only when momentum crosses a signal level
- **Noise Filter**: Avoids entries when MFI divergence or momentum weakness is detected
- **Position Management**: Supports ATR-based or percentage-based stop-loss systems
---
### 🪙 Market and Asset
✅ Designed for crypto derivatives
**Recommended symbol:** `ETHUSDT.P` (Perpetual Futures)
---
### ⏱️ Recommended Timeframes
- 30-minute
- 45-minute
- 1-hour
> The **45m timeframe** shows the most stable performance in forward testing.
---
### 📈 Strategy Features
- Performs best during trending and high-momentum phases
- Low overfitting risk, adaptable across different volatility environments
- Can be used as a signal engine for grid, martingale, or multi-asset systems
- Easily extendable to BTC, SOL, BNB, and other high-liquidity assets
---
### ⚠️ Risk Disclaimer
- This is **not** a mean-reversion strategy and may produce false signals in sideways markets
- Stop-loss management and position sizing are required for live deployment
- Backtest results do not guarantee live trading performance due to slippage and trading fees
---
Candlestick analysis

Candle Breakout StrategyShort description (one-liner)
Candle Breakout Strategy — identifies a user-specified candle (UTC time), draws its high/low range, then enters on breakouts with configurable stop-loss, take-profit (via Risk:Reward) and optional alerts.
Full description (ready-to-paste)
Candle Breakout Strategy
Version 1.0 — Strategy script (Pine v5)
Overview
The Candle Breakout Strategy automatically captures a single "range candle" at a user-specified UTC time, draws its high/low as a visible box and dashed level lines, and waits for a breakout. When price closes above the range high it enters a Long; when price closes below the range low it enters a Short. Stop-loss is placed at the opposite range boundary and take-profit is calculated with a user-configurable Risk:Reward multiplier. Alerts for entries can be enabled.
This strategy is intended for breakout style trading where a clearly defined intraday range is established at a fixed time. It is simple, transparent and easy to adapt to multiple symbols and timeframes.
How it works (step-by-step)
On every bar the script checks the current UTC time.
When the first bar that matches the configured Target Hour:Target Minute (UTC) appears, the script records that candle’s high and low. This defines the breakout range.
A box and dashed lines are drawn on the chart to display the range and extended to the right while the range is active.
The script then waits for price to close outside the box:
Close > Range High → Long entry
Close < Range Low → Short entry
When an entry triggers:
Stop-loss = opposite range boundary (range low for longs, range high for shorts).
Take-profit = entry ± (risk × Risk:Reward). Risk is computed as the distance between entry price and stop-loss.
After entry the range becomes inactive (waitingForBreakout = false) until the next configured target time.
Inputs / Parameters
Target Hour (UTC) — the hour (0–23) in UTC when the range candle is detected.
Target Minute — minute (0–59) of the target candle.
Risk:Reward Ratio — multiplier for computing take profit from risk (0.5–10). Example: 2 means TP = entry + 2×risk.
Enable Alerts — turn on/off entry alerts (string message sent once per bar when an entry occurs).
Show Last Box Only (internal behavior) — when enabled the previous box is deleted at the next range creation so only the most recent range is visible (default behavior in the script).
Visuals & On-chart Info
A semi-transparent blue box shows the recorded range and extends to the right while active.
Dashed horizontal lines mark the range high and low.
On-chart shapes: green triangle below bar for Long signals, red triangle above bar for Short signals.
An information table (top-right) displays:
Target Time (UTC)
Active Range (Yes / No)
Range High
Range Low
Risk:Reward
Alerts
If Enable Alerts is on, the script sends an alert with the following formats when an entry occurs:
Long alert:
🟢 LONG SIGNAL
Entry Price:
Stop Loss:
Take Profit:
Short alert:
🔴 SHORT SIGNAL
Entry Price:
Stop Loss:
Take Profit:
Use TradingView's alert dialog to create alerts based on the script — select the script’s alert condition or use the alert() messages.
Recommended usage & tips
Timeframe: This strategy works on any timeframe but the definition of "candle at target time" depends on the chart timeframe. For intraday breakout styles, use 1m — 60m charts depending on the session you want to capture.
Target Time: Choose a time that is meaningful for the instrument (e.g., market open, economic release, session overlap). All times are handled in UTC.
Position Sizing: The script’s example uses strategy.percent_of_equity with 100% default — change default_qty_value or strategy settings to suit your risk management.
Filtering: Consider combining this breakout with trend filters (EMA, ADX, etc.) to reduce false breakouts.
Backtesting: Always backtest over a sufficiently large and recent sample. Pay attention to slippage and commission settings in TradingView’s strategy tester.
Known behavior & limitations
The script registers the breakout on close outside the recorded range. If you prefer intrabar breakout rules (e.g., high/low breach without close), you must adjust the condition accordingly.
The recorded range is taken from a single candle at the exact configured UTC time. If there are missing bars or the chart timeframe doesn't align, the intended candle may differ — choose the target time and chart timeframe consistently.
Only a single active position is allowed at a time (the script checks strategy.position_size == 0 before entries).
Example setups
EURUSD (Forex): Target Time 07:00 UTC — captures London open range.
Nifty / Index: Target Time 09:15 UTC — captures local session open range.
Crypto: Target Time 00:00 UTC — captures daily reset candle for breakout.
Risk disclaimer
This script is educational and provided as-is. Past performance is not indicative of future results. Use proper risk management, test on historical data, and consider slippage and commissions. Do not trade real capital without sufficient testing.
Change log
v1.0 — Initial release: range capture, box and level drawing, long/short entry by close breakout, SL at opposite boundary, TP via Risk:Reward, alerts, info table.
If you want, I can also:
Provide a short README version (2–3 lines) for the TradingView “Short description” field.
Add a couple of suggested alert templates for the TradingView alert dialog (if you want alerts that include variable placeholders).
Convert the disclaimer into multiple language versions.

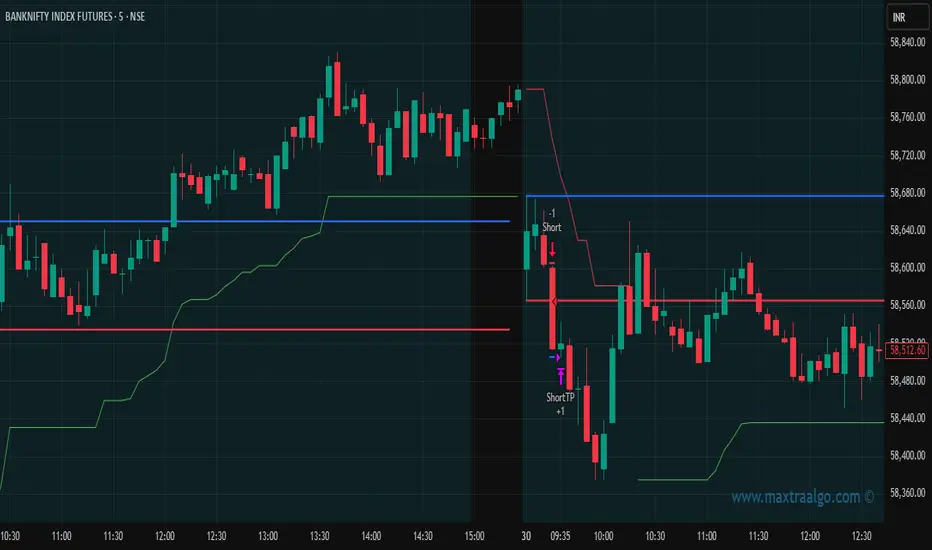
Maxtra Reversal Range Breakout StrategyReversal Range Breakout Strategy
This strategy uses the first candle as a directional filter. If the first candle is green, it anticipates a potential reversal and takes sell trades only. If the first candle is red, it looks for buy opportunities. The logic is to trade against the initial move, expecting a reversal after the early breakout or momentum spike.

Maxtra Range Breakout StrategyRange Breakout Strategy
This strategy identifies periods of price consolidation (range) and enters trades when the price breaks above or below the defined range. A breakout above the range signals a potential uptrend (buy), while a breakout below indicates a potential downtrend (sell). It helps capture strong directional moves following low-volatility phases.
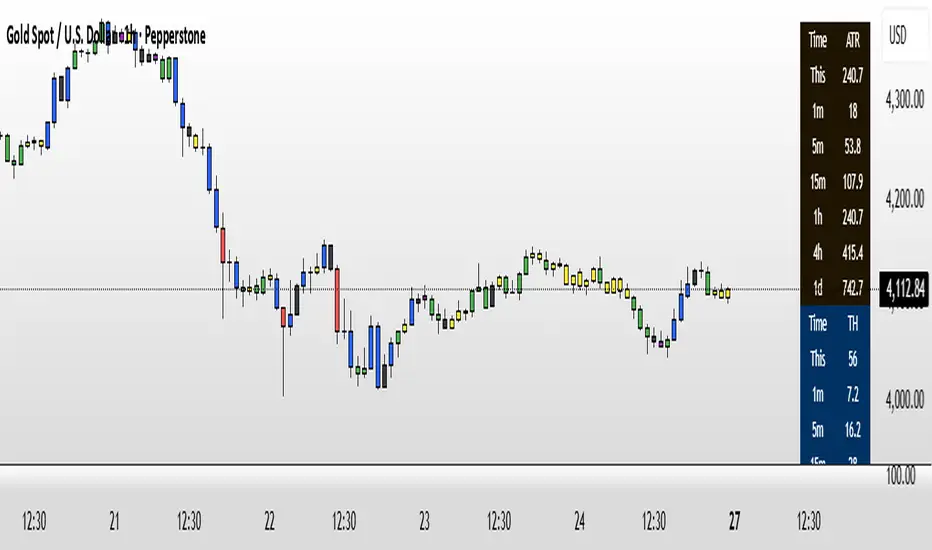
XAUUSD 9-Grid Scalper (9-levels, 3pt TP)📈 Overview
The XAUUSD 9-Grid Scalper is a precision-based intraday strategy designed for gold scalping around key 9-based price zones. Gold (XAUUSD) often reacts strongly to levels that are multiples of 9, and this script builds a dynamic grid of 18 levels around the current price to capture short-term momentum moves.
This strategy uses 9-point take profits (TP) and configurable stop-loss levels, allowing for fast in-and-out scalps within volatile gold sessions. It’s optimized for short-term traders who focus on 1M–5M charts.
⚙️ Core Logic
Dynamic 9-Multiples Grid: Automatically plots 18 nearby levels spaced by multiples of 9.
Entry Signals:
Long when price breaks above a 9-level.
Short when price breaks below a 9-level.
Take Profit: Fixed at 9 points (configurable).
Stop Loss: Adjustable for flexible risk management.
Backtest-Ready: Uses strategy() for full performance analytics (win rate, profit factor, drawdown).
💡 Best Use Cases
Ideal for gold scalpers during London and New York sessions.
Works best on 1M–5M timeframes with high volatility.
Combine with volume or trend filters (e.g., RSI, MA slope) for improved accuracy.
🧠 Customization Options
Number of grid levels (default: 18)
Take profit & stop loss distance (default: 9pt TP)
Display toggle for 9-grid visualization
Optional filters for session time or volatility
⚠️ Disclaimer
This strategy is for educational and research purposes only.
Past performance does not guarantee future results. Always test on demo before trading live.

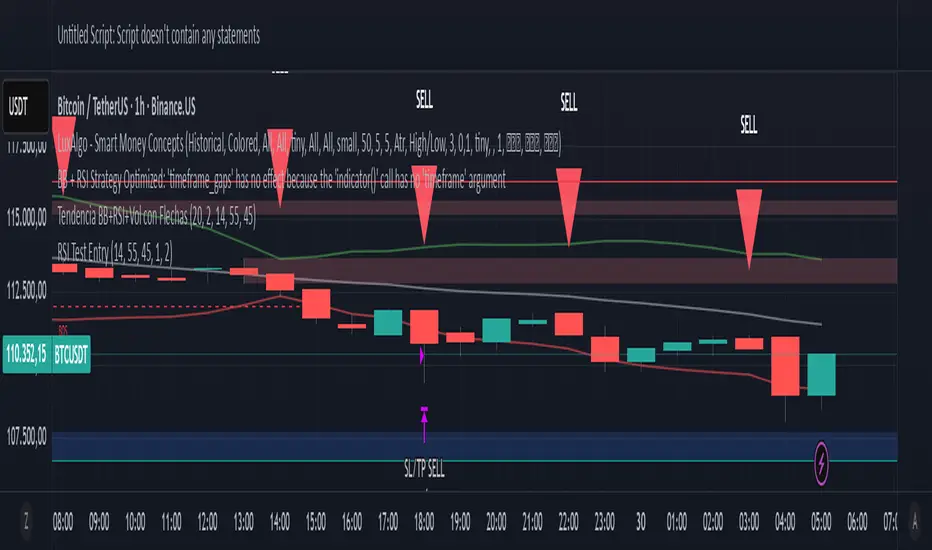
PriceAction & Economic StrategyThis indicator combines price-action logic with macroeconomic data to generate trading signals.
Features:
- Price-action signals: A bullish signal occurs when a candle closes above its open; a bearish signal occurs when a candle closes below its open.
- Signal gap: The indicator includes an input called "Signal Gap (bars)" that defines the minimum number of bars between signals. By default the gap is set to 3, but you can adjust this between 1 and 10 to control signal frequency.
- Alerts: The script defines alert conditions for long and short signals, allowing you to create TradingView alerts that notify you when a new signal occurs.
- Economic data: The script uses TradingView's built-in `request.economic()` function to request U.S. GDP data. The GDP series is plotted in the Data Window for additional macroeconomic context.
How to use:
1. Add the indicator to a chart.
2. Open the indicator's settings and adjust the "Signal Gap (bars)" input to set the minimum bar gap between signals.
3. Look for green triangles plotted below the bars (bullish signals) and red triangles plotted above the bars (bearish signals). These appear only when the gap criterion is met.
4. If you want alerts, click the Alert button in TradingView, select this indicator, and choose either the Long or Short alert conditions.
5. To view the GDP data, open the Data Window; the GDP value will be shown alongside other series for each bar.
6. Use these signals in combination with your own analysis; this indicator is for educational purposes and does not constitute financial advice.

【MasterHSC】CCI Mean Derivative Smart Strategy🧾 Strategy Description (English)
CCI Mean Slope Smart Strategy
This strategy is built on the derivative slope behavior of the Commodity Channel Index (CCI) mean line.
It identifies key turning points or trend continuations based on how the smoothed CCI (mean value) changes direction after reaching overbought or oversold zones.
Core Idea:
When the CCI mean reverses slope after exceeding ±100, it signals a potential mean reversion (range-trading opportunity).
When the CCI mean remains above +100 or below −100 with a consistent slope, it indicates a strong trending phase (momentum continuation).
The strategy dynamically adapts between these two behaviors depending on market conditions.
Modes:
🌀 Range Reversal Mode — Focuses on slope reversals after overbought/oversold conditions.
🚀 Trend Following Mode — Captures strong momentum when the CCI mean stays extended.
🧠 Auto Mode — Automatically switches between Range and Trend logic based on CCI mean volatility.
Key Features:
Dual-direction toggle: Enable or disable long/short entries independently.
Adjustable tolerance: Choose fixed or dynamic thresholds for flexibility.
Automatic mode label and visual buy/sell markers on the chart.
Pure CCI-based system — no external filters or indicators required.
Purpose:
This system is designed to reduce false signals in sideways markets while preventing missed opportunities during strong directional trends, offering a clean balance between precision and adaptability.

RSI potente 2.0rsi mas refinado e indicadores correctos a corto ,mediano y largo plazo .. el mejor indicador
4H TIMEZONE LONGTERM. NINJAXON12S CODEthis strategy is meant for longer time zones. I've been working on this for a while and now i successfully got a 1000% on back testing for 5 years.

Empire OS Trading Fully Automated Prop Firm Ready💎 Prop-Firm-Ready Momentum System v3 — The Gold-Mine Algorithm 💎
Engineered for the same standards that top prop firms demand — minimal drawdown, consistent equity growth, and precision-based execution. This isn’t a basic indicator; it’s a refined momentum engine built for traders who scale capital and manage risk like professionals.
Performance Snapshot
• Profit Factor 2.26 • Win Rate 33 % • Max Drawdown 0.9 % • Total P/L + $447 • W/L Ratio 4.6 : 1
Stress-tested on Gold (XAUUSD) across live-market conditions, it stays composed under volatility and delivers structured, data-driven consistency.
⚡ See it. Test it. Scale it.
Built for prop-firm precision — from $10 K to $300 K and beyond.

Nifty Intraday 9:30- 3 Min Candle By Trade Prime Algo.Nifty Intraday 9:30 – 3 Min Candle Strategy by Trade Prime Algo
This strategy is designed to help traders identify intraday long entries, stop-loss, and multi-target levels on the Nifty Spot / Nifty Futures based on the first 3-minute candle breakout after 9:30 AM.
It automates trade detection, entry marking, target plotting, and trailing stop-loss logic, allowing traders to visualize complete trade flow with clarity and precision.
The system offers:
✅ Auto identification of long entries based on candle breakout logic
✅ Configurable stop-loss, trailing SL, and four partial profit targets
✅ Dynamic plotting of entry, TSL, and targets on chart
✅ Custom alert messages for each event (Entry, TP1–TP4, SL, Close)
✅ Adjustable time session and test periods for backtesting
⚙️ How to Use
1️⃣ Set your desired start time (default: 9:15–9:30 AM).
2️⃣ Choose your stop-loss type — percentage or points.
3️⃣ Adjust target levels (TP1–TP4) and trailing SL settings as per your risk appetite.
4️⃣ Use this strategy for educational backtesting and research only — not for live trading signals.
5️⃣ The tool can be combined with price action zones or higher-timeframe analysis for best results.
⚠️ Disclaimer (SEBI & Risk Disclosure)
This strategy is developed strictly for educational and research purposes.
The creator of this script and Trade Prime Algo are not SEBI-registered advisors.
This tool does not guarantee any specific profit or performance.
Trading involves risk; users may incur partial or total capital loss.
All decisions taken using this indicator or strategy are solely at the user’s discretion and risk.
The creator assumes no liability for profit, loss, or any consequences arising from the use of this script.
Always perform your own due diligence and trade responsibly.

AIBTC Automated Trading Strategy🧠 AIBTC Automated Trading Strategy
Overview:
The AIBTC Automated Trading Strategy is a fully autonomous system designed for 4-hour timeframes (4H). It dynamically identifies support and resistance levels based on price action, and automatically executes trades when valid breakouts occur above resistance or below support. The system adapts in real time to changing market volatility, ensuring stable performance across different market conditions.
⚙️ Strategy Logic
Dynamic Support & Resistance Detection
The strategy uses an adaptive Pivot Point algorithm that adjusts parameters according to market volatility (ATR) and price deviation (Standard Deviation).
When volatility increases, the algorithm automatically widens its detection range and recalibrates channel width for better accuracy.
All support and resistance levels are detected dynamically — no manual configuration is required.
Trend & Volatility Filtering
The system applies ADX (Average Directional Index) to measure trend strength.
When ADX > 25, only strong levels are considered valid to avoid noise during weak trends.
ATR-based volatility adjustments automatically optimize lookback periods and detection sensitivity.
Breakout Signal Detection
A long position is triggered when price breaks above resistance with a valid breakout margin (default filter: 0.1%).
A short position is triggered when price breaks below support with the same breakout filter applied.
This breakout filter effectively minimizes false breakouts and improves signal quality.
Fully Automated Execution
The system is designed for both backtesting and live simulation.
All buy/sell entries are executed automatically without manual input once conditions are met.
🕒 Recommended Timeframe
4-hour (4H) candles
Suitable for short-to-medium term swing trading, balancing signal precision and trade frequency.
📊 Key Features
✅ Fully Automated — Executes long/short positions on valid breakouts
✅ Adaptive Parameters — Automatically adjusts to changing volatility
✅ Trend-Aware Filtering — Uses ADX to avoid false signals in ranging markets
✅ Multi-Asset Compatibility — Works on BTC, ETH, or any high-liquidity instrument
⚠️ Disclaimer
This strategy is a technical and algorithmic tool, not financial advice.
Always backtest and simulate before using it on live markets.
During periods of extreme volatility, signals may delay or show false breakouts — consider using stop-loss mechanisms accordingly.

FVG Donchian Channel strategy30min FVG + Donchian Channel strategy
buy sell by 30min fvg
and stoploss , take profit by Donchian Channel
Run the strategy on the 1min timeframe!

EMA 9/50 News Confirmation Strategy v3 (Trend Aligned 3 bMin) “EMA 9/50 crossover strategy with trend filter and ATR-based targets”)

Wh testThis issue stems from a very specific issue in TradingView: When you make the chart "view-only" (i.e., viewable via a share link), the chart data can stream live, but the indicators' runtime engine is disabled.
I'll explain in detail below why this happens and how to fix it.

ApexSniper v2 (Swing Optimized)More long term than the original Apex sniper, BETTER FOR SMALLER ACCOUNT SIZES. Scales more long term. trades take 4-8 days, but percent gained is way more.
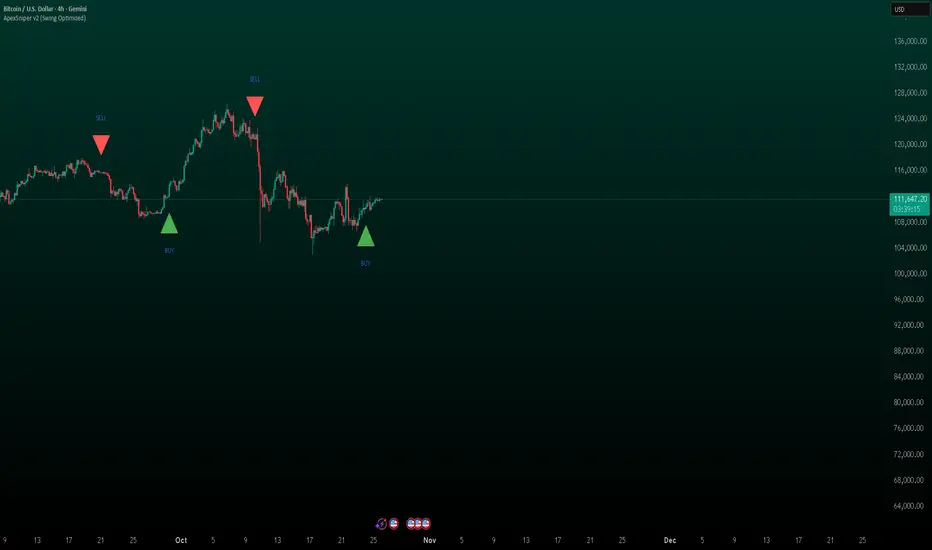
ApexSniper2.0I have Tested this Indicator Manually for about 2 months now and its been amazing.Ive been working with pine code for a really long time now, took me about 6 months to build this script, hopefully it works well for you.very good for trading. will help you out a lot

ApexSniperI have Tested this Indicator Manually for about 2 months now and its been amazing.Ive been working with pine code for a really long time now, took me about 6 months to build this script, hopefully it works well for you.very good for trading. will help you out a lot

ApexSignalsIve been working with pine code for a really long time now, took me about 6 months to build this script, hopefully it works well for you.very good for trading. will help you out a lot

Cybertrading-Insidebar hunter pro robotThe Cybertrading-Inside Pro strategy is an advanced version of Cyber-Inside.
It automates ATR-based inside-bar trading with optional pullback entries, full risk/reward visualization, time filtering, pending-order handling, and fixed chart watermark branding (“CollegePips / CyberTrading”).
⚙️ Technical Overview
1. Core Structure
Uses ATR(14) to measure volatility and classify candle ranges.
Candles are labeled as Spinning, Standard, Long, or Huge based on their range vs. ATR.
Only valid candles (Standard or Long) qualify to confirm a setup.
2. Inside-Bar Logic
The setup requires the current candle’s high/low to be fully contained inside the previous candle (an inside bar).
A wick-break must occur — the wick slightly breaks the previous inside bar’s range while the body remains inside.
This pattern forms a Pierce-Only signal.
Direction:
Wick down → potential Long entry
Wick up → potential Short entry
3. Timing and Entry Conditions
With the time filter enabled, trades trigger only between defined hours (e.g., 07–22).
If Enable Pullback is on, the entry is placed using a limit order offset by pullbackATR × ATR from the signal candle.
If the pullback entry isn’t triggered within pullbackMaxBars, the pending order is canceled automatically.
You can also enable display-only entries without execution (Enable Entry Without Pullback).
4. Risk & Target Management
Stop loss is placed beyond the second-previous candle’s high/low ± stopBuffer × ATR.
Take-profit is based on the chosen risk/reward multiple (RR) or the previous candle’s high/low.
Position size auto-adjusts to keep total risk equal to riskPercent of equity.
5. Visual Components
Dynamic chart objects include:
Red box: risk zone (entry → stop)
Green/blue box: reward zone (entry → target)
Dotted diagonal line: risk-to-reward path
Arrows: actual fill points
6. Order Management System
Each signal creates a unique order ID (pendingId) and exit ID (planExitId).
On a valid fill (newLong / newShort), real stop, target, and position size are applied.
If an order isn’t filled within the timeout window, it’s canceled and reset automatically.
7. Advantages
✅ Smart inside-bar pattern recognition
✅ Automated risk control and dynamic sizing
✅ Clear visual feedback for analysis
✅ Fully backtest-ready for research or education
Amiya's Doji / Hammer / Spinning Top Breakout Strategy v5How it works
1. Pattern Detection (Previous Candle):
• Checks if total shadow length ≥ 2 × body.
• Checks if candle height (high − low) is between 10 and 21.5 points.
• If true → marks that candle as a potential Doji, Hammer, or Spinning Top.
2. Long Setup:
• LTP (close) crosses above previous candle high.
• Previous candle is a valid pattern candle.
• Stop Loss = 3 points below previous candle low.
• Take Profit = 5 × (high − low) of previous candle added to previous high.
3. Short Setup:
• LTP (close) crosses below previous candle low.
• Previous candle is a valid pattern candle.
• Stop Loss = 3 points above previous candle high.
• Take Profit = 5 × (high − low) of previous candle subtracted from previous low.
4. Visualization:
• Yellow background highlights pattern candles.
• Green ▲ and Red ▼ markers show entry points.
Deep yellow candles → represent Doji / Hammer / Spinning Top patterns
• Green triangle → Buy signal
• Red triangle → Sell signal
• Dotted green line + label → Target
• Dotted red line + label → Stop loss
• Gray background → Outside trading hours
• Auto close → All trades square off at 3:29 PM IST

CBC Flip StrategyThe CBC Flip Strategy is a momentum-based trading system that identifies shifts in market control by monitoring price closes relative to previous bars' highs and lows: it flips to bullish mode when the close exceeds the prior high (indicating bulls in control) and enters a long position, or to bearish mode when the close falls below the prior low (indicating bears in control) and enters a short position, all while incorporating optional confluences like higher timeframe CBC alignment, RSI thresholds (above 50 + offset for longs, below 50 - offset for shorts), and EMA positioning (above for longs, below for shorts) to filter entries; trades are restricted to a user-defined session window and direction preferences, with exits handled via tick-based TP/SL, reversal on chart or higher timeframe CBC flips, and an optional flatten at a specified time to close all positions.
Number of Contracts: Adjust the quantity of contracts per trade (default: 1).
SL and TP Ticks: Set stop-loss (default: 12 ticks) and take-profit (default: 24 ticks) distances from entry.
Exit Strategy: Choose from TP/SL in ticks, exit on chart CBC flip (reverses on opposite signal), or exit on higher timeframe CBC flip.
Flatten All: Enable/disable flattening all positions at a customizable time (default: 16:00, with adjustable hour/minute).
Trading Session: Define the time window for allowing entries (default: 0800-1700).
Trade Direction: Select "Both" (longs and shorts), "Only Long", "Only Short", or "Towards Daily Open" (longs if below daily open, shorts if above).
Higher Timeframe CBC Confluence: Toggle use of HTF CBC alignment (default: enabled, with customizable HTF like "240").
RSI Confluence: Toggle RSI filter (default: enabled, with adjustable length=14, offset=20 for thresholds).
EMA Confluence: Toggle EMA filter (default: enabled, with adjustable length=200 for position relative to price).

saodisengxiaoyu-lianghua-2.1- This indicator is a modular, signal-building framework designed to generate long and short signals by combining a chosen leading indicator with selectable confirmation filters. It runs on Pine Script version 5, overlays directly on price, and is built to be highly configurable so traders can tailor the signal logic to their market, timeframe, and trading style. It includes a dashboard to visualize which conditions are active and whether they validate a signal, and it outputs clear buy/sell labels and alert conditions so you can automate or monitor trades with confidence.
Core Design
- Leading Indicator: You choose one primary signal generator from a broad list (for example, Range Filter, Supertrend, MACD, RSI, Ichimoku, and many others). This serves as the anchor of the system and determines when a preliminary long or short setup exists.
- Confirmation Filters: You can enable additional filters that validate the leading signal before it becomes actionable. Each “respect…” input toggles a filter on or off. These filters include popular tools like EMA, 2/3 EMA crosses, RQK (Nadaraya Watson), ADX/DMI, Bollinger-based oscillators, MACD variations, QQE, Hull, VWAP, Choppiness Index, Damiani Volatility, and more.
- Signal Expiry: To avoid waiting indefinitely for confirmations, the indicator counts how many consecutive bars the leading condition holds. If confirmations do not align within a defined number of bars, the setup expires. This controls latency and helps reduce late or stale entries.
- Alternating Signals: An optional mode enforces alternation (long must follow short and vice versa), helping avoid repeated entries in the same direction without a meaningful reset.
- Aggregation Logic: The final long/short conditions are formed by combining the leading condition with all selected confirmation filters through logical conjunction. Only if all enabled filters validate the signal (within expiry constraints) does the indicator consider it a confirmed long or short.
- Visualization and Alerts: The script plots buy/sell labels at signal points, provides alert conditions for automation, and displays a compact dashboard summarizing the leading indicator’s status and each confirmation’s pass/fail result using checkmarks.
Leading Indicator Options
- The indicator includes a very large menu of leading tools, each with its own logic to determine uptrend or downtrend impulses. Highlights include:
- Range Filter: Uses a dynamic centerline and bands computed via conditional EMA/SMA and range sizing to define directional movement. It can operate in a default mode or an alternative “DW” mode.
- Rational Quadratic Kernel (RQK): Applies a kernel smoothing model (Nadaraya Watson) to detect uptrends and downtrends with a focus on noise reduction.
- Supertrend, Half Trend, SSL Channel: Classic trend-following tools that derive direction from ATR-based bands or moving average channels.
- Ichimoku Cloud and SuperIchi: Multi-component systems validating trend via cloud position, conversion/base line relationships, projected cloud, and lagging span.
- TSI (True Strength Index), DPO (Detrended Price Oscillator), AO (Awesome Oscillator), MACD, STC (Schaff Trend Cycle), QQE Mod: Momentum and cycle tools that parse direction from crossovers, zero-line behavior, and momentum shifts.
- Donchian Trend Ribbon, Chandelier Exit: Trend and exit tools that can validate breakouts or sustained trend strength.
- ADX/DMI: Measures trend strength and directional movement via +DI/-DI relationships and minimum ADX thresholds.
- RSI and Stochastic: Use crossovers, level exits, or threshold filters to gate entries based on overbought/oversold dynamics or relative strength trends.
- Vortex, Chaikin Money Flow, VWAP, Bull Bear Power, ROC, Wolfpack Id, Hull Suite: A diverse set of directional, momentum, and volume-based indicators to suit different markets and styles.
- Trendline Breakout and Range Detector: Price-behavior filters that confirm signals during breakouts or within defined ranges.
Confirmation Filters
- Each filter is optional. When enabled, it must validate the leading condition for a signal to pass. Examples:
- EMA Filter: Requires price to be above a specified EMA for longs and below for shorts, filtering signals that contradict broader trend or baseline levels.
- 2 EMA Cross and 3 EMA Cross: Enforce moving average cross conditions (fast above slow for long, the reverse for short) or a three-line stacking logic for more stringent trend alignment.
- RQK, Supertrend, Half Trend, Donchian, QQE, Hull, MACD (crossover vs. zero-line), AO (zero line or AC momentum variants), SSL: Each adds its characteristic validation pattern.
- RSI family (MA cross, exits OB/OS zones, threshold levels) plus RSI MA direction and RSI/RSI MA limits: Multiple ways to constrain signals via relative strength behavior and trajectories.
- Choppiness Index and Damiani Volatility: Prevent entries during ranging conditions or insufficient volatility; choppiness thresholds and volatility states gate the trade.
- VWAP, Volume modes (above MA, simple up/down, delta), Chaikin Money Flow: Volume and flow conditions that ensure signals happen in supportive liquidity or accumulation/distribution contexts.
- ADX/DMI thresholds: Demand a minimum trend strength and directional DI alignment to reduce whipsaw trades.
- Trendline Breakout and Range Detector: Confirm that the price is breaking structure or remains within active range consistent with the leading setup.
- By combining several filters you can create strict, conservative entries or looser setups depending on your goals.
Range Filter Engine
- A core building block, the Range Filter uses conditional EMA and SMA functions to compute adaptive bands around a dynamic centerline. It supports two types:
- Type 1: The centerline updates when price exceeds the band thresholds; bands define acceptable drift ranges.
- Type 2: Uses quantized steps (via floor operations) relative to the previous centerline to handle larger moves in discrete increments.
- The engine offers smoothing for range values using a secondary EMA and can switch between raw and averaged outputs. Its hi/lo bands and centerline compose a corridor that defines directional movement and potential breakout confirmation.
Signal Construction
- The script computes:
- leadinglongcond and leadingshortcond : The primary directional signals from the chosen leading indicator.
- longCond and shortCond : Final signals formed by combining the leading conditions with all enabled confirmations. Each confirmation contributes a boolean gate. If a filter is disabled, it contributes a neutral pass-through, keeping the logic intact without enforcing that condition.
- Expiry Logic: The code counts consecutive bars where the leading condition remains true. If confirmations do not line up within the user-defined “Signal Expiry Candle Count,” the setup is abandoned and the signal does not trigger.
- Alternation: An optional state ensures that long and short signals alternate. This can reduce repeated entries in the same direction without a clear reset.
- Finally, longCondition and shortCondition represent the actionable signals after expiry and alternation logic. These drive the label plotting and alert conditions.
Visualization
- Buy and Sell Labels: When longCondition or shortCondition confirm, the script plots annotated labels directly on the chart, making entries easy to see at a glance. The labels use color coding and clear text tags (“long” vs. “short”).
- Dashboard: A table summarizes the status of the leading indicator and all confirmations. Each row shows the indicator label and whether it passed (✔️) or failed (❌) on the current bar. This intensely practical UI helps you diagnose why a signal did or did not trigger, empowering faster strategy iteration and parameter tuning.
- Failed Confirmation Markers: If a setup expires (count exceeds the limit) and confirmations failed to align, the script can mark the chart with a small label and provide a tooltip listing which confirmations did not pass. It’s a helpful audit trail to understand missed trades or prevent “chasing” invalid signals.
- Data Window Values: The script outputs signal states to the data window, which can be useful for debugging or building composite conditions in multi-indicator templates.
Inputs and Parameters
- You control the indicator from a comprehensive input panel:
- Setup: Signal expiry count, whether to enforce alternating signals, and whether to display labels and the dashboard (including position and size).
- Leading Indicator: Choose the primary signal generator from the large list.
- Per-Filter Toggles: For each confirmation, a respect... toggle enables or disables it. Many include sub-options (like MACD type, Stochastic mode, RSI mode, ADX variants, thresholds for choppiness/volatility, etc.) to fine-tune behavior.
- Range Filter Settings: Choose type and behavior; select default vs. DW mode and smoothing. The underlying functions adjust band sizes using ATR, average change, standard deviation, or user-defined scales.
- Because everything is customizable, you can adapt the indicator to different assets, volatility regimes, and timeframes.
Alerts and Automation
- The script defines alert conditions tied to longCondition and shortCondition . You can set these alerts in your chart to trigger notifications or webhook calls for automated execution in external bots. The alert text is simple, and you can configure your own message template when creating alerts in the chart, including JSON payloads for algorithmic integration.
Typical Workflow
- Select a Leading Indicator aligned with your style. For trend following, Supertrend or SSL may be appropriate; for momentum, MACD or TSI; for range/trend-change detection, Range Filter, RQK, or Donchian.
- Add a few key Confirmation Filters that complement the leading signal. For example:
- Pair Supertrend with EMA Filter and RSI MA Direction to ensure trend alignment and positive momentum.
- Combine MACD Crossover with ADX/DMI and Volume Above MA to avoid signals in low-trend or low-liquidity conditions.
- Use RQK with Choppiness Index and Damiani Volatility to only act when the market is trending and volatile enough.
- Set a sensible Signal Expiry Candle Count. Shorter expiry keeps entries timely and reduces lag; longer expiry captures setups that mature slowly.
- Observe the Dashboard during live markets to see which filters pass or fail, then iterate. Tighten or loosen thresholds and filter combinations as needed.
- For automation, turn on alerts for the final conditions and use webhook payloads to notify your trading robot.
Strengths and Practical Notes
- Flexibility: The indicator is a toolkit rather than a single rigid model. It lets you test different combinations rapidly and visualize outcomes immediately.
- Clarity: Labels, dashboard, and failed-confirmation markers make it easy to audit behavior and refine settings without digging into code.
- Robustness: The expiry and alternation options add discipline, avoiding the temptation to enter late or repeatedly in one direction without a reset.
- Modular Design: The logical gates (“respect…”) make the behavior transparent: if a filter is on, it must pass; if it’s off, the signal ignores it. This keeps reasoning clean.
- Avoiding Overfitting: Because you can stack many filters, it’s tempting to over-constrain signals. Start simple (one leading indicator and one or two confirmations). Add complexity only if it demonstrably improves your edge across varied market regimes.
Limitations and Recommendations
- No single configuration is universally optimal. Markets change; tune filters for the instrument and timeframe you trade and revisit settings periodically.
- Trend filters can underperform in choppy markets; likewise, momentum filters can false-trigger in quiet periods. Consider using Choppiness Index or Damiani to gate signals by regime.
- Use expiry wisely. Too short may miss good setups that need a few bars to confirm; too long may cause late entries. Balance responsiveness and accuracy.
- Always consider risk management externally (position sizing, stops, profit targets). The indicator focuses on signal quality; combining it with robust trade management methods will improve results.
Example Configurations
- Trend-Following Setup:
- Leading: Supertrend uptrend for longs and downtrend for shorts.
- Confirmations: EMA Filter (price above 200 EMA for long, below for short), ADX/DMI (trend strength above threshold with +DI/-DI alignment), Volume Above MA.
- Expiry: 3–4 bars to keep entries timely.
- Result: Strong bias toward sustained moves while avoiding weak trends and thin liquidity.
- Mean-Reversion to Momentum Crossover:
- Leading: RSI exits from OB/OS zones (e.g., RSI leaves oversold for long and leaves overbought for short).
- Confirmations: 2 EMA Cross (fast crossing slow in the same direction), MACD zero-line behavior for added momentum validation.
- Expiry: 2–3 bars for responsive re-entry.
- Result: Captures momentum transitions after short-term extremes, with extra confirmation to reduce head-fakes.
- Range Breakout Focus:
- Leading: Range Filter Type 2 or Donchian Trend Ribbon to detect breakouts.
- Confirmations: Damiani Volatility (avoid low-volatility false breaks), Choppiness Index (prefer trend-ready states), ROC positive/negative threshold.
- Expiry: 1–3 bars to act on breakout windows.
- Result: Better alignment to breakout dynamics, gating trades by volatility and regime.
Conclusion
- This indicator is a comprehensive, configurable framework that merges a chosen leading signal with an array of corroborating filters, disciplined expiry handling, and intuitive visualization. It’s designed to help you build high-quality entry signals tailored to your approach, whether that’s trend-following, breakout trading, momentum capturing, or a hybrid. By surfacing pass/fail states in a dashboard and allowing alert-based automation, it bridges the gap between discretionary analysis and systematic execution. With sensible parameter tuning and thoughtful filter selection, it can serve as a robust backbone for signal generation across diverse instruments and timeframes.
