Liquidity PeaksThe "Liquidity Peaks" indicator is a tool designed to identify significant supply and demand zones based on volumetric analysis. It analyzes the volume profile within a specified lookback range to pinpoint the most volumetric point and draw corresponding zones on the price chart.
The 𝐋𝐢𝐪. 𝐏𝐞𝐚𝐤𝐬 indicator utilizes volume data to identify key supply and demand areas on the price chart. By examining the volume profile within a defined lookback range, it highlights three distinct zones: liquidity grab, volume containment, and the most volumetric point.
Zones and their meanings:
Liquidity grab (Orange box): This zone represents a price level where there is a significant swipe of the previous demand zone within the volume range. It indicates a potential shift in market sentiment and serves as a key supply or demand area.
Volume containment (Gray box): This zone displays the area of volume contained before the peak in volume. It provides insights into the range where buying or selling pressure was concentrated, highlighting potential support or resistance levels.
Most volumetric point (Light blue box): This zone represents the point within the lookback range that exhibits the highest volume. It signifies a significant area of market interest and indicates a potential supply or demand level.
Adjustable options:
Adjust liquidity Grab: This option allows you to adjust the size of the boxes. When enabled, the box size is set to twice the size of the high or low of the candle's wick. This adjustment enhances the visibility and accuracy of identifying swipes at specific price levels.
Show origin: Enabling this option ensures that the liquidity boxes are drawn from the wick they were created from. This provides a clear visual reference to the specific candle and highlights the liquidity levels associated with it.
Utility:
The 𝐋𝐢𝐪. 𝐏𝐞𝐚𝐤𝐬 indicator is a valuable tool for traders and investors seeking to identify significant supply and demand zones in the market. By analyzing volume data and drawing corresponding zones on the chart, it helps to pinpoint areas where buying or selling pressure is likely to emerge.
Traders can utilize this information to identify potential support and resistance levels, plan their entries and exits, and make more informed trading decisions. The liquidity grab zones can act as potential reversal or breakout points, while the volume containment zones and most volumetric points provide insights into areas of high market interest.
It is important to note that this indicator should be used in conjunction with other technical analysis tools and indicators to confirm trading signals and validate market dynamics.
Example Charts:
Candlestickanalisys

Candle Color OverlayDescription:
The Candle Color Overlay (CCO) indicator is a powerful tool for visualizing price movements on a chart. It overlays the chart with customizable colors, highlighting bullish and bearish candles based on their open and close values. This indicator helps traders quickly identify the direction of price movements and assess market sentiment.
How it Works:
The Candle Color Overlay indicator performs the following steps:
1. Calculation of the OHLC (Open, High, Low, Close) values for each candle based on the selected timeframe.
2. Classification of each candle as bullish or bearish:
- A bullish candle is when the closing price is greater than or equal to the opening price.
- A bearish candle is when the closing price is lower than the opening price.
3. Overlaying colors on the chart:
- The indicator applies a bullish color to the background when candles are classified as bullish and a bearish color to the background when candles classified as bearish. This overlay provides a visual representation of price movements.
4. Optional display of price movement labels:
- If enabled, the indicator shows a text label at the bottom of the current candle, indicating the percentage increase or decrease in price during a bullish or bearish background period.
Usage:
To effectively use the Candle Color Overlay indicator, follow these steps:
1. Add the indicator to your chart from the list of available indicators.
2. Configure the indicator's inputs:
- Choose the desired color for bullish candles using the "Bullish Color" input.
- Select the preferred color for bearish candles using the "Bearish Color" input.
- Specify the timeframe for analysis using the "Time Frame" input (default is 1 hour).
- Optionally enable the "Show Background Price Movement" input to display the percentage increase or decrease in price during each background period.
3. Analyze the colored overlay:
- Bullish colors represent candles where the closing price is greater than or equal to the opening price, indicating bullish sentiment.
- Bearish colors represent candles where the closing price is lower than the opening price, indicating bearish sentiment.
4. If enabled, observe the price movement labels
5. Combine the insights from the colored overlay and the price movement labels with other technical analysis tools, such as trend lines, support and resistance levels, or candlestick patterns, to make well-informed trading decisions.

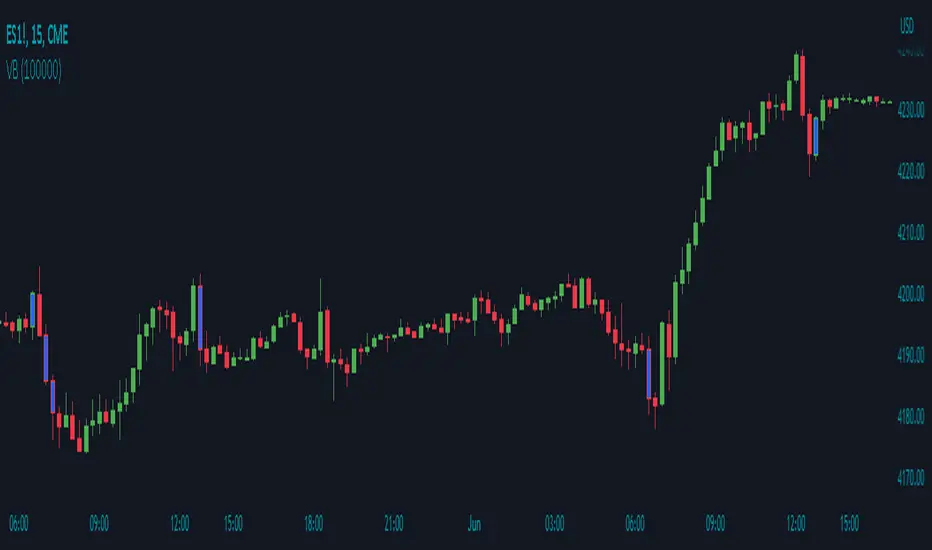
Volume Breakout by Chosen VolumeDescription:
The Volume Breakout indicator (VB) is a technical analysis tool that highlights candles with significant trading volume. It helps traders identify potential breakout periods characterized by high volume activity.
How it Works:
The Volume Breakout indicator compares the volume of each candle with a user-defined minimum volume threshold. If the volume of a candle exceeds or is equal to the specified minimum volume requirement, the indicator identifies it as a volume breakout and marks it accordingly.
Usage:
To effectively utilize the Volume Breakout indicator, follow these steps:
1. Apply the VB indicator to your chart by adding it from the available indicators.
2. Customize the minimum required volume parameter according to your trading preferences. This parameter determines the threshold volume level that a candle must meet or exceed to be considered a breakout candidate.
3. Observe the candles on the chart:
- Candles that meet or exceed the minimum required volume are highlighted with a specific color (yellow by default), indicating potential breakout periods.
4. Pay attention to the volume breakout indications within the candles, as they suggest periods of increased trading activity.
5. Analyze the price action accompanying the volume breakout candles. Breakouts often indicate a surge in buying or selling pressure, potentially leading to significant price moves or trend reversals.
6. Combine the analysis of volume breakout candles with other technical analysis tools, such as trend lines, support and resistance levels, or indicators, to confirm potential trade setups.
7. Implement appropriate risk management strategies, including setting stop-loss orders and position sizing, to manage your trades effectively and protect your capital.
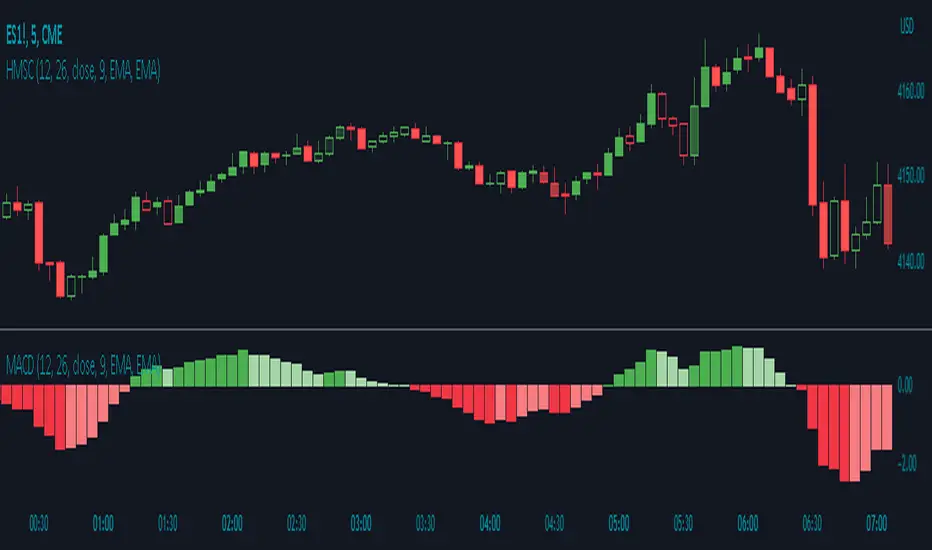
Histogram Momentum Shaded CandlesDescription:
The Histogram Momentum Shaded Candles indicator (HMSC) is a powerful technical analysis tool that combines the concepts of the MACD (Moving Average Convergence Divergence) indicator and shaded candlestick visualization. It provides insights into momentum and trend strength by representing the MACD histogram as shaded candles on the chart.
How it Works:
The HMSC indicator calculates the MACD (Moving Average Convergence Divergence) using user-defined parameters such as the fast length, slow length, source, signal smoothing, and moving average types. It then calculates the MACD histogram by subtracting the signal line from the MACD line. The indicator transforms the histogram values into transparency levels for the shaded candles, representing bullish and bearish momentum.
Usage:
To effectively utilize the Histogram Momentum Shaded Candles indicator, follow these steps:
1. Apply the HMSC indicator to your chart by adding it from the available indicators.
2. Customize the MACD settings such as the fast length, slow length, source, signal smoothing, and moving average types according to your trading preferences.
3. Observe the shaded candles plotted on the chart:
- Bullish shaded candles (green by default) indicate positive momentum and potential buying pressure.
- Bearish shaded candles (red by default) indicate negative momentum and potential selling pressure.
4. Assess the intensity of the shaded candles:
5. Shading intensity is determined by the magnitude of the MACD histogram, with higher values resulting in more opaque candles.
6. The shading intensity reflects the strength of momentum and can help identify significant shifts in price action.
7. Combine the analysis of shaded candles with traditional candlestick patterns, trend lines, support and resistance levels, and other technical indicators to validate potential trade setups.
8. Implement appropriate risk management strategies, including setting stop-loss orders and position sizing, to manage your trades effectively and protect your capital.
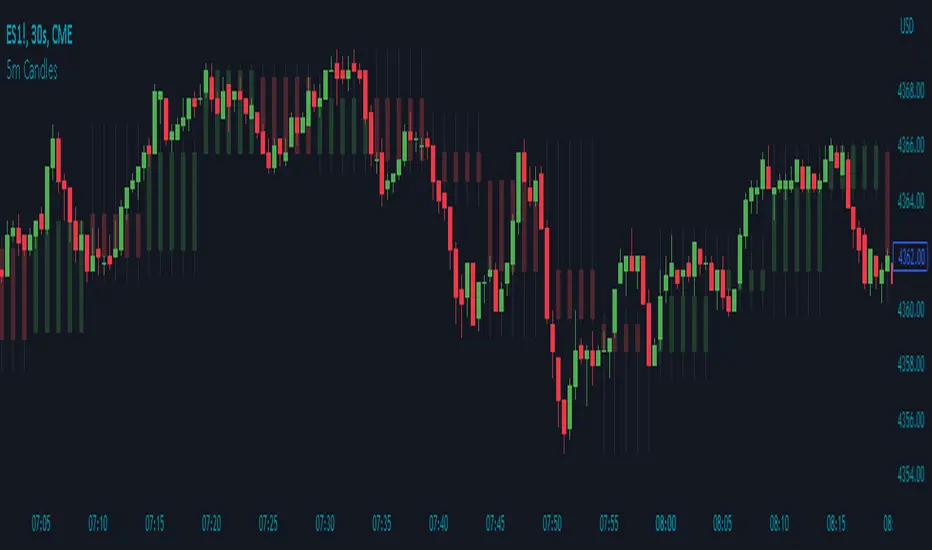
5m Candle OverlayDescription:
The 5m Candle Overlay indicator is a powerful technical analysis tool designed to overlay 5-minute candles onto your chart. This indicator enables detailed analysis of price action within the 5-minute time frame, providing valuable insights into short-term market movements.
How it Works:
The 5m Candle Overlay indicator calculates the OHLC (Open, High, Low, Close) values specifically for the 5-minute time frame. By utilizing the request.security function, it retrieves the OHLC values for each 5-minute candle. The indicator then determines the color for each candle based on a comparison between the close and open prices. Bullish candles are assigned a green color with 75% opacity, while bearish candles are assigned a red color with 75% opacity. Additionally, the indicator checks if the current bar index is a multiple of 5 to prevent overlapping and enhance visualization.
Usage:
To effectively utilize the 5m Candle Overlay indicator, follow these steps:
1. Apply the 5m Candle Overlay indicator to your chart by adding it from the available indicators.
2. Observe the overlay of 5-minute candles on your chart, providing a detailed representation of price movements within the 5-minute time frame.
3. Interpret the candles:
- Bullish candles (green by default) indicate that the close price is higher than the open price, suggesting potential buying pressure.
- Bearish candles (red by default) indicate that the close price is lower than the open price, suggesting potential selling pressure.
4. Note that the indicator plots candles with a vertical offset every fifth indicator to prevent overlapping, ensuring clarity and ease of interpretation.
5. Combine the analysis of the 5-minute candles with other technical analysis tools, such as support and resistance levels, trend lines, or indicators from different time frames, to gain deeper insights and identify potential trade setups.
6. Implement appropriate risk management strategies, including setting stop-loss orders and position sizing, to effectively manage your trades within the 5-minute time frame and protect your capital.
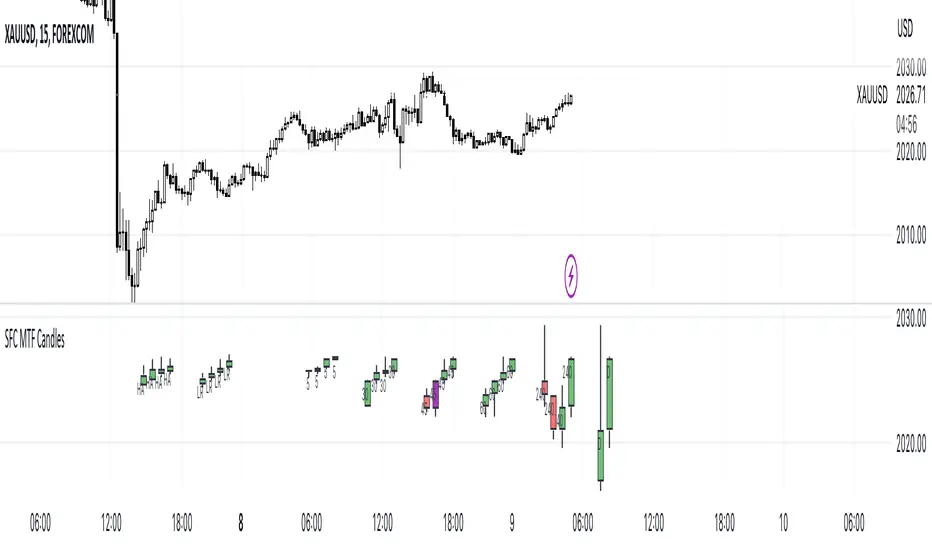
SFC MTF CandlesMost technical traders in the foreign exchange market, whether they are novices or seasoned pros, have come across the concept of multiple time frame analysis in their market educations.
Multiple time-frame analysis involves monitoring the same currency pair across different frequencies (or time compressions). While there is no real limit as to how many frequencies can be monitored or which specific ones to choose, there are general guidelines that most practitioners will follow.
Typically, using three different periods gives a broad enough reading on the market, while using fewer than this can result in a considerable loss of data, and using more typically provides redundant analysis.
This indicator helps traders to visualise the last few candles on many time frames.
For manipulation traders I have added the ability to see the current manipulation on different time frames. When such a candle is created, its colour changes to purple.
The Heikin-Ashi technique averages price data to create a Japanese candlestick chart that filters out market noise.
Heikin-Ashi charts, developed by Munehisa Homma in the 1700s, share some characteristics with standard candlestick charts but differ based on the values used to create each candle. Instead of using the open, high, low, and close like standard candlestick charts, the Heikin-Ashi technique uses a modified formula based on two-period averages. This gives the chart a smoother appearance, making it easier to spots trends and reversals, but also obscures gaps and some price data.
Linear regression attempts to model the relationship between two variables, with a given collection of data values.
Linear regression is a very common and useful technique for following the trend. This technique is applied to candles in order to filter out false movements.
Heikin Ashi and Linear Regression candles are helpful for more conservative traders. If they are not sure about the direction, they can wait for these candles to change colour (direction) as an extra confirmation.
Features:
- Up to 6 time frames
- Up to 4 MTF bars
- Heikin Ashi candles (current time frame) - x4
- Linear Regression candles (current time frame) - x4
Settings
- Time frames on/off
- Selection how many bars to display from each time frame (max 4)
- Adjustment of distance between candles
- Adjusting the position of the candles
- Heikin Ashi candles on/off
- TLinear regression candles on/off
- Linear regression candle length adjustment
How to use the indicator:
Traders can visualise different candles in order to observe the chart better and faster.
All they have to do is activate the group of candles they want and set it up according to their preferences.
Due to the complexity of the code, there is a 1s delay when all features are enabled. To eliminate the lag, deactivate some of the features
It is recommended to have a maximum of 3 time frames activated during the high impact news, as the price changes very quickly.
Equilibrium╭━━━╮╱╱╱╱╱╱╭╮╱╭╮
┃╭━━╯╱╱╱╱╱╱┃┃╱┃┃
┃╰━━┳━━┳╮╭┳┫┃╭┫╰━┳━┳┳╮╭┳╮╭╮
┃╭━━┫╭╮┃┃┃┣┫┃┣┫╭╮┃╭╋┫┃┃┃╰╯┃
┃╰━━┫╰╯┃╰╯┃┃╰┫┃╰╯┃┃┃┃╰╯┃┃┃┃
╰━━━┻━╮┣━━┻┻━┻┻━━┻╯╰┻━━┻┻┻╯
╱╱╱╱╱╱┃┃
╱╱╱╱╱╱╰╯
Overview
Equilibrium is a tool designed to measure the buying & selling pressure in the market. It is depicted as a “pressure gauge” that automatically adjusts as new candles are formed, providing a real-time indication of who's on top right now, buyers or sellers?
Background
Supply & demand is considered to be the main driving force of our modern economies, where the interaction between the two parties(sellers & buyers) leads to the determination of the fair price for a given product. Stock markets are no exception, they operate very much based around the idea of supply & demand.
In simple terms, supply refers to the availability of a product, and demand is the willingness of consumers to buy that product at a given price. It is obvious that different vendors may sell the same product at slightly different prices, and similarly, different customers may choose to buy the same product from different vendors at varying prices. The idea is that the price is allowed to fluctuate from time to time, but in a free & fair market, the price will eventually settle down to a value that makes both the parties happy. Such a state is known as the “Price-Equilibrium”, and this process is also referred to as the market mechanism.
This is the basic assumption around which this tool is based, the market is always trying to move towards a state of equilibrium.
Calculations
This tool takes a simplistic approach to estimate the degree of imbalance between buyers & sellers, here’s a brief summary of how the pressure is calculated:
- We compute the total lengths of red & green candles for a given period, i.e. price range multiplied by the volume for that candle.
- Then the distribution of each type of candle is calculated.
- Assuming more red candles denote more selling pressure, and green candles denote buying pressure, the gauge is populated cell by cell.
- As the pressure on one side increases, the intensity of the cell color also increases, signifying the extent to which one side is dominating.
How to use it
- The indicator is designed as a pressure gauge that moves up(vertical alignment) or to the right(horizontal alignment) as the buying pressure increases, and moves down or to the left as the selling pressure increases. How it is to be used & applied, that completely depends on your trading methodology. But, the general idea is that we expect the market to be in a state of equilibrium, and if that is not the case the tool will highlight that, and this is also where the opportunity lies to find suitable trades.
- Just by having an idea about who’s dominating the market currently, a trader can also pick sides wisely. Remember, the market is always striving to come back a state of equilibrium, and a slight imbalance can indicate the current trend, and more importantly, who’s more likely to make the next move.
User Settings
The tool offers some minimal configurations for the end user:
- You can choose to display the actual percentage value in the gauge(Show Text).
- You can adjust colors that denote buyers & sellers.
- You can change the layout of gauge, default is vertical(right side of the screen).
- Last, and most important, you can adjust the number of candles to traverse for calculating the pressure. Default is 50, can go upto 1000.
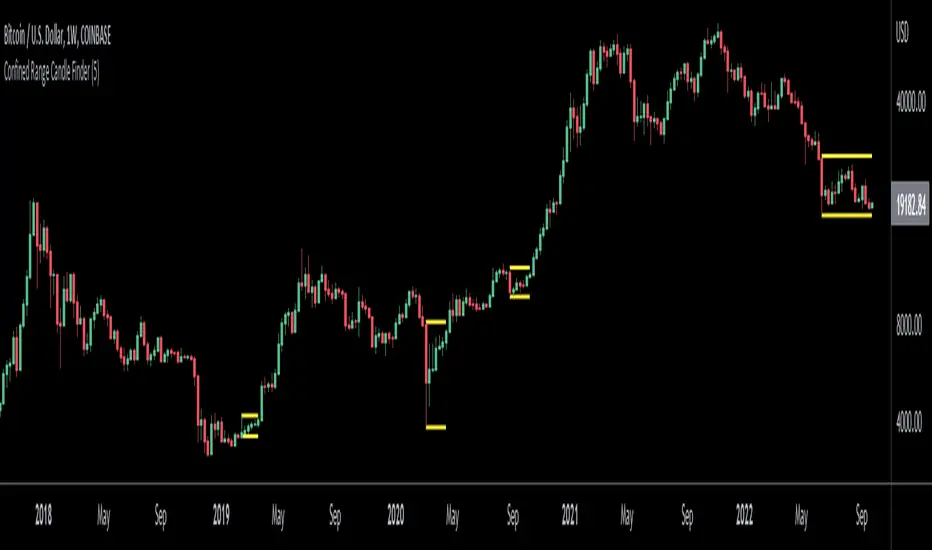
Confined Range Candle FinderThis indicator finds candlesticks which are confined within the range of a previous candlestick. This indicates volatility contraction which often leads to volatility expansion, i.e. large price movements.
While every confined range will contain at least 1 inside bar, this indicator differs from the Inside Bar Finder which only finds consecutive inside bars.
This indicator includes options such as:
- The minimum number of candlesticks confined within the range of a previous candlestick to trigger the indicator
- Labels to indicate the number of confined candles
- Signal lines to indicate the high and low of the containing candlestick
Try out this indicator with different options on different timeframes to see if confined ranges increase the probability of identifying the direction of price movements. Breaks or closes outside signal lines can be used to trigger trade signals.
HTF Candles: 3x Multi-Timeframe Candle Boxes #Pip-Whisperer
- Modify 3 Timeframes to display Candle Boxes over your Chart
- Thats it.
- Enjoy!
- If anyone implements candlestick pattern detection to this before me, please send me link, that would be sick!

ULTIMATE CANDLESTICK FINDER (Pullback/Rallys/Hammers/Dojis) + MATodays scripts is based on my Pullback And Rally Candles with other meaningful candles such as Hammers and Dojis.
You can choose which Candles to show on the cart and if you want to candles to appear above or below a moving average.
If you follow my work, you may recognise some of these candles which I'm about to show you however these candles are 1) more refined and 2) has moving average filters.
Ive included a D,6H,1H Candle in this script as on different timeframes - each swing low on average has a different amount of bars within the swing low / swing high so the DPB and RD will only work on the Daily
//Pullback candle
This candle is very powerful when used with simple Price Action such as Market Structure//Demand zones and support zones. (((((WORKS BEST IN UPTRENDS AND BOTTOM OF RANGES)))))
Ive included a D,6H,1H Pullback Candle in this script as on different timeframes - each swing low on average has a different amount of bars within the swing low so the DPB will only work on the Daily
//DAILY PULLBACK (Swing Traders)
//4H PULLBACK (Swing Traders)
- this signal will produce more signals due to the swing low filter on the 4H
//1H PULLBACK
- this signal has been refined due to too many candle displaying in weak areas
!!!IF YOU DONT WANT TO USE PULLBACKS DURING DOWNTRENDS THEN USE THE EMA FILTER TO TURN OFF THE PULLBACKS WHEN PRICE IS BELOW THE MOVING AVERAGE!!!
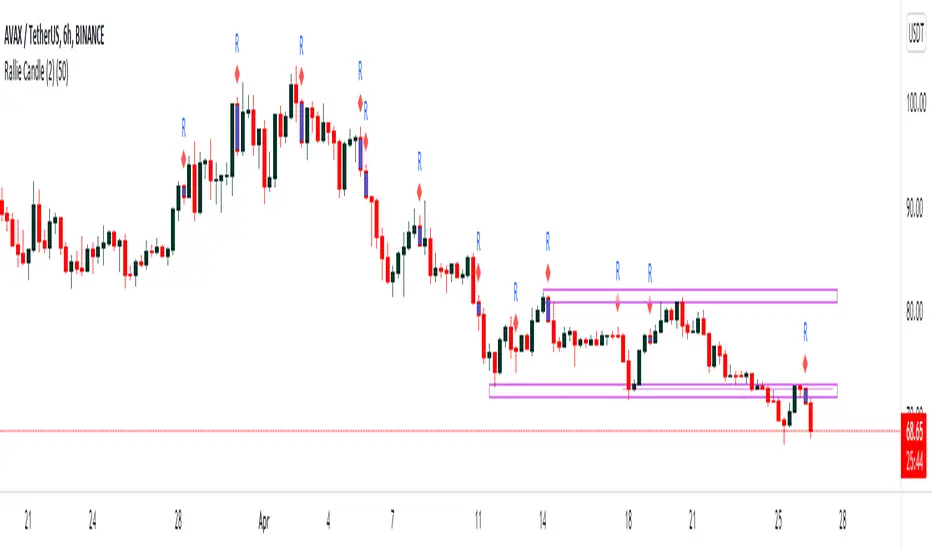
//Rally candle (My personal Favourite) (((((WORKS BEST IN DOWNTRENDS AND TOP OF RANGES)))))
This candle is very powerful when used with simple Price Action such as Market Structure//Supply zones and Resistance zones.
//DAILY RALLY(Swing Traders)
//4H RALLY(Swing Traders)
- this signal will produce more signals due to the swing high filter on the 4H
!!!IF YOU DONT WANT TO USE RALLIES DURING UPTRENDSTHEN USE THE EMA FILTER TO TURN OFF THE RALLIES WHEN PRICE IS ABOVE THE MOVING AVERAGE!!!
//POWERFUL DOJIS (INDECISION)
We look for indecision in key areas to see if momentum is shifting. When combined with Pullbacks or Rallys - this will enhance the odds of a probably area.
//HAMMERS
//MOVING AVERAGES
Short EMA = 50
Long EMA = 200
This filter can be used when the market is trending - look out for rejections off the moving averages
Also you can chance the Short And Long EMA to choose which MA cross you want to use
ALSO ALL THE CANDLES HAVE A ALERT CONDITIONS WHICH YOU CAN ACCESS - THIS WILL ALERT ANY CANDLE YOU CHOOSE
Please leave a like/comment on this post as this is much appreciated....
Rally HTF Candle (Candlestick Analysis) Guaranteed WinnersRally Candle will signal when price is at the end of a Rally to the upside and thus entering a balance phase in the market (works on all markets)
This candle works very efficient when the market is either trending downwards or in range markets where price is at resistance. (i would avoid in uptrends but depends on the trader)
Also we can expect this candle to form when price is overextended as the theory of this script is when there is a turning point in momentum - this candle will appear and we can look long from this signal.
This candle will only work in Swing High areas and appear when below an moving average which can be changed in the settings.
This candle will work only work pn the HTF as it provides very good rexpectancy whereas the LTF has a slightly less expectancy (i will be publishing an intraday Rally candle)
This candle can be alerted to signal the Rally Candle when the bar is confirmed and not during.
The way i trade this candle is
1) Candle signal must be in probably area to increase efficiency.
2) Enter on the second candle after candle IS CONFIRMED
3) Set stop loss below Rally Candle or use ATR value
4) Trade with the trend ie only Bearish price action
5) This candle can catch extreme points in the market ie this candle projected when ETH hit aths $4841
6) Trading with a confluence along with the Rally is better than solely trading this candle
Please leave a comment.
If we get to 100 likes i will publish the script.

Rally Candle (End Game ) 26/04/2022 Few Months ago I started wanted to code a candle which alerts me when a Rally may be over in Bearish Conditions and today I have created a candle which is 1. subjective but more importantly appears in areas where buying pressure is at either a climax or in the process of a decline and this is where the Rally Candle signals. This shows momentum may be shifting and these can provide some good entries.
They will only working when price is below the 200ema and in overextended markets - VERY IMPORTANT!!!
Works on all timeframe with HTF providing more price percentage than LTF
They aren’t a specific candle size however they will repaint when we see 4 higher close candles followed by a candle which has closed lower than the previous 4th.
//Candle Conditions
This candle has to be in a swing high area to be valid and on 1H and 6H but the 1H will repaint a lot of candles so when we have a point system of +20 we can assume this setup is a good setup.
//Candle Operators
You can change the color of the bar to your liking
There is a ema filter so if you want to candle to not show candles of the 50ema this operator will do the command.
Please post requests and any potential implementations I could port to pine script.
Hope you Enjoy :)
EMA ExtendedThe general idea behind the indicator is that when price is extended away from an EMA (usually the 50 EMA for the Market Maker strategy), it usually comes back to it. When monitoring many assets or cryptocurrencies, this indicator (with Alerts) provides ease of mind to spot such opportunities across the board.
This indicator uses an EMA and the current price (candle's High and Low) to signal 'Long' or 'Short' when price is extended away from the EMA with a specific ratio. The signal is in the form of an arrow that appears above the candle to be Shorted, or below the candle to be Longed. Those signals are also exported to the Alerts system so you can choose to trigger alerts (preferably "Once Per Bar").
All features are configurable from the indicator's settings.
Example: 'Long' signal if price is extended 0.78% below the 50 EMA , or 'Short' signal if price is extended 5.2% above the 50 EMA .
I plan to expand on this indicator to support MAs, as well as the potential to include multi-conditions (AND/OR) of two different EMAs/MAs (eg. 'Short' signal if price is 8% above 50 EMA and 20% above 200 MA).
If you have suggestions or questions, you can message me or leave a comment.
