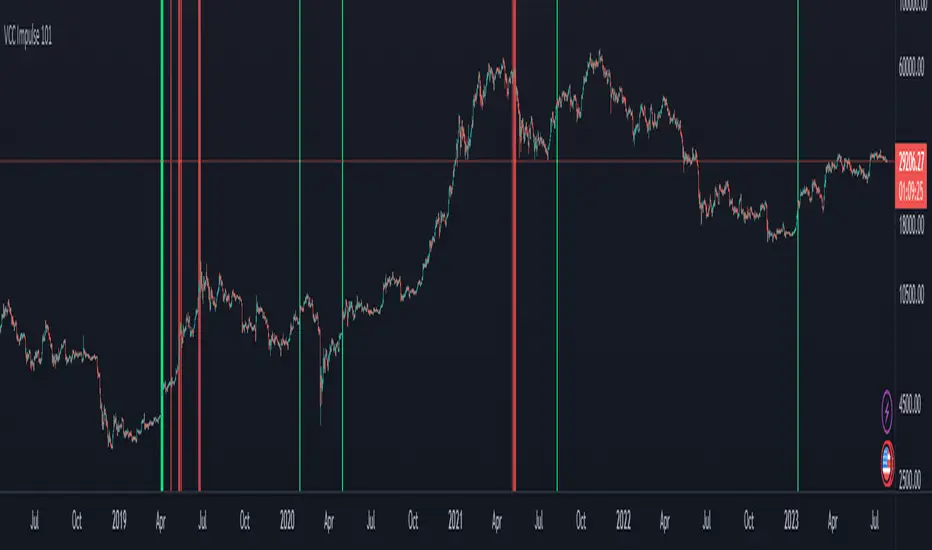
VCC Impulse 101Title = VCC Impulse 101
Version = v1.2.0
Author = Vic Cebedo
A cryptocurrency Buy and Sell signal indicator.
BUY SIGNAL (green background) is triggered if Buy Score (black line) reaches (4) Points.
1 Point is added to Buy Score if:
- The Closing Price is above all Moving Averages (7, 21, 50, 100, and 200), and
- If the 200MA is above the other Moving Averages (7, 21, 50, 100).
1 Point is added to Buy Score if:
- MACD is greater than MACD Signal, and
- MACD is greater than zero, and
- MACD Signal is greater than zero, and
- MACD is greater than previous value.
1 Point is added to Buy Score if:
- SMI is greater than zero, and
- SMI is greater than previous value.
1 Point is added to Buy Score if:
- RSI is greater than 50.
The SELL SIGNAL (red background) is triggered if EITHER Ethereum Sell Score (purple line) OR Bitcoin Sell Score (red line), reaches (-3) Points.
2 Points is deducted from the Ethereum Sell Score if:
- The number of Ethereum Short positions is greater than the Longs.
1 Point is deducted from the Ethereum Sell Score if:
- The Ethereum RSI is greater than 75.
2 Points is deducted from the Bitcoin Sell Score if:
- The number of Bitcoin Short positions is greater than the Longs.
1 Point is deducted from the Bitcoin Sell Score if:
- The Bitcoin RSI is greater than 75.
Análise de Candles
CandleEvaluationLibrary "CandleEvaluation"
Contains functions to evaluate bullish and bearish, engulfing, and outsized candles. They are different from the built-in indicators from TradingView in that these functions don't evaluate classical patterns composed of multiple candles, and they reflect my own understanding of what is "bullish" and bearish", "engulfing", and "outsized".
isBullishBearishCandle()
Determines if the current candle is bullish or bearish according to the length of the wicks and the open and close.
int _barsBack How many bars back is the candle you want to evaluate. By default this is 0, i.e., the current bar.
returns Two values, true or false, for whether it's a bullish or bearish candle respectively.
isTripleBull()
Tells you whether a candle is a "Triple Bull" - that is, one which is bullish in three ways:
It closes higher than it opens
It closes higher than the body of the previous candle
The High is above the High of the previous candle.
int _barsBack How many bars back is the candle you want to evaluate. By default this is 0, i.e., the current bar.
returns True or false.
isTripleBear()
Tells you whether a candle is a "Triple Bear" - that is, one which is bearish in three ways:
It closes lower than it opens
It closes lower than the body of the previous candle
The Low is below the Low of the previous candle.
int _barsBack How many bars back is the candle you want to evaluate. By default this is 0, i.e., the current bar.
returns True or false.
isBigBody()
Tells you if the current candle has a larger than average body size.
int _length - The length of the sma to calculate the average
float _percent - The percentage of the average that the candle body has to be to count as "big". E.g. 100 means it has to be just larger than the average, 200 means it has to be twice as large.
returns True or false
isBullishEngulfing()
Tells you if the current candle is a bullish engulfing candle.
int _barsBack How many bars back is the candle you want to evaluate. By default this is 0, i.e., the current bar.
int _atrFraction The denominator for the ATR fraction, which is the small amount by which the open can be different from the previous close.
returns True or false
isBearishEngulfing()
Tells you if the current candle is a bearish engulfing candle.
int _barsBack How many bars back is the candle you want to evaluate. By default this is 0, i.e., the current bar.
int _atrFraction The denominator for the ATR fraction, which is the small amount by which the open can be different from the previous close.
returns True or false

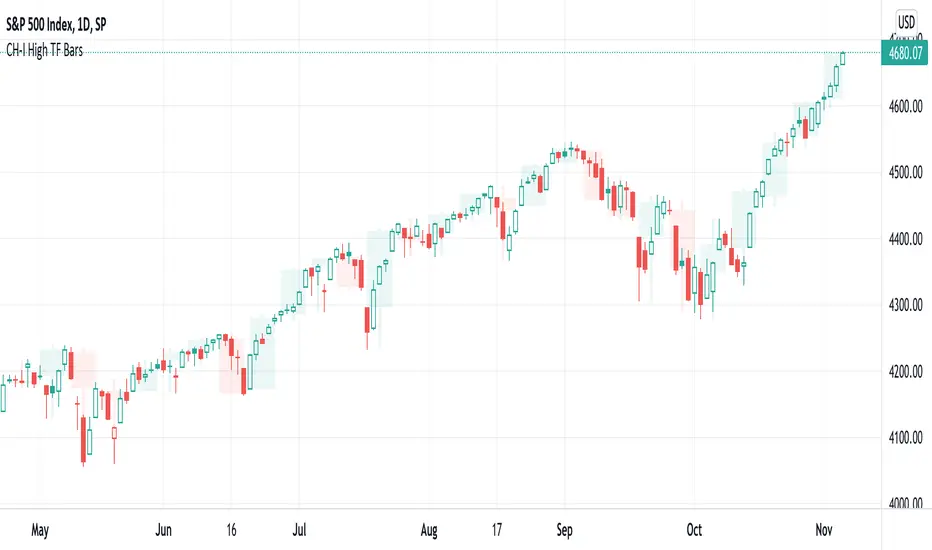
CH-I: Trend - Higher Timeframe BodyI took the script for the built-in indicator for candle bodies of a higher timeframe (www.tradingview.com) which has a fixed border width and style and added the possibility to customize both the border width and the border style or to even disable the display of any border at all, which makes the presentation of those boxes more flexible.
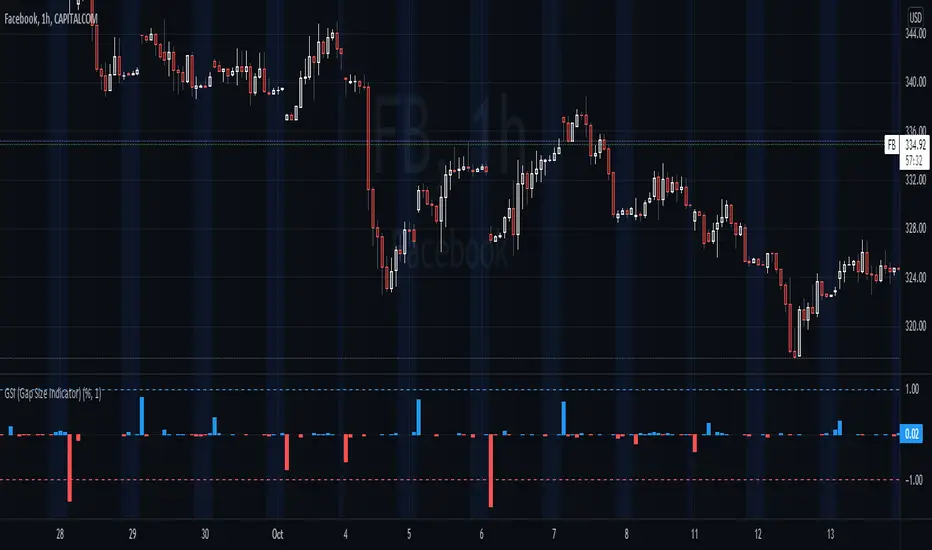
GSI (Gap Size Indicator)The purpose of this indicator is to give a quick view of a gap size between two candles, and to detect any gap bigger than the trigger setting.
Options
Mode: Select the display mode (% or Value)
Variation Trigger: Defines the minimum gap size to give a signal, for both positive and negative sides. This option depends on the Mode setting
Show trigger lines: Enable/Disable the display of the Variation Trigger setting lines
Color signals only: When enabled, bars crossing the trigger value are still colored, but other are gray
Show signals only: When enabled, will only show bars corresponding to gaps crossing the trigger value
Notes
Basic alerts on Bullish , Bearish and All gaps are available.
Feel free to suggest any improvement.
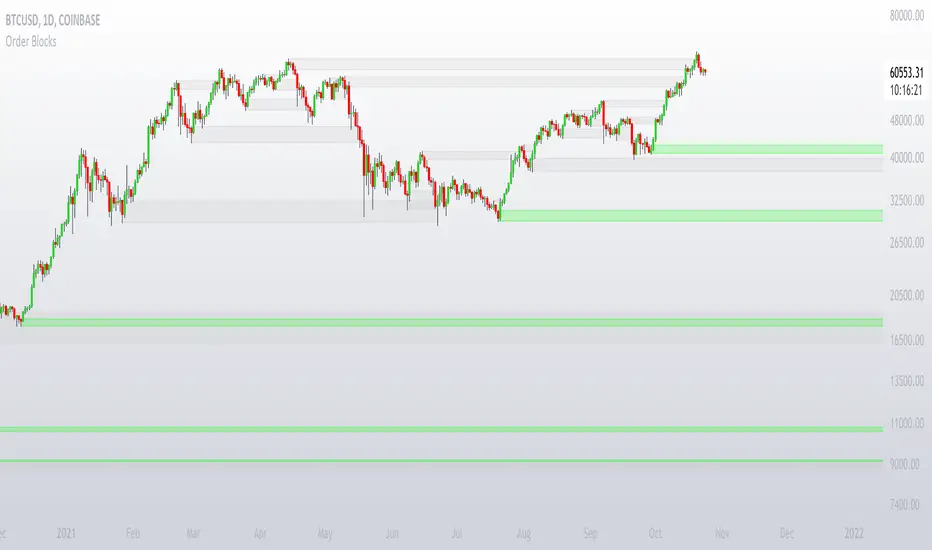
Order BlocksThis is experimental Indicator is to help identifying Order Blocks.
It uses not confirmed higher order pivots as Higher Highs (HH) and Lower Lows (LL), finds high/lows that created most recent LL/HH and in case if this high/low are broken it notes candle that broke structure, market structure broke line (MSB) and demand box (candle that created liquidity for the move that broke structure).
Concepts and parts of code used in this study:
1) @rumpypumpydumpy - Higher Order Pivots
2) @MarkMiddleton2020 - Order Blocks
Compression support&resistance [LM]Hello traders,
I would like to present you Compression support&resistance script. The idea behind is to look for areas of price compression(inside bar candles). Basically the S/R lines are created after three candles that are formed in certain pattern and volume conditions. First candle of pattern is usually the most volatile and fist inside bar after volatile candle high and low creates S/R lines in order to look for breakouts or for future bounces of the S/R line. Also by default volume has to be decreasing from candle to candle, although this condition can be controlled by setting.
It has various settings as my other S/R scripts for multi timeframe analysis. The current timeframe uses line API but for multi timeframe I use plot lines. There are two filters. Volume filter for declining volume of the pattern candles and volatility filter which renders line only in case that pattern occurs after some % change has happened within some lookback period.
Credit also for this indicator goes to @berkek as he took time to explain it to me.
Hope you will enjoy it,
Lukas
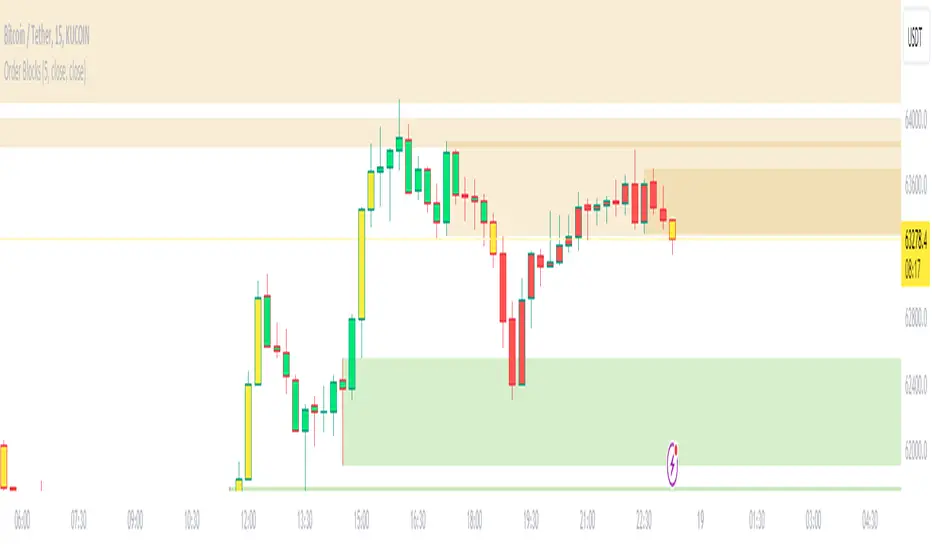
Order BlocksThis script analyses candle stick patterns and draws order blocks in real time, it is designed to be very easy to use and works on all markets.
With a simple sensitivity configuration to control the range of candles in scope for analysis, the order blocks are automatically drawn and removed in real time if price action closes through an order block.
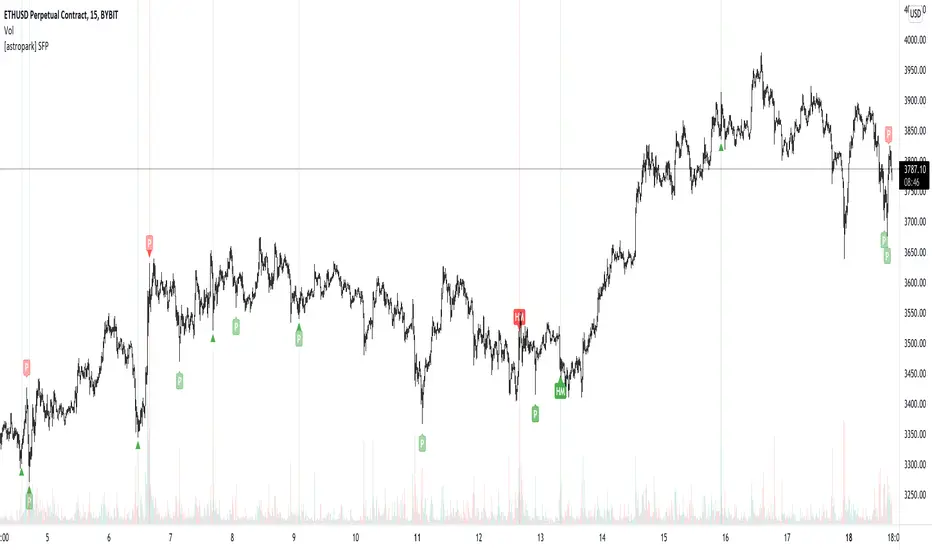
[astropark] SFP - Swing Failure PatternDear Followers,
today I'm glad to present you my Swing Failure Pattern Analyzer indicator.
As you know, the Swing Failure Pattern (SFP) is a very powerful candlestick pattern, because it highlights trend reversal points : if trend changes you want to know it, right?
This indicators highlights for you both Tops and Bottoms , that may be just local or historical.
To build this tool I mixed my experience on the field and some of the logic you can see in the following indicators of mine:
Pinbar that matters
Volume that matters
Volume Analyzer
This indicator works on every timeframe and market , it's quite responsive to market movements so it's especially good on volatile markets.
It is designed for fast day-trading / scalping , but as you trade on high timeframes is great for swing trades.
The indicator identifies candles that fall into the Swing Failure Patter category, but also candles other 4 categories of reversal candlestick pattern:
pinbar / hammer
hanged man
reversal by volume analysis
reversal by candle wicks analysis
Of course you can
customize colors
turn on or off what you prefer to see and what you don't
set alerts everything you see plotted
The indicator does NOT repaint of course.
This is a premium indicator , so send me a private message in order to get access to this script.
M.Right Candlestick Patterns & Bulkowski Percentages 1.0Hello Traders!
As a fan of Bulkowski, I figured I'd release this for everyone's benefit as well.
The legendary candlestick pattern expert, Thomas Bulkowski, has over 35 years of trading and analysis experience and is the absolute go-to expert when it comes to candlestick pattern identification.
Bulkowski Candlestick Percentages from his site and books.
Source: Built in "All Candlestick Patterns"
In this version,
--> Added 8 Candles and removed some that are statistically insignificant and others that Bulkowski doesn't use (can add back if requested).
--> Added 2 Colors for Bullish and Bearish Continuations.
----> Assigned Colors Tested performance to Continuations.
--> Built-in Variables and Candles adjusted slightly to conform to Bulkowski pattern principles.
--> Moved inputs back to ABC order.
--> Decided to leave the theoretical performance positioning for the signal (i.e. Top for theoretically bearish ). However..
----> I adjusted the signal color to match Bulkowski's tested performance.
--> Removed Plot Close (obsolete)
--> Hover over signal to see both Theoretical and Tested Performance.
Figured I'd help give an edge to the @TradingView Community like so many before me have been able to.
Please feel free to add comments, share insight, and of course, like!
Cheers,
Mike

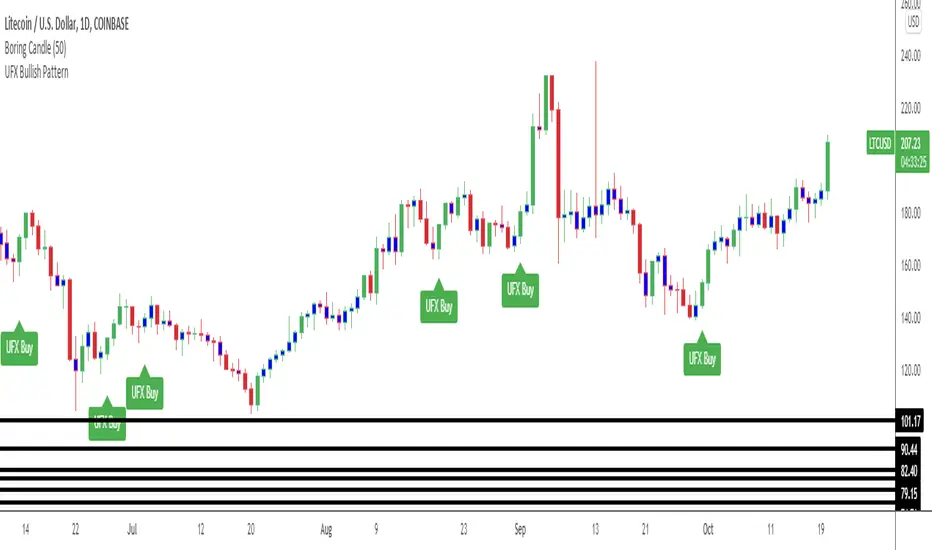
*UFX Bullish Candlstick Pattern*The UFX Buy Patern Must Consist of: Red - Blue - Green Bar or Red - Blue - Blue - Green Bar after a decline in price action.
This indicator also shows Bullish Engulfing Pattern.
The best scalping strategyPullbacks are always the most difficult part of trading, and when this happens, we struggle to make a decision about whether to continue trading and wait for a recovery or reduce losses. Similarly, when the instrument has a good trend, it is often difficult to make a decision if we want to withdraw some profit. This strategy is aimed at facilitating these decisions, it looks for price impulses and, based on this, calculates the pullback of the price at which it is necessary to place limit buy orders (yellow lines) based on Fibonacci levels. We place the stop loss on the red line, on the blue and pink lines it is necessary to put a take profit of 50% each. The entry and exit indicator does not always correctly display the entry and exit points, so it is necessary to work with limit orders.
-In the settings, you can change the number of candles participating in the cycle, if the price is at the same level for a long time and limit orders do not work, then it is recommended to reduce the number of candles.
-The remaining parameters are still under development, it is better not to touch them. In the future, I plan to add a limit on the amount of loss as a percentage, for more fine-tuning of risk management
Откаты всегда являются самой сложной частью торговли, и когда это происходит, мы изо всех сил пытаемся принять решение о том, продолжать ли торговлю и ждать восстановления или сократить убытки. Точно так же, когда инструмент имеет хороший тренд, часто трудно принять решение, если мы хотим снять некоторую прибыль. Эта стратегия направлена на то, чтобы облегчить эти решения, она ищет ценовые импульсы и исходя из этого рассчитывает по уровням фибоначи откат цены, на которых необходимо разместить лимитные ордера на покупку (желтые линии). Стоп-лос размещаем на красной линии, на синей и розовой линии необходимо поставить тэйк-профит по 50%. Индикатор входа и выхода не всегда корректно отображает точку входа и выхода, поэтому необходимо работать с лимитными ордерами.
-В настройках можно менять количество свечей участвующих в цикле, если цена долго находится на одном уровне и не срабатывают лимитные ордера то рекомендуются уменьшить количество свечей.
-Остальные параметры до сих пор находятся в разработке, их лучше не трогать. В дальнейшем планирую добавить ограничение размера убытка в процентах, для более тонкой настройки риск менеджмента

Consecutive Up and Down BarsOVERVIEW
Identify price thrusts made up of at least three consecutive bars that conform to specific criteria. (E.g., consecutive higher closes)
Depending on the context, these powerful thrusts can indicate emerging momentum or exhaustion. This indicator helps to mark these thrusts for further analysis.
CONCEPTS
As mentioned, these consecutive bar thrusts can indicate:
Momentum in the direction of the thrust; or
Exhaustion, implying possible short-term reversal or sideways action.
In the first case, we can track these patterns and their followthrough to determine changes in the market trend.
In the latter case, we can consider an entry by fading the pattern or use it for profit-taking. Price patterns like the Three-Bar Pullback are based on such premises.
There are different conditions used when looking for such consecutive bars. Hence, it's helpful to toggle the conditions while studying this pattern to see which ones work well with your trading approach. This is the primary purpose of this indicator.
This indicator looks for three consecutive bars that conform to the selected condition(s).
These are the conditions you can toggle in this study:
1. Bullish or Bearish Bars
A bullish bar closes higher than it opens. (Green candlestick)
A bearish bar closes lower than it opens. (Red candlestick)
2. Rising or Falling Closing Prices
This condition compares each closing price to the previous closing price.
3. Up or Down Bars
An up bar has a higher high and higher low compared to the previous bar.
A down bar has a lower high and lower low compared to the previous bar.
HOW TO USE
Display
The display is oriented towards traders who are looking to fade these consecutive bars.
Consecutive bars that push higher are marked with a down arrow above the bar.
Consecutive bars that push lower are marked with an up arrow below the bar.
In this implementation, as we are looking for at least three consecutive bars, the arrow marking starts from the third bar of the pattern.
Parameters
Toggle the different conditions that apply when marking consecutive bars. (Conditions as explained above)
Current Close vs. Current Open
Current Close vs. Previous Close
Current High and Low vs. Previous High and Low
You can select one or more of the conditions. By default, all are selected. (If all are unselected, it will mark every single bar and render the study useless.)

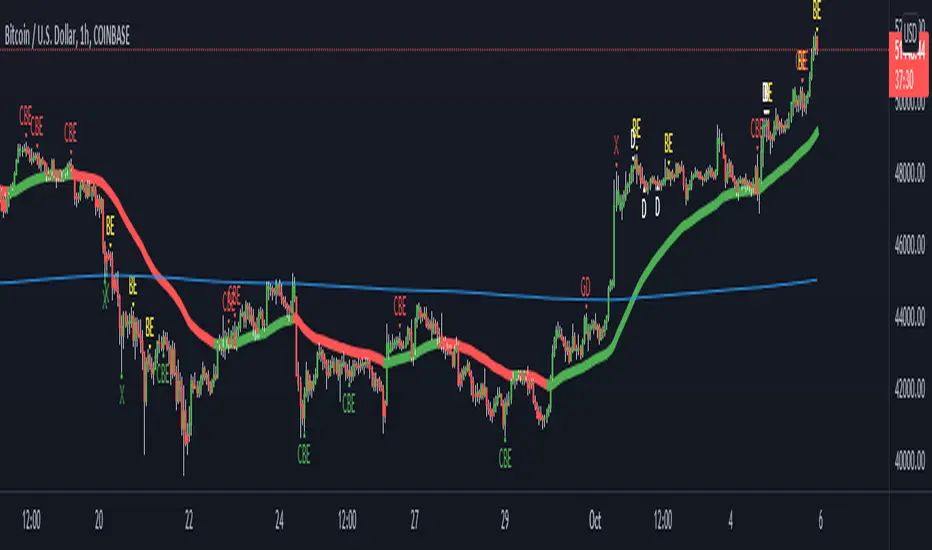
Godson CandleScript Symposium This script is a party of every useful trading indicator i believe in.
The primary signals are candlescript analyses
in order of most useful
CBE: Complete Bullish/Bearish Engulfing
DF/GD: These are Dragonfly and Gravestone Doji's but they also signal Harami's
BE: Bullish/Bearish Engulfing
H: Actual Harami's (these are mean't to be pre-emptive Hedge signals)
D: basic Dojis
these are also two Moving Averages
1Hr ema and 1D ema
doesn't have to be 1Hr/1D but that's the default.
you have 3 choices
A: show all signals
B: only show counter signals(these are bullish signals in a bear market; as defined by price under 1D, and vice versa), this exists for picking bottoms or counter-trend scalping.
C: only show pro trend signals(the trend is your fren... as they say)
only signals that appear 3% away from the mean(1hr ema) are shown, you can change this.
there are also signals that are meant for buying dips and selling rips, these appear when the price action significantly increases the STDEV and the price is far from the mean.
these settings can also be changed
green X: Local Bottom
red X: Locap top
candlecolor if turned on changes the color of the candle when Heiken Ashi open is the High(red) or low(green)
if you want your charts to look exactly like mine, turn off candle body, change wick colors to white and make background gridline 100% transparent.
Classic Candlestick on Range ChartHello traders!
This is my first script to share with everyone! As of right now the range candles on Tradingview are lacking the option to see range charts using the classic candlesticks. This script allows you to overlay a regular candlestick or heikin-ashi candlestick on a range chart!! Unfortunately, the only bar that cannot be a candlestick is the current bar. Once that bar has completed its range then it will update to a regular candlestick.
Install / Use instructions!
-For the best visual appearance it is important to set the transparency of up bars and down bars to 0. This setting is found in the main chart settings under SYMBOL. However, if you want to see the current unfinished range bar you need to set the "projection up bars" and "projection down bars" to the color you prefer.
-To change the colors of the candlesticks is found under the indicator settings like any other script!

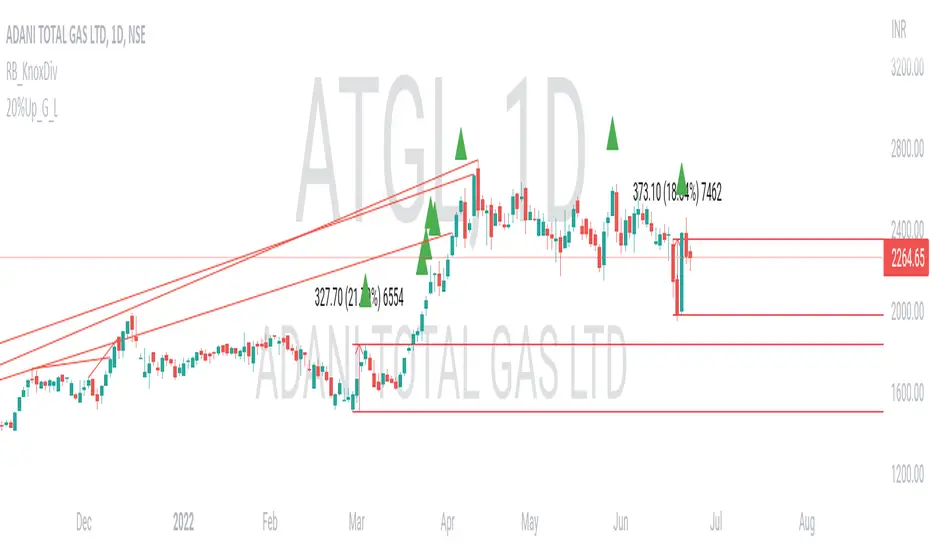
20% up with all continuously green candle: Lovevanshi It can be used to get the indication for 20% up movement among all continuously green candles formed in past. It is suitable for Indian company stock for short term trading plans.
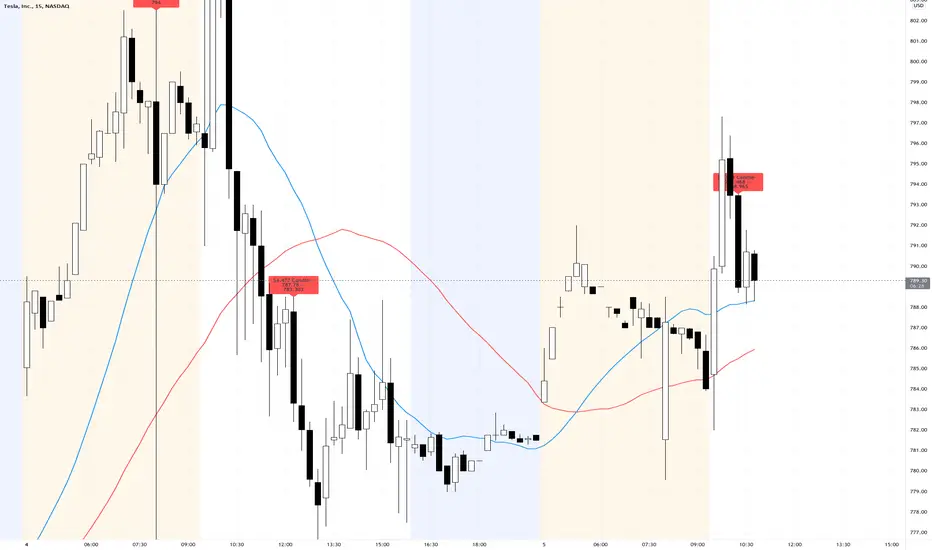
TSLA $4 Red CandleThose who trade TSLA often have come to know that a $4ish red candle on the 15min chart is normally a sign of a trend reversal to the downside by the market makers. To help identify these with ease this script will label any candles that close red with a $4.00 -> $4.99 price gap.
Aurora CandleThe indicator is derived from the concept of Aurora Candles (Credit to RK Arora)
Description
The script instantly calculates and highlights the largest candle (from high to low) in a user specified lookback period. It then plots the expected support, resistance, supply and demand levels. When a larger candle is printed, it will immediately plot the new levels.
How To Use
Use the indicator to find the largest candle in a specified lookback period.
• As soon as the Aurora candle is printed, future levels are plotted.
• If a larger candle is printed it will reset and create a new roadmap as big money dictates the market.
• The Aurora candle will mirror itself above and below X amount of times based on your settings.
• Colours, levels and lookback period are customizable.
• There is only 1 look back period. You can add more than one indicator if you want to set different lookback periods for long and short term levels.
Access the indicator
• Contact me on TradingView

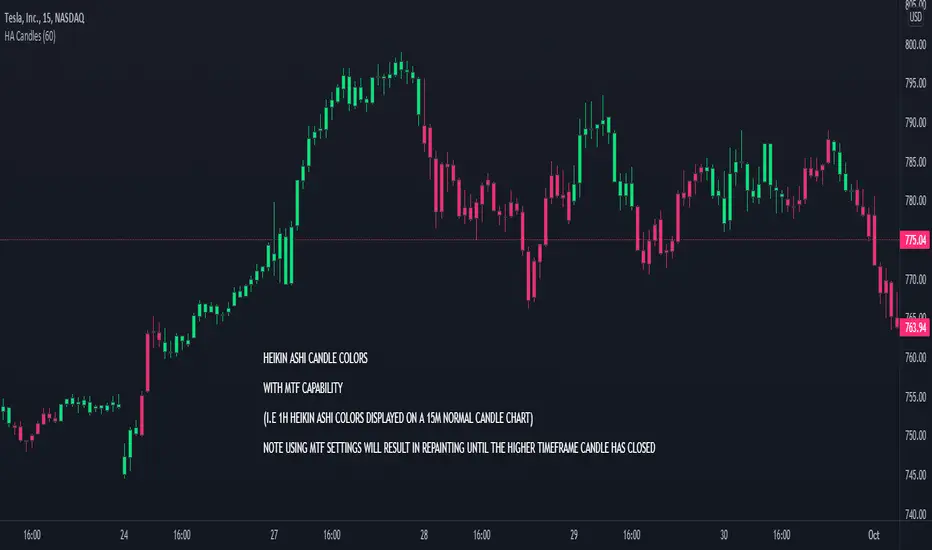
Heikin Ashi Candle RecolorA NRTH_ Technical Indicator Study
Comes included with the Premium Package.
Indicator features
MTF Capability
Custom Candle Colors
Use standard candles while following the Heikin Ashi Trend
Usage Tips
Works on all timeframes and markets, you can view the HA Candle color for the same of your chart or for higher timeframes.
(NOTE: Using MTF Candles does cause Repainting until higher timeframe candle closes)
-------------------------------------------
Disclaimer
Copyright NRTH_ Indicators 2021.
NRTH_ and all affiliated parties are not registered as financial advisors. The products & services NRTH_ offers are for educational purposes only and should not be construed as financial advice. You must be aware of the risks and be willing to bear any level of risk to invest in financial markets. Past performance is not necessarily indicative of future results. NRTH_ and all individuals associated assume no responsibility for your trading results or investments.
All investments involve risk, and the past performance of a security, industry, sector, market, financial product, trading strategy, or individual’s trading does not guarantee future results or returns. Investors are fully responsible for any investment decisions they make. Such decisions should be based solely on an evaluation of their financial circumstances, investment objectives, risk tolerance, and liquidity needs.
4 SMAs & Inside Bar (Colored)SMAs and Inside Bar strategy is very common as far as Technical analysis is concern. This script is a combination of 10-20-50-200 SMA and Inside Bar Candle Identification.
SMA Crossover:
4 SMAs (10, 20, 50 & 200) are combined here in one single indicator.
Crossover signal for Buy as "B" will be shown in the chart if SMA 10 is above 20 & 50 and SMA 20 is above 50.
Crossover signal for Sell as "S" will be shown in the chart if SMA 10 is below 20 & 50 and SMA 20 is below 50.
Inside Bar Identification:
This is to simply identify if there is a inside bar candle. The logic is very simple - High of the previous candle should be higher than current candle and low of the previous candle should be lower than the current candle.
If the previous candle is red, the following candle would be Yellow - which may give some bullish view in most of the cases but not always
If the previous candle is green, the following candle would be Black - which may give some bearish view in most of the cases but not always
Be Cautious when you see alternate yellow and black candle, it may give move on the both side
Please comment if you have any interesting ideas to improve this indicator.

Price Action: Inside Bar BoxesThis script automatically draws rectangles around bars inside IB pattern.
Note :: because Pinescript does not allow changes to already drawn charts on historical bars, checkbox "show only last box" doesn't work for arrows

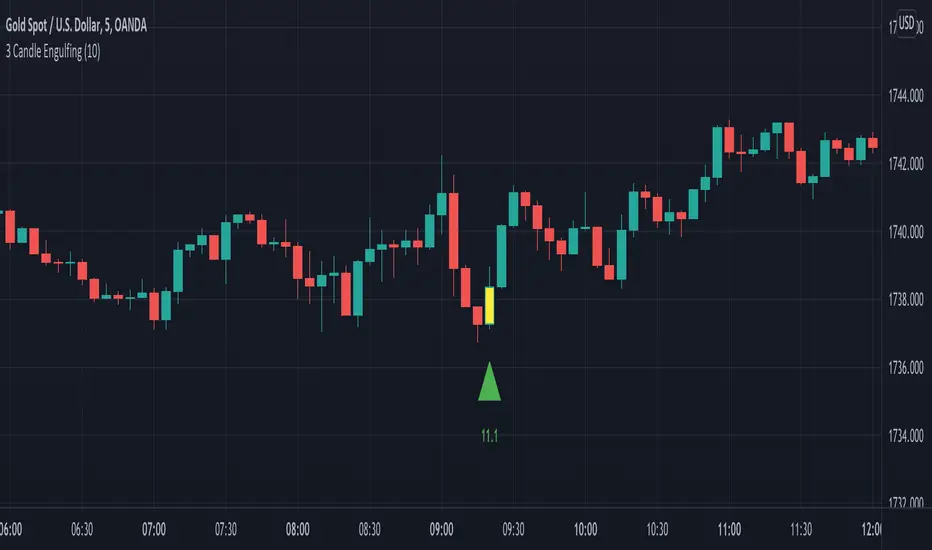
3 Candle EngulfingThree Line Strike Candlestick Pattern (3 candle Engulfing pattern) to help you detect sniper entry point mostly for (forex)
You can use this as an indicator to detect an entry point for your trade.
Please cross-check the Macro and Micro trend and don't go against the trend. Also use other indicators to confirm your entry.
You can set the engulfing minimum pips value (Default is set to 10 pips)
How it works:
Yellow candle with an up green triangle means a long entry
White candle with a down green triangle means a short entry
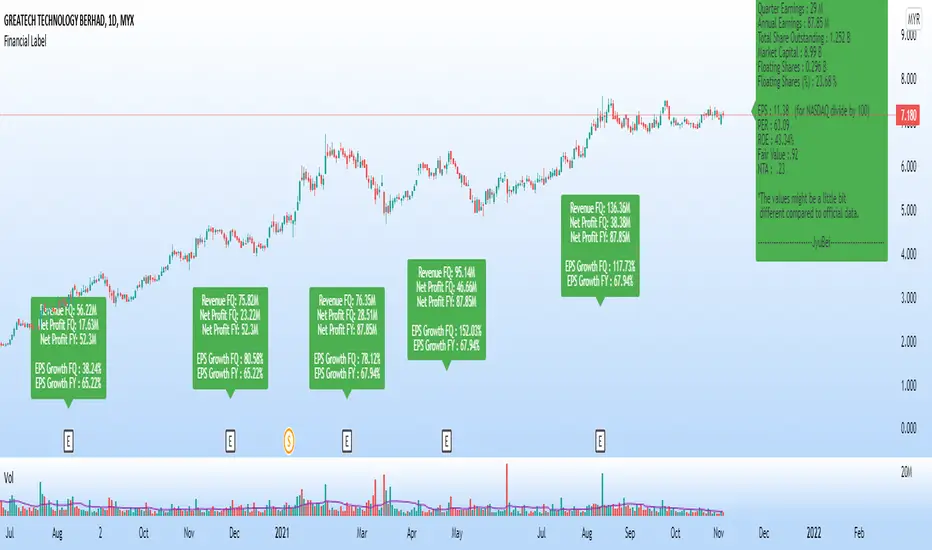
Financial Label
5 Magic Numbers, C, A & S (for CANSLIM) in 1 label.
This label shows:
1. Latest Quarter Earnings (QR)
2. Annual Earnings (AR)
3. Total Share Outstanding
4. Market Capital
5. Floating Shares
6. Earning per Share (EPS)
7. Price per Earning Ratio (P/E Ratio @ PER)
8. Return On Equity (ROE)
9. Fair Value (FV)
10. Non Tangible Asset (NTA)
This label will show the data only on charts that have financial data only.
Warrants, futures, crypto, etc. will not have any display on this label.
Suitable for all markets including US, Asia, Europe and others.
Thus, no currency symbol ($,¥,€, RM, etc.) will be displayed, only numbers.
Green label means EPS is positive - profitable company.
Red label means EPS is negative - loss making company.
Note:
1. The values might be a little bit different from official data, due to type of data taken & calculations, as we have a few formulas for each data.
2. Please confirm more accurate data from your trusted and official source of data.
Special Time PeriodWith this indicator, you can choose candles in the period you want on your chart.
How ?
• If your chart is 5 minutes, the duration should be greater than 5 on this indicator.
If you do not do it this way, there will be gaps in the price, it will not give the right result.
• If you want to see it in minutes, you must enter a direct numerical value. For example, to see 2 hours, you must enter the number 120. Because 2 hours is 120 minutes.
Like the warning above, if you want to plot a 2-hour chart with this indicator, a maximum of 1 hour should be selected on your main chart.
• Resolution, eg. '60' - 60 minutes, 'D' - daily, 'W' - weekly, 'M' - monthly, '5D' - 5 days, '12M' - one year, '3M' - one quarter
• For example, if you want to see the 2-day chart, you should have a maximum of 1 day chart open on your home screen and write "2D" to the indicator value.
• You will get much better results if the period on your main chart and the period on this indicator are multiples of each other.
• In the image below, the period on the main chart is 30 minutes, but the period on the indicator is 90
• Click on the facing brackets at the top right of the legend and your chart will enlarge.
