Simple Buy and Sell SignalsThis is a Simple Indicator which shows buy and sell signals based on MACD and SSL channel.
It is not a Holy Grail Indicator. It shows a lot of false signals when the market is Consolidation Zone.
So don't use this indicator to place trades based on signals given by the indicator.
Use this as a confluence along with your technical analysis
On lower timeframes there are a lot of signals so to eliminate false signals , get a signal on higher timeframe and place a trade in the direction of the trend on lower timeframe.
Hope you'll find this helpful. Enjoy👍.
Buysignal
TriexDev - SuperBuySellTrendMinimal but powerful.
Have been using this for myself, so thought it would be nice to share publicly. Of course no script is correct 100% of the time, but this is one of if not the best in my basic tools.
Two indicators will appear, the default ATR multipliers are already set for what I believe to be perfect for this particular (double indicator) strategy.
If you want to break it yourself (I couldn't find anything that tested more accurately myself), you can do so in the settings.
Basic rundown:
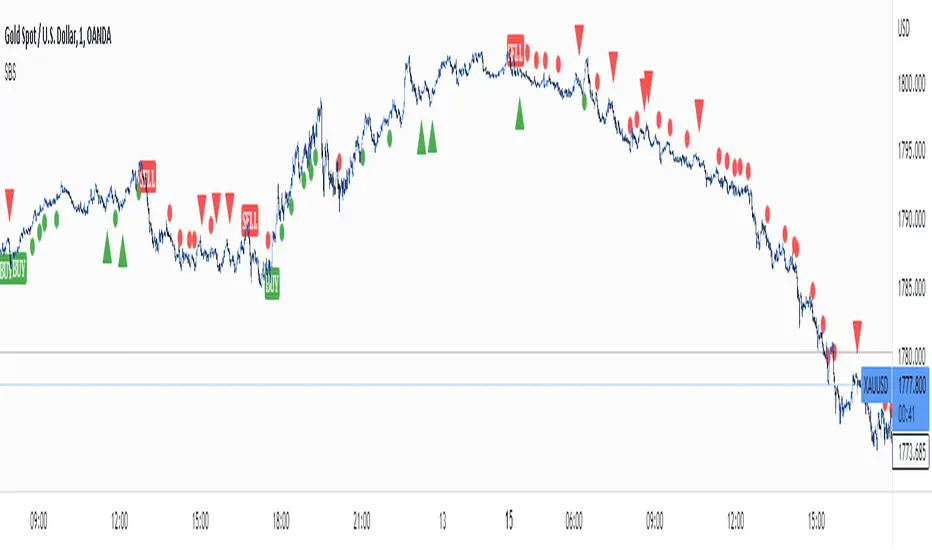
A single Buy/Sell indicator in the dim colour; may be setting a direction change, or just healthy movement.
When the brighter Buy/Sell indicator appears; it often means that a change in direction (uptrend or downtrend) is confirmed.
You can see here, there was a (brighter) green indicator which flipped down then up into a (brighter) red sell indicator which set the downtrend. Once you understand the basics of how it works - it can become a very useful tool in your trading arsenal.
Typically I will use this and other indicators to confirm likeliness of a direction change prior to the brighter/confirmation one appearing - but just going by the 2nd(brighter) indicators, have found it to be surprisingly accurate.
Tends to work well on virtually all timeframes, but personally prefer to use it on 5min,15min,1hr, 4hr, daily, weekly. Will still work for shorter/other timeframes, but may be more accurate on mid ones.

RPS OscillatorGood day to everyone!
How RPS Oscillator is different and useful while taking positions?
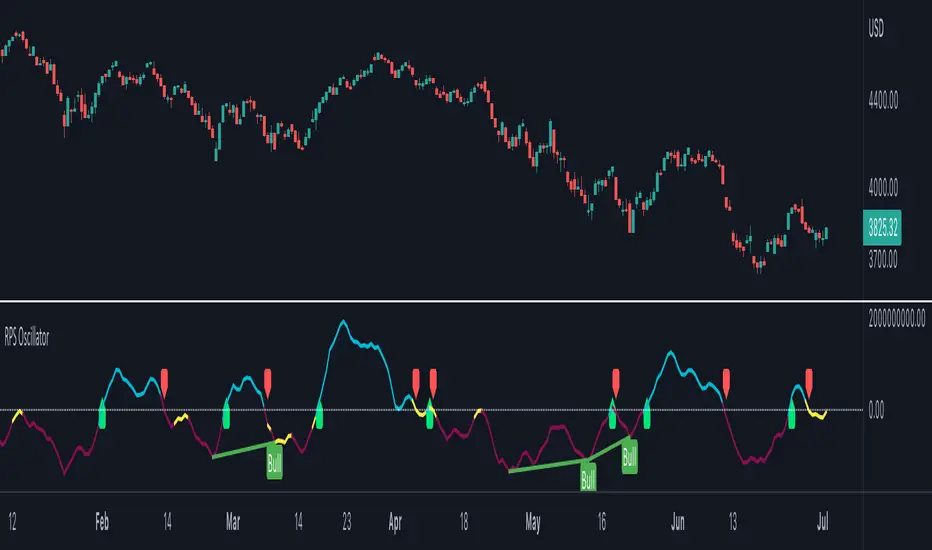
RPS Oscillator is a volume weighted oscillator which provides major buy/sell signals (Look for Green Up and Red Down Signals).
Users can enable to show leading (minor) buy/sell signals (Look for small Green/Red Circles). By default, it's disabled to avoid too many calls.
How to take trades using RPS Oscillator?
RPS Oscillator has a moving average with three colors.
Aqua - Uptrend
Yellow - Probable Trend Reversal or Major Volatile Move Coming
Red - Downtrend
How to find the strength of the trend using RPS Oscillator?
The uptrend is strong when you see the moving average in aqua color moving upwards.
The downtrend is strong when you see the moving average in red color moving downwards.
Avoid take any positions when the moving average is going sideways.
How to use the divergence in the RPS Oscillator?
The Bullish divergence gives the alert for the trend reversal to the upside.
The Bearish divergence gives the alert for the trend reversal to the downside.
The Hidden Bullish divergence gives the alert for the trend correction to the upside.
The Hidden Bearish divergence gives the alert for the trend correction to the downside.
How to get notified through RPS Oscillator without keeping eyes on the charts?
You can configure alerts for major happenings in the oscillator.
Major Long/Buy Signal
Major Short/Sell Signal
Bullish Divergence
Bearish Divergence
Hidden Bullish Divergence
Hidden Bearish Divergence
~RPS~
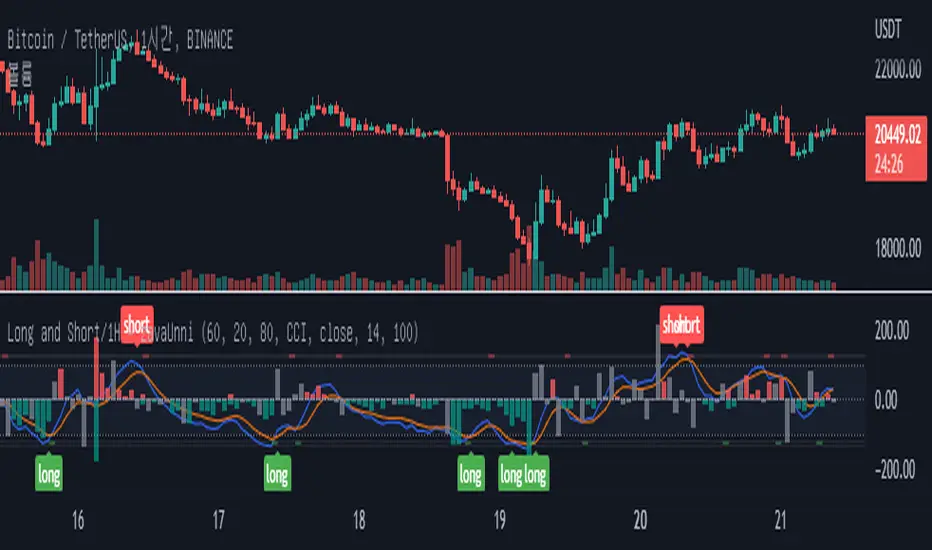
Long and Short Signal_1hours [zavaUnni]This indicator is available in the 1 hour chart.
The Stochastic value of 1 hour of 3 types of length was requested, summed, and then the value was derived.
The blue line is the K and the orange line is D of the Stochastic.
The default is Stochastic, but when RSI is selected in the settings, it can be viewed as the relative strength index of the Stochastic.
If the K value crosses down at 100, a short signal is generated
Cross up below -100 and you'll get a long signal.
You can receive a ready signal by checking Position Ready in Settings.
Short ready signal when the k line goes up to 100.
Long ready signal when the k line goes below -100.
A small spread value of the candle relative to the volume is the principle that resistance has occurred.
Displayed the resistance value based on the average value of the last 100 candles.
The higher the value of the red Histogram, the stronger the selling.
The lower the value of the green Histogram value, the stronger the buying .
The gray histogram is when there's no buying or selling pressure.
Buy/Sell SignalsThe indicator is built using Supertrend, RSI, and Ema Crossovers.
What is the best way to use the indicator?
Indicator can be used in two ways:
First : If a signal appears on the chart, you can enter immediately the stoploss is the candle's low with a Small Buffer.
Second: you will get good results if you plot additional indicators like as volume, RSI and so on for additional confirmation to get better results

TUE ADX/MACD Confluence V1.0The ADX and MACD confluence can be a powerful predictor in stock movements. This script will help you find those confluences in an easy to understand visual manner.
It includes Buy and Sell signals for detected confluences, and will show colored candles to help you determine when to exit a trade. When the candles turn to white that means the detected confluence is no longer in play and you may want to consider a trailing stop loss.
The Buy and Sell signals will display on the first occurrence of each confluence.
It's important to understand that both of these are lagging indicators, but with a careful attention to your stoploss you can easily generate a positive profit factor.
This code is provided open source and you're free to use it for any purpose other than resale.

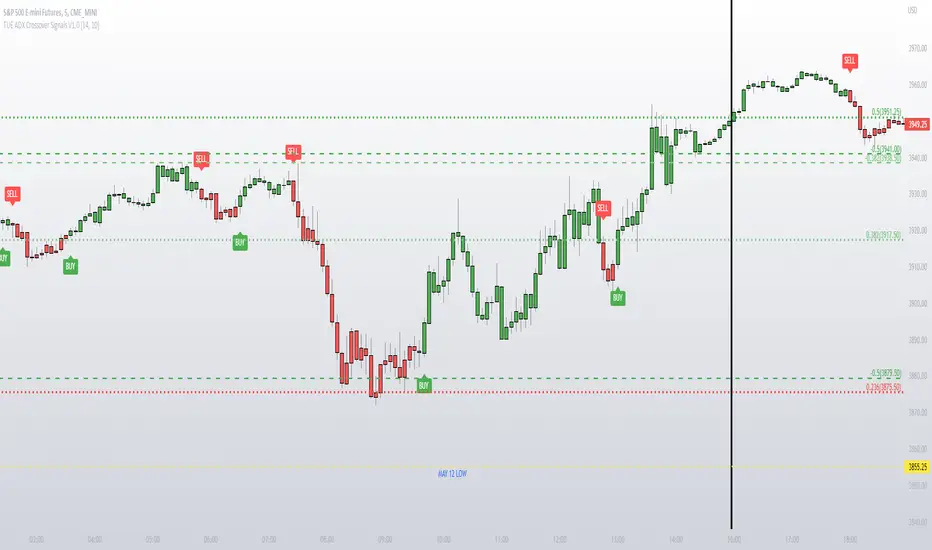
TUE ADX Crossover Signals V1.0This simple indicator gives you a way to visualize ADX crossovers on your chart and is a good companion if you like to trade with the ADX.
Green candles have a DI+ over DI- crossover, and vice versa for the red candles.
It gives you the ability to turn on and off BUY and SELL signals generated from the ADX crossovers.
Code is provided open source, feel free to use it for any purpose other than resale.
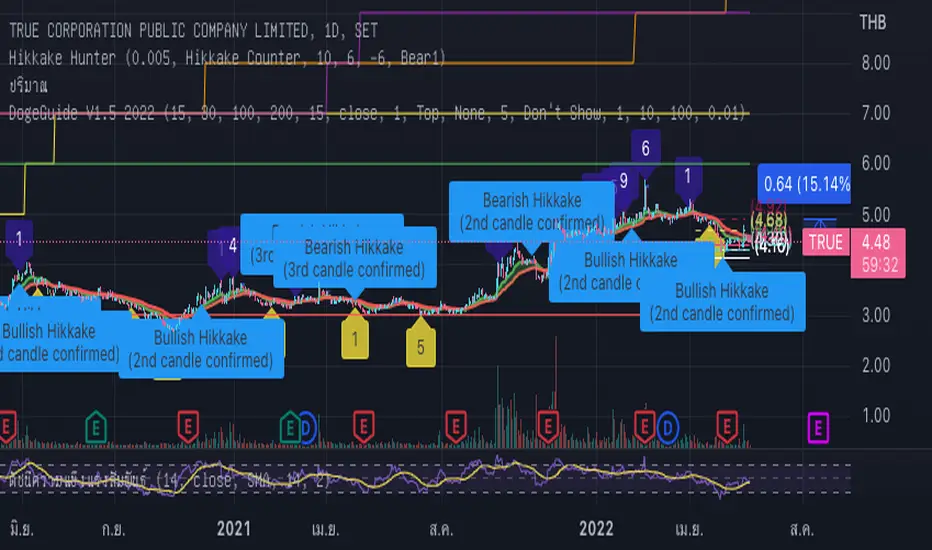
DogeGuide V1.5 2022## DogeGuide V1.5 ## Pine Script V5
This is a very simple indicator that will provide users with a way to see EMAs
(exponential movingaverages), Includind the highlight between two EMA lines,
which are 15 and 30 lines.
EMAs are very strong support and resistance indicator to guide user though these tool by
fixed and default settings. And, easy to customize later are the main goal of this indicator.
## Easy to use for beginer ##
The EMA lines are given as common numbers, 15, 30, 100 and 200.
also user are allow to turn on one additonal line themselves.
the ribbon will show up/down trend based on EMA highlighten background for easy understanding.
In addition , Support and Resistance dot are added to help user to get the idea of where they are now.
whether to exist or not (just a tool to help you make decision).
There is a Buy/Sell label based on technique above, MACD and SET:SET Divergence signal.
Also, there is a small circle label to help with reading the buy and sell signal.
## Note ##
The indicator is set to work best with 1 day time frame.
RSI and Volume will help a lot to make a decision.
Trend MasterThis is a trend aggregator for confirmation and trend signals. It basically aggregates many buy/sell signals and confirmation and by combining them provides a strong buy/sell signal or trend confirmation.
The actual layout idea and trend confirmation is derived from Trend Meter and this indicator uses few other indicator, such as Chandelier Exit, WaveTrend, QQE Signals, Parabolic SAR and AlphaTrend. This indicator aggregates signal from different methods to find out more powerful and confirmed Trend and combines them into one Signal. It also uses Technical Ratings from TradingView team to filter out false signal, it tremendously opts out false signals and improve profitability.
The first seven dots are these
All 3 Trend Meters Now Align
MACD Crossover - Fast - 8, 21, 5
RSI 13: > or < 50
RSI 5: > or < 50
MA Crossover
MA Crossover
Chaikin Money Flow
Alphatrend
Technical Ratings
Then trend
Chandelier Exit
WaveTrend
QQE Signals
Parabolic Sar
All 3 Trend Meters aligns and A signal from trend i
Instructions
Change buy/sell policy based on market trend
Works on all TimeFrame but gives more accuracy on 4H, 1D.
Buy when green big dot appears at the bottom.
Sell when red big dot appears at the bottom.
Red/green dot at the top line appears when three trend meter is aligned and this is a good confirmation.
Any red/green dot below horizontal bars are trend signals.
Big red/green got at the bottom appears whenever there's a good confirmation from trend meter and a buy/sell signal comes from any trend signals.
Also look on the technical ratings bar, green means buy, red means sell and yellow means neutral.
Look for Support or Resistance Levels for price to be attracted to.
Find confluence with other indicators.
The more Trend meters are lit up the better.
Alert
01 Buy Signal = Strong Buy Signal
02 Sell Signal = Strong Sell Signal
03 Buy Signal = Strong Buy Signal
04 Sell Signal = Strong Sell Signal
Thanks to TradingView Technical Ratings authors, evergot, Lij_MC, KivancOzbilgic for their work. This indicator was heavily inspired from their work.

KISS BOT (Keep It Simple BOT)A very simple script that can be used for Futures and Options Trading - for stocks, crypto, forex etc.
The script includes usage of following public scripts:
1. Super Trend
2. Linear Regression
3. Exponential Moving Average
Concept, we are using three EMA, with source High, Low, and Close. We want to buy or sell when there is a crossover of third EMA (fastest) over first and second respectively.
E.g. the default values are EMA 13 High, EMA 13 Low and EMA 5 Close, we will get Buy signal when EMA 5 crosses over EMA 13 High and we will get Sell signal when EMA 5 crosses under EMA 13 Low.
Super Trend settings are made for Looking for Buy or Looking Sell, so that we focus on the trend. Trend is your friend.
Buy Trigger Line and Sell Trigger Line are just indication of using Trigger Line, buy is when EMA 5 crosses EMA 13 Low and Sell When EMA 5 Crosses EMA 13 High
The Tunnel or Band highlighted is the no trade zone for us and we do not want to trade side ways market.
Inside Bars are shown in Yellow, these candles do not qualify for any trade decision.
Outside Bars are shown in Pink, these candles do not qualify for any trade decision


Deadly Trio V2.0Overview:
This is a fully featured StochRSI, RSI & Bollinger Bands customisable indicator with custom conditions and alerts that can be taken advantage of using automated solutions such as Autoview, 3Commas or using it alongside/testing BUY/SELL conditions against your favourite markets to maximise gains. Finally you can use this a standalone manual general purpose signals indicator to scalp or accumulate your chosen market.
Time Frame:
This Indicator is specially customize for 5min time frame, but you can use it on Higher Time Frames as well, such as 15min, 1hr, 4hr and 1Day.
How to Use:
Long Position:
When the RSI is in Oversold (below 30) in 5min time frame, and Deadly Trio shows BUY Signal, then enter in the trade with long position.
Take Profit for Long Position:
When the candle touches the middle line (White Line) then it will be consider as the Target 1 Hit. When the candle touches the Upper Band then it will be consider as the Target-2 Hit. Always book some profit on Target-1. To play safe, you can close your trade in profit when the Target-1 Hit.
Short Position:
When the RSI is in Overbought (above 70) in 5min time frame and Deadly Trio Indictor shows SELL Signal, then enter in the trade with short position.
Take Profit for Short Position:
When the candle touches the middle line (White Line) then it will be consider as the Target 1 Hit. When the candle touches the Lower Band then it will be consider as the Target-2 Hit. Always book some profit on Target-1. To play safe, you can close your trade in profit when the Target-1 Hit.
How to do DCA (Dollar Cost Averaging):
If you want to maximize your profit, or you want to exit your trade always in profit then DCA (Dollar Cost Averaging) is very necessory. For DCA, always buy in parts. If you are in Long Position and another BUY signals appears on Deadly Trio, then Buy some more as per your financial conditions. Same condition apply for Short Position when SELL signal appears.
When to EXIT the Trade:
If you are in Long Position/Short Position and SELL / BUY Signal appears on the candle then close your Long Position/Short Position. You can also use this condition as a STOP LOSS.

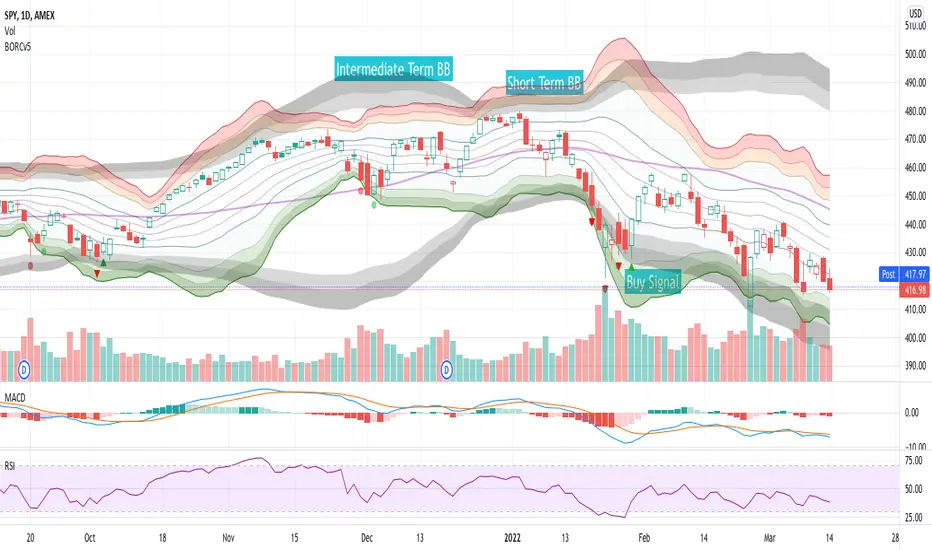
BORCv5: Breakout Reversal, Standard Deviation & Bollinger Bands
The BORCv5 (Breakout Reversal Confirmation) script can improve your trading by visualizing the standard deviation lines & bollinger bands on your chart, along with breakout reversal early warning and confirmation signals which can be interpreted as buy/sell signals.
- BORCv5 utilizes multi-period Bollinger Bands & custom signals to paint a clear picture of price movement.
- BORCv5 works on everything: Futures, Equities, Indices, Crypto, and on any time interval.
The purple line represents the simple moving average (SMA) for the period (default: 20). You can use the EMA instead if you prefer via settings.
The Bollinger bands & trend lines tell you if the stock is trading "high" or "low" relative to its recent price action.
- The inner green/orange/red bands represent short term Bollinger Bands: 1 Standard Deviation (SD), 2SD, 3SD and 4SD
- The grey bands represent intermediate term Bollinger Bands.
The width of the bands changes due to volatility. Narrow Bollinger Bands represent low volatility, where price is relatively flat or trending slowly in one direction. Wide open Bollinger Bands signify either high volatility OR trending powerfully in one direction. If the Bands are pointing downwards it is a bearish trend and if the Bands are pointing upwards it is a bullish trend.
It is important to get the right amount of data (or context) for Bollinger Bands: Too small of a period for basis (5,8,10) and you won't have enough data (or context). Too high of a period and you will have too much data (or context). The right amount of data (or context) is also important because you want to follow averages that algos & other traders follow and you want the Bollinger length to give you enough data to see various standard deviations. Too low of a Bollinger length means the bands deform too easy & too high of a Bollinger length means they are too flat, making the data hard to interpret. We like 20 periods as a compromise between not enough & too much data but you can adjust this value in the script settings.
Breakout Reversal Confirmation Signals:
Pay attention to the triangles: they represent the price movement action of the larger period Bollinger Band that will filter out most of the false breakouts.
Triangles pop up when the price breaches the 2.9 standard deviation, meaning we're in an extreme range leading to a continuation or reversal.
Red Triangle:
- Pointing Down => Bearish Breakout has occurred, watch for a Bullish Reversal
- Pointing Up => Bullish Breakout has occurred, watch for a Bearish Reversal
Green Triangle:
- Pointing Down => Bearish Reversal is confirmed, price has a high chance to move Bearish
- Pointing Up => Bullish Reversal is confirmed, price has a high chance to move Bullish
Red Circle:
- Weak Bearish / Bullish Breakout
Green Circle:
- Weak Bearish / Bullish Reversal Confirmed
For more information, see the BORC PDF guide and examples !
PS: This script was originally published by reaganmcf and has been upgraded to Pine v5.
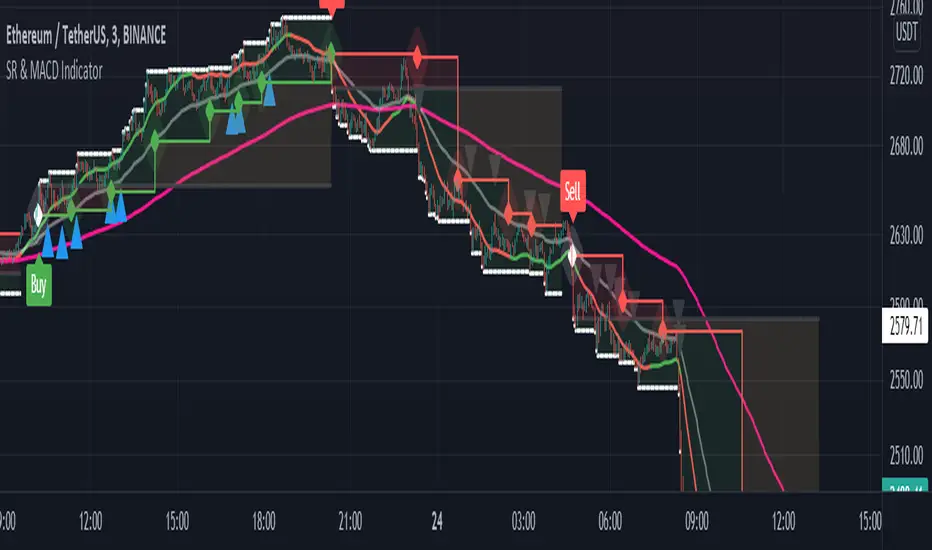
Support and Resistance with MACD IndicatorOriginal script from ©akpaswaniitk. I just added MACD to filter out bad trades and alert function so that we get notified whenever indicator gives us an entry signal. Most of the false breakout has been removed but the remaining ones only pop up during consolidation, so it's wait for the retest before entry. Works better in continuous market. Also look at the color of EMA for further confirmation, only focus on buy side when EMA is green and sell when EMA is red or when after the buy signal EMA changes color from red to green. These are the highly profitable setups I've found with this indicator.
Signals
Red or Green solid line with diamond are trailing stoploses
dotted black line is entry level
dotted white line is optimal exit
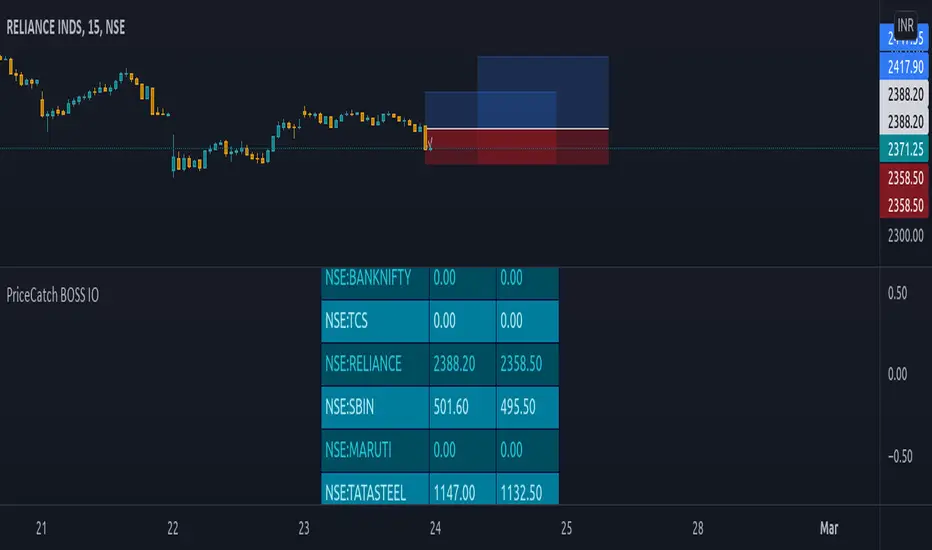
PriceCatch BOSS IOHi TradingView Community.
I am publishing a script that uses a proprietary logic based on Fibonacci retracement for identifying breakouts. This is a script that focuses on long side trades only.
PriceCatch BOSS IO: - PriceCatch Breakout Screener Script (Invite Only).
This script is not an indicator that plots anything on the chart but is a Screener.
SLIPPED OPPORTUNITIES
One of the problems faced by traders is that while they are watching or studying the chart of one stock or Forex pair, a super opportunity slips by them in another stock or another instrument and it is frustrating when that happens. With the PriceCatch BOSS IO script, you can now capture such moves made by other symbols whilst you are watching some other instrument.
USP:
The uniqueness of this script is that you can screen Nine of your favorite symbols for breakout opportunities simultaneously.
Users can pick Nine symbols of their choice and specify a resolution in the Settings dialog screen that the script will use to find out any probable breakouts in those selected nine symbols continuously.
The symbols could be from any exchange across the world and of any type - stocks, futures, commodities, Forex and Crypto. Simply put, if you can plot the symbol in TradingView, PriceCatch BOSS can monitor that instrument for breakouts on the time interval chosen by you.
ACTIONABLE INFORMATION:
What traders look for and expect from their charts is actionable information. This script does that. It clearly tells you the Entry Price and Stop Loss price for each symbol when a breakout opportunity presents itself in that symbol. You can then open up the chart of that specific symbol to validate the given information with any other indicators that you use and then take the call with regards to a trade. You may also use this script alone without adding any other indicator to your chart. The choice is yours.
CLARITY BEFORE TRADE:
As both Entry Price and Stop Loss Price are identified by the script, you receive advance information about the risk and can set your own Reward based on your personal preferences. So, with the necessary information provided to you in advance, you can plan your trades with clarity.
HOW IT WORKS:
Once the list of symbols are selected and resolution chosen, the script then continuously monitors those given symbols for breakout opportunities. At the close of every interval, it presents the results as shown below:
Results Set
This script shows the results of the screening in a Table as under:
SYMBOL Entry Price Stop Price
TSLA 830.84 802.88
EURUSD 1.13425 1.13160
Similarly for seven more instruments chosen by you.
NOTE: 0.00 under Entry and Stop price columns mean that there is no opportunity in that symbol.
ADVANTAGE:
The advantage of this script is that it helps you spot trades in your favorite symbols without manually loading their charts. With the ability to screen the symbols from Intraday time frames to higher time frames such as Weekly, you will be able to spot opportunities to go long in intraday, swing and even positional trades of longer duration.
Another significant advantage of this script is that while you may be watching a symbol in, say 15 minutes time frame, you can set the script to monitor breakouts in any other higher time frame starting from 15 minutes. This, in effect, gives you unsurpassed advantage.
DISCIPLINE:
As you choose your nine instruments/assets, the script indirectly inculcates discipline as your attention will be only on the selected instruments and you will not be distracted or search for opportunities in a whole bunch of other symbols / assets / instruments. As you can at any time change the set of nine assets as per your personal preference, you get the flexibility that you seek to work with a different set of symbols. For Forex traders who like to monitor only Major Pairs the ability to scan Nine pairs is quite sufficient. Similarly, to traders who trade S&P500, ES1! and other instruments, the nine symbols flexibility is adequate.
LONG POSITION TOOL
For visual cues, you may use the Long Position tool to set the Entry, Stop and Targets as per your preference on the main chart.
TRICK:
Can I only screen nine instruments? What if I am interested to screen more? Actually, you can screen more instruments. You see, you can add this script on to your chart multiple times and can select a set of nine unique stocks per script instance. That way you can actually screen more than nine stocks!
EXAMPLES:
Nifty 50
TSLA
Maruti
USDJPY
MSFT
UI
The script allows you to fine tune display options as per your personal preferences.
NOTE: This script runs in a separate pane without obstructing the view of your main chart.
NOTE: The formatting of price is based on mintick. As a result, since Forex and Crypto have more number of digits after the Decimal, if your screener list consists of a mix of stocks, Forex and Crypto - please change to a Forex chart to get the correct Forex price and to Crypto for correct Crypto price and so on.
NOTE: You will not get accurate results if you are in a higher time frame chart and the Screener resolution is set to lower time frame. For example, if chart is in 15 MTF and Screener resolution is set to 3 MTF, the results may not be accurate.
TIP: If you have added this script multiple times to your chart, then you may have to maximize the pane to view the results table.
NOTE - PRIOR TO USING THIS SCRIPT:
Please remember that the script is shared with absolutely no assurances about usability and any warranties whatsoever and as a responsible trader, please satisfy yourselves thoroughly and use it only if you are convinced it works for you. Remember, you are 100% responsible for your actions and must, therefore, do your due diligence before using this script and also before every trade. Profits and losses are part and parcel of trading activity and you are solely responsible for both. If you understand and accept that, you may use the script.
QUERIES/FEEDBACK
Please PM me.
Hope you find this script useful. Wish everyone all the best with trading.
Buy / Sell indicator light version [Crypto_BCT]The indicator is based on the search for the lowest bars in a given period (can be customized).
You can add a search for the highest bars to determine the closed order points.
You can add a filter by the value of the RSI (you can customized it separately for buying and selling).
Alerts for buying and selling are set.
It can be used to work with bots, for example 3COMMAS DCA bot.
--------------------------
Signal Condition Settings:
(Buy) Lowest Bar
The closing of the current bar is lower than the closing of the bars back in this range
(Buy) RSI value <
The RSI index is below this value
(Sell) Highest Bar
The closing of the current bar is higher than the closing of bars in this range
(Sell) RSI value >
The RSI index is higher than this value

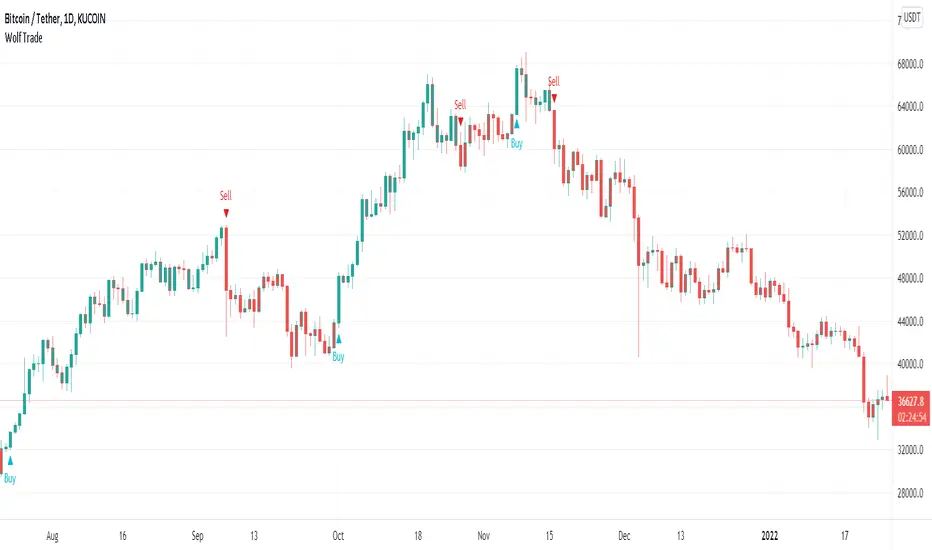
Wolf TradeWolf Trade indicator designed to help you develop your own trading strategy and give you that extra confirmation on your trade ideas. This indicator helps you to identify the right buying or selling opportunity. Examines several items to issue a buying or selling position. For example, it checks the status of the RSI , as well as the status of the MACD , as well as the status of the stochastic . Checks the order of placement of the EMA and the condition of their cross with ATR. And uses the ATR for stop loss.
Wolf Trade indicator commodities on all timeframes including 1m, 3m , 5m, 15m, 30m, 1H, 2H, 4H, 1D, 1W, etc. Definitely, the performance of this indicator is much better in 1, 2, 4 hours and daily timeframes, but that does not mean you can not use it in shorter time frames.
This indicator is does not repaint and works on any market internationally including crypto, stocks, forex, futures and currencies. You can utilize our indicator for scalping, swing trading, holding or even for trading options as well.
Buy / Sell alert indicator [Crypto_BCT]Hello everyone!
I bring to your attention a indicator to determine the point of buy and sell purchase.
It is based on oscillators and a moving average.
It can be used to work with bots, for example 3COMMAS DCA bot.
Signal Condition Settings:
ATR
The current candle is larger than the ATR for this period
EMA
The signal is necessarily below (for buy) and above (for sell) the EMA of the specified period
(Buy) RSI low
The RSI index is below this value
(Sell) RSI High
The RSI index is higher than this value
(Buy) MFI low
The MFI index is below this value
(Sell) MFI High
The MFI index is higher than this value
(Buy) CCI low
CCI index is below this value
(Sell) CCI High
The CCI index is higher than this value
(Buy) Lowest bar from
The closing of the current bar is lower than the closing of the bars back in this range
(Sell) Highest bar from
The closing of the current bar is higher than the closing of bars in this range
(Buy) Lowest EMA bar ago
During a given distance back, the EMA value only decreased
(Sell) Highest EMA bar ago
At a given distance back, the EMA value only increased
I hope it will be useful!

Buy alert [Crypto_BCT]Hello everyone!
I bring to your attention a simple indicator to determine the point of purchase.
It is based on oscillators and a moving average.
It can be used to work with bots, for example 3COMMAS DCA bot.
Signal Condition Settings:
ATR
The current candle is larger than the ATR for this period
EMA
The signal is necessarily below the EMA of the specified period
MFI low
The MFI index is below this value
CCI low
CCI index is below this value
RSI low
The RSI index is below this value
Lowest bar from
The closing of the current bar is lower than the closing of the bars back in this range
Lowest EMA bar ago
During a given distance back, the EMA value only decreased
I hope it will be useful!

Long Term Buy/Sell Signal by BonyThis script attempts to use Exponential Moving averages (short-term and long-term convergence) of different lengths in order to identify trade entries and exits for bullish & bearish trades. I would strongly recommend using this as a guide to enter or exit long-term swing trades on growth names such as Apple, Tesla, Microsoft to keep your emotions out of the trading. You use this script by entering a trade when it signals a green BUY signal with a UP arrow and exiting when it signals red. The general idea is that one is fast and one is slow-moving EMA and these indicate when to buy/sell when they crossover the overbought/sold lines.
Disclaimer:
This script is for educational purposes only. The market is always moving up or down, so always trade with caution and use your best judgment for every trade.

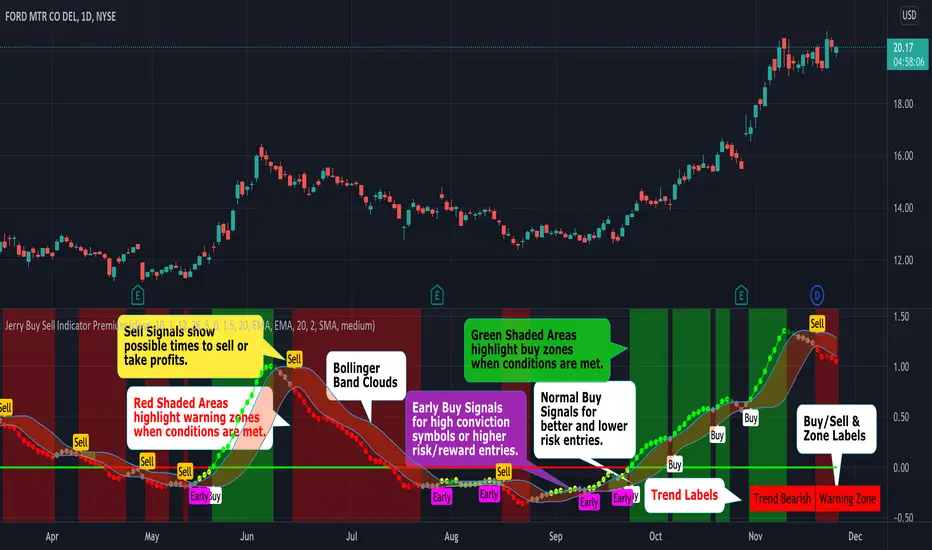
Jerry Buy Sell IndicatorThis indicator has unique conditions in the script that create the following:
1. Buy and Sell zones
2. Early Buy, Buy and Sell signals that are determined by conditions including relative position to the zero line.
3. Defines 6 different short term trends
4. Trend Labels to show the current short term trend (located in the lower right corner).
5. Buy, Sell, Buy Zone & Warning Zone Labels
6. 14 user controlled inputs allow the user to customize the settings.
7. Unique functionality that allows you to create trade alerts based on conditions being met with criteria scans built into the indicator.
# 7 is a cool unique feature of our indicator. For example you can easily create a TRADE ALERT for a symbol based on a Buy Signal being met in any time frame. This is possible because we have built into the script the ability to select multiple conditions including BUY ALERT, EARLY BUY ALERT AND SELL ALERT. You can also use the alerts to scan your stocks individually for buy zones and warning zones or for crossing above or below the clouds. TradingView alerts can notify you via pop-up, email, sound notification, email to SMS & sound notifications.
Buy Sell Indicator Features
----- Trends
- Red Dots (Red Cloud) = Warning zone. Generally do not buy or consider selling.
- Dark Red Dots = Warning BUT Improving. Things are getting better.
- Grey Dots = Neutral. No clear short term trend.
- Yellow Dots = Early. Great for high conviction stocks but early for the main buy signal.
- Dark Green Dots = In the buy zone but losing strength.
- Green Dots (Green Cloud) = Trend is bullish & stock is in the buy zone.
- Trend Line = Shows the prevailing direction of price and if the momentum is beamish, bullish or neutral.
----- Buy & Sell Signals
- Early Buy Bubble= The first day the Early Buy signal is triggered. Early Buy Signals occur below the zero line and are higher risk/reward. This is a unique feature of this indicator.
- Buy Bubble = Indicator Buy Signal Triggered. Buy Signals occur above the zero line.
- Sell Bubble = Indicator Sell Signal Triggered.
----- Ways To Use The Indicator
1. Buy/Sell during with the main buy and sell Alerts in the Buy (green shaded) and Warning (red shaded) zones.
2. In The Red You’re Dead. Most buy signals happen outside of the red warning zone. There are exceptions like reversals and momentum squeezes.
3. Buy Sell Indicator can be used by itself or with other indicators (Momentum Dream works well)
4. Use Red and Green Clouds/Shading to assist with position direction. In the buy zone look to go long. In the red zone generally do not add to your position or consider selling.
5. Use Red Clouds to tighten stops or close positions.
6. Customize the indicators to vary the results by selecting Wilders, SMA, EMA, WMA, and HullMA moving averages.
7. The early buy signal/bubble appears on the chart the first day the early buy signal is triggered and can be used for entry into high conviction stocks or if you want to take a higher risk/reward trade.
8. The standard buy signal is shown when conditions have been met to indicate a better buy entry point with less risk.
Disclaimer: The information contained in our scripts/indicators/ideas does not constitute financial advice or a solicitation to buy or sell any securities of any type. We will not accept liability for any loss or damage, including without limitation any loss of profit, which may arise directly or indirectly from the use of or reliance on such information. All investments involve risk, and the past performance of a security, industry, sector, market, financial product, trading strategy, or individual’s trading does not guarantee future results or returns. Investors are fully responsible for any investment decisions they make. Such decisions should be based solely on an evaluation of their financial circumstances, investment objectives, risk tolerance, and liquidity needs.
Please Use the link below for more information.
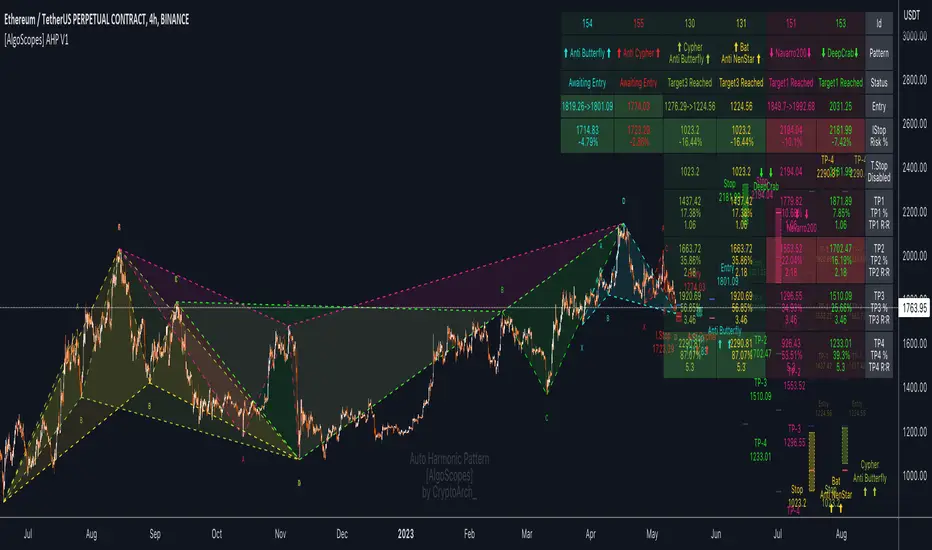
Auto Harmonic Pattern - PRO [AlgoScopes] V1Harmonic Patterns is a powerful tool for identifying potential reversal areas in the financial markets. Auto Harmonic Pattern Pro it is based on the work of Scott Carney, a renowned trader and author who developed the concept of harmonic patterns.
Scott Carney's extensive research and contributions have greatly enhanced our understanding of market patterns and their application in trading. Auto Harmonic Pattern Pro is adapted from Scott Carney's original work on harmonic patterns, as well as other sources that have contributed to the recognition and understanding of harmonic patterns beyond Carney's initial research.
Auto Harmonic Pattern Pro offers traders a valuable tool for identifying potential reversal zones in the markets. We would like to express our gratitude to Scott Carney for his pioneering work in developing harmonic patterns, as well as to the various contributors and sources that have expanded our knowledge and understanding of harmonic patterns beyond Carney's original research.
Remember to always practice proper risk management and combine the indicator's signals with other technical analysis tools for a comprehensive trading approach.
For more information about Scott Carney and his work on harmonic patterns, you can find additional resources on his official website.
💠 ABOUT THE SCRIPT
💎 DISPLAY
⚬ The following things are displayed by default on the chart
🔸 Live patterns in trade with XABCD labels. (filled major triangle)
🔸 Entry, Stop and Target levels on chart for all live patterns. Target level are dimmed along with reducing size when they become irrelevant
🔸 Open Trades Stat table - Show patterns ID, patterns name, status for patterns, size&age, Entry, I.Stop, T.Stop and Targets (TP1 - TP4).
⚬ Highlighted present stop (and/or trailing stop if is enabled) and next target
⚬ When there are multiple patterns on chart, Entry, Stop, and Target labels & lines & PRZ* boxes are created with specific distance from each other to provide clarity to the users
*(potential reversal zone)
⬜ SETTINGS
⚬ Let's talk about some of the settings. Almost all of these settings have already been optimized and tested over time, but for some tickers it might be better to do a new test.
💎 ZIGZAG
🔸 Length - Default is set to 8. User can change settings but it is a good idea to keep with fibonacci (5, 13, 21, 34, 55 etc)
🔸 Depth - This setting is for how many pivots indicator scan to find harmonic pattern. By default it is set as 200
🔸 Recursive Algorithm - Enabled will use recursive instead standard zigzag
💎 HARMONIC PATTERN SETTINGS
🔸 Trade Direction - Default is set to show all (bearish and bullish) harmonic patterns. Can be filtered to bullish or bearish direction.
🔸 Error Percent - Default is 8. That is error percent tolerance from perfect pattern ratio.
🔸 Maximum patterns - Maximum patterns allowed on chart at any time
⚬ When it reaches the maximum patterns and the indicator finds a new one, the old patterns will be removed
- (important for algo traders because alerts for those removed patterns will no longer be a trigger)
🔸 Pattern size
⚬ Without filter will show all patterns (regardless of size)
⚬ Show only patterns for user preference size (no more two patterns because is smaller of 280 bars)
🔸 External Filter - It can be used to filter harmonic patterns. You can build your own custom trend based scripts and use it with AHP to filter trades.
⚬ The structure of the external script must be
1 for Long/Bullish patterns
-1 for Short/Bearish patterns
2 for all (Long and Short patterns)
0 Trade is not allowed
🔸 Filter Pattern Starts
⚬ When Filter starts is enabled pattern will start for logical pivot (see example)
⚬ Disabled filter will show more patterns (still can be very profitable)
💎 STOP & ENTRY & TRAILING STOP
🔸 Trail Entry Price - If Entry is still not reached and the price is still in PRZ zone, at the new high/low will adjust Entry.
⚬ Open Stats table will show the first Entry (when patterns were found) as well as the last corrected Entry (when patterns reached Entry level).
⚬ Disable this option Entry will remain at the level when patterns are found.
🔸 Enable Targets (awaiting entry) - enabled will show potential Targets for "awaiting entry" patterns (not active patterns because they have not yet reached Entry).
⚬ The Open stats table will show all other information, risk %, R:R etc).
⚬ Risky trade but with very good R:R (not recommended for inexperienced traders, very high risk of trading hitting Stop before reaching a Target)
🔸 Stop Distance - By default is set to 5. That is percent from the last low/high when the pattern reaches Entry. Stop trail from price till pattern reached Entry level.
🔸 Entry Distance - By default is set to 16. Same for SL that is percent distance from live price. You can increase/decrease percent but remember you have to give space between live price and the entry.
⚬ If entry is close to price, trade will become active too quickly
⚬ Remember if you change Stop Distance as well as Entry Distance to check Risk : Reward (recommended R:R for the first target is about 1:1)
🔸 Trailing Type - Options for trailing type, Continuous, Stepped, Breakeven and Disabled.
⚬ Continuous - When the price reaches "Trailing Active" (initial level for activating the trailing stop), T.Stop will start from Entry or Initial Stop (based on "Trailing Starts") and follow the price by Distance or Percent (based on "Trailing by").
- example one (trailing starts from Initial Stop when TP1 reached by distance/price on picture 1 and by percent on picture 2)
- example two (trailing starts from Entry when TP1 reached by distance/price on picture 1 and by percent on picture 2)
⚬ Stepped - when price reaches Trailing Active (initial level for activating the trailing stop), T.Stop will move to the previous level
- (If "Trailing Active" is set to Target2, then T.Stop will move to Target1 when price reached TP2)
⚬ Breakeven - when price reaches Trailing Active (initial level for activating the trailing stop), T.Stop will move to Entry and stay there the entire time for that harmonic trade
- (till reached all targets or reached T.Stop)
🔸 Trailing Active - When will the Trailing Stop be activated ("Trailing Type" must be enabled)
🔸 Trailing by - Distance or Percent
⚬ Distance - T.Stop will follow live price by initial distance
⚬ Percent - T.Stop will follow live price by initial percent
🔸 Trailing Starts - Entry or Initial Stop
⚬ Entry - T.Stop will start trailing from Entry level
⚬ I.Stop - T.Stop will start trailing from initial Stop level
- (Check Continuous picture for information)
💎 TARGET
🔸 Base - The level from which the calculation for Targets is made.
🔸 Target 1/Target 4 dropdown - Targets are set by default and set in the dropdown most often used for those targets.
🔸 Target 1/Target 4 custom - If the desired ratio is not in the dropdown, then it is possible to manually enter the desired ratio.
⚬ (If you want to change some of the targets, maybe to confluence with support/resistance)
💎 PATTERNS
🔸 Harmonic Patterns Type
⚬ Enable/Disable harmonic patterns by Type of patterns (for Classic and Anti patterns)
⚬ By default all patterns are enabled (for standard patterns). Users can control and select/deselect all Classic, Anti or Non Standard patterns but also disable individual patterns.
⚬ For some patterns (like Shark and Navarro 200) we change PRZ or place in different Type groups. That is just cosmetic things.
🔸 Classic - This includes all and most popular Harmonic Patterns.
⚬ Gartley (Type I)
⚬ Bat (Type I)
⚬ Butterfly (Type II)
⚬ Crab (Type II)
⚬ Deep Crab (Type II)
⚬ Cypher (Type II)
⚬ Shark (Type III)
⚬ Nenstar (Type IV)
🔸 Anti Patterns
⚬ Anti Nenstar (Type I)
⚬ Anti Shark (Type II)
⚬ Anti Cypher (Type II)
⚬ Anti Crab (Type II)
⚬ Anti Butterfly (Type III)
⚬ Anti Bat (Type IV)
⚬ Anti Gartley (Type IV)
⚬ Navarro 200 (Type IV)
🔸 Non Standard -
⚬ White Swan
⚬ Black Swan
⚬ 3 Drive
⚬ Anti 3 Drive
⚬ Wolfe
⚬ Snorm
⚬ 121 Pattern
⚬ 5-0 Pattern
⚬ Sea Pony
⚬ Leonardo
💎 PATTERN DISPLAY OPTION
🔸 Pattern Lines Size - thickness for harmonic patterns
🔸 Pattern Lines Type - type for harmonic pattern lines (solid, dotted, dashed)
🔸 Fill XAB/BCD - major harmonic triangle
🔸 Fill ABC/XBD - minor harmonic triangle
🔸 Enable XABCD Label - labels for harmonic pattern
🔸 XABCD Label Size - size for harmonic xabcd labels
🔸 Enable Ratio Label & Line - lines and labels that connect harmonic patterns levels and that show the patterns ratio
🔸 Ratio Label Size - ratio labels size
⚬ Lines for pattern ratio are set by default dashed and can’t be changed.
💎 PRZ & ENTRY | STOP | TARGET SETTINGS
🔸 Entry & Stop & Target Labels - by default is set to small (opt small & normal)
🔸 Entry & Stop & Target Lines - by default is set to show lines & labels & price (opt lines & labels & price or lines & labels or disable all)
🔸 PRZ Box size - size in bars for PRZ box
⚬ Added option when it is not readable on chart pattern names or entry/stop/targets offset
⚬ Maximum (last pattern) can be drawn up to 500 bars in future or you will get error for script (use this option only when you need)
🔸 PRZ Box Type of Spacing - distance between PRZ boxes. "Auto" will make the maximum distance when there are more than 3 patterns on the chart for better visibility
- (the maximum can be projected up to 500 bars in the future)
🔸 PRZ Box Manual Spacing - manual distance between PRZ boxes if is “PRZ Box Type of Spacing” set to manual
💎 STATS AND DISPLAY
⚬ These settings can be used to manage display of open and close statistic tables
🔸 Open Trades - By default is enabled and set to the top right position.
🔸 Closed Trades - By default is disabled and set to bottom left position.
⚬ The size of the table can be changed (by default it is set to small)
🔸 Enable Tool Tip for Table - can be enabled/disabled. Shows important information for each section related to Open or Closed tables.
⚬ Recommended enabled until everything related to tables is understood, and later disabled (it starts to get annoying when you accidentally cross the tables with the mouse and tooltip box pop up)
💎 OPEN STATS
🔸 Percentage - show percentage for Targets and Stops
🔸 Risk/Reward - show patterns risk to reward for each Targets
🔸 Size/Age - show patterns size (from X to D in bars) and patterns age (distance in bars when patterns “In Trade”)
🔸 Live % & R:R - enabled will show live % and R:R if you take trade in that moment
💎 CLOSED STATS
🔸 Percentage - show stats by percent instead of numbers
🔸 Display Mode - Closed trade table have three display option, Compact, Detailed and Selective
⚬ Compact - show stats for Long/Bullish and Short/Bearish patterns
⚬ Selective - show stats just for active patterns
⚬ Detailed - show stats for each enabled patterns
- All stats is for “Backtest Bars” if enabled.
- I removed some things from the previous indicator (R:R as well as trailing R:R and win rate) because I think they are not relevant in Closed Table for trade or for statistics (Open Table have that)
💎 PATTERN | CHART COLOR THEME
⚬ By default it is set to Light color theme. Color theme will affect pattern lines, XABCD labels, ratio lines and label, entry/sl/targets labels and text in the open statistics table.
🔸 Dark Theme / Light Theme - Users can change any default individual color for dark or light theme (transparency too).
⚬ Light/Dark Theme suits dark or light chart background or user can change all color to preferred trade style.
⚬ Users have extra control to change all color to preferred trade style.
💎 ALERTS
⚬ Alerts - These settings help users to choose the type of alerts they want to receive.
🔸 New - New Harmonic Pattern is identified
🔸 Entry - Harmonic Pattern reached Entry level
🔸 Target 1/Target4 - Alert when patterns reached on of Target levels
🔸 Closure - Harmonic Pattern trade is closed. Reached all Targets or Stop or Trailing Stop (if is enabled)
🔸 Long & Short placeholders - Enabled will change for alerts Bullish/Bearish text for Long/Short text
⚬ example of custom alerts with some placeholders
💎 BACKTEST WINDOW
🔸 Backtest bars - Enabled will scan patterns for that bar range (default is set to 5000)
🔷 TOOL TIP
⚬ In setting you have help from tooltip to give you almost all this information for easy understanding. Hover mouse above tool tip and windows with info will appear.
⚬ On the chart, tool tip is added for each individual Harmonic pattern to show extra information (pattern ratio, type of harmonic and where often that pattern appears in Elliott wave fractal)
⚬ Tooltip for tables will also provide all the information related to Open and Closed tables. Disabled tooltip for tables will hide all information, but the tooltip for patterns will still remain.
🔴 Possible Errors
⚬ If a mistake is made in the settings and, for example, TP2 is set to 0.618 ratio and TP3 is changed to 0.5 ratio
- (the larger target is set to a smaller ratio than the smaller target), a red text will appear over most charts to indicate the error.
⚬ If Trailing Type is enabled and "Trailing Active" and "Trailing Starts" are set to the same level (Entry), a red text will appear on the charts to indicate an error
- (change "Trailing Active" to a higher level, TP1, or lower "Trailing Starts " to "I.Start")
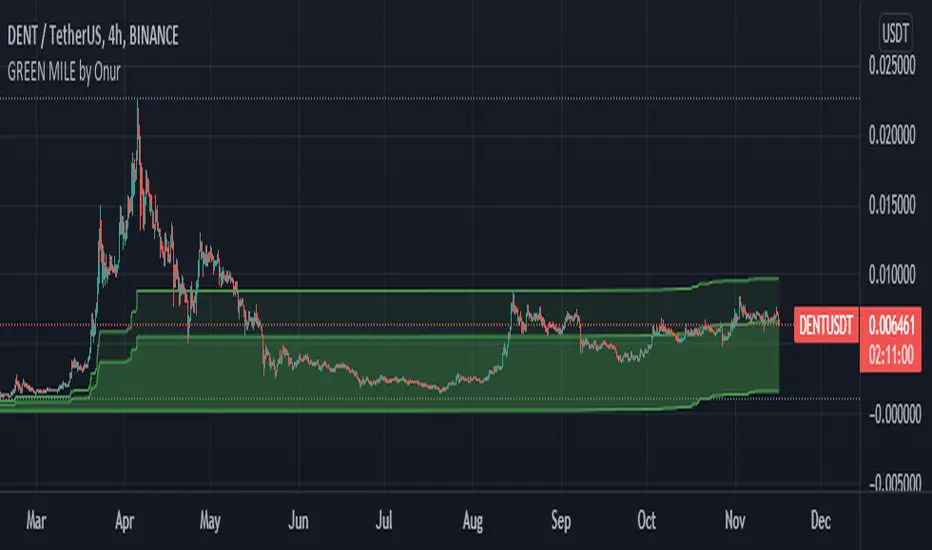
GREEN MILE by Onur This indicator shows fibonacci buying levels due to the past 1500 (adjustable) candles. Prices in the dark green area is a strong buying signal.
more effective with 15m and 240m.