BTCUSD
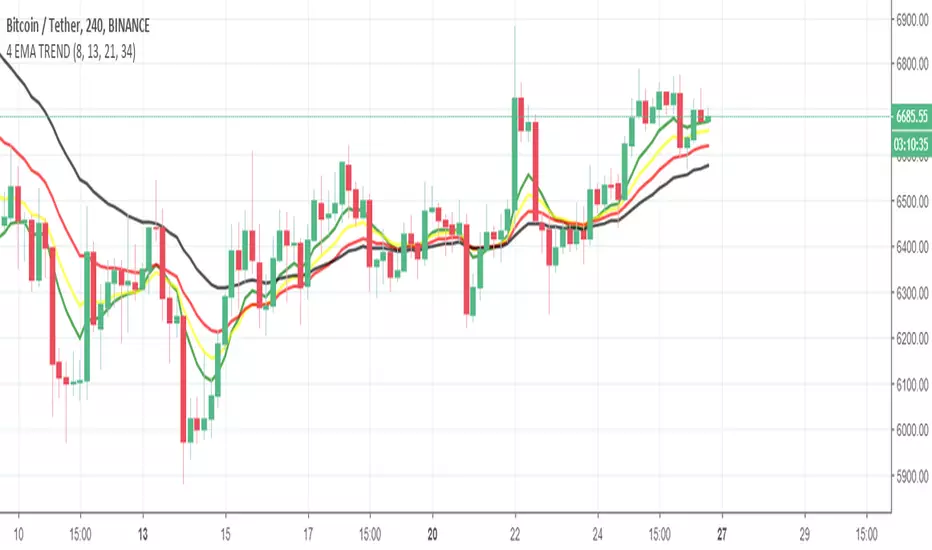
4 EMA TREND INDICATORİf GREEN > YELLOW > RED > BLACK
UPWARD TREND
If BLACK > RED > YELLOW > GREEN
DOWNWARD TREND
In upward trend , if green(fastest ema) crossunder YELLOW or RED or both of them , you can close the position . Dont wait the Downward Trend.
Lengths of EMAs are based on Fibonacci numbers ( 8,13,21,34) , if you want, you can change it based on your strategy.
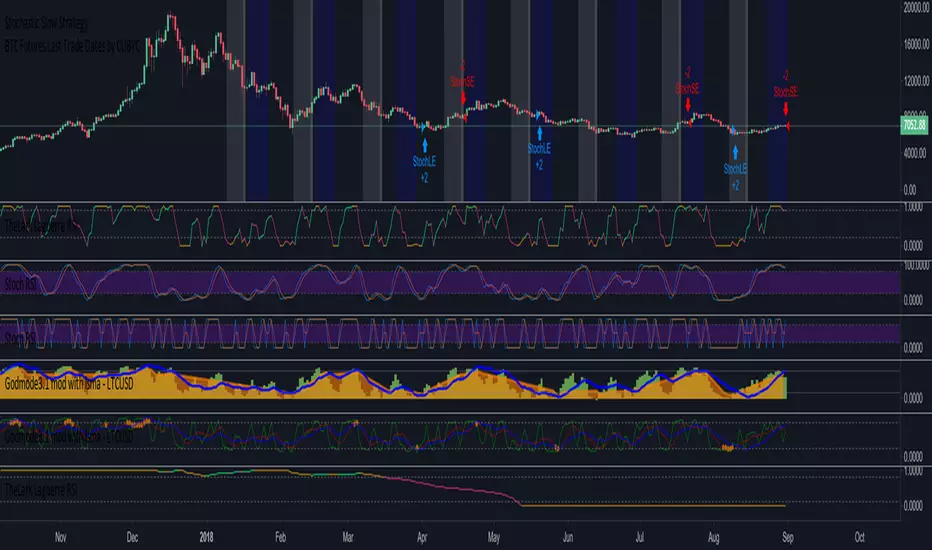
RSI+STOCHRSI StrategyRSI + STOCHASTIC RSI combination . It is useful for 5 min charts .
Profitable in EOS/BTC and BTC/USDT , don't apply all cryptocurrency.


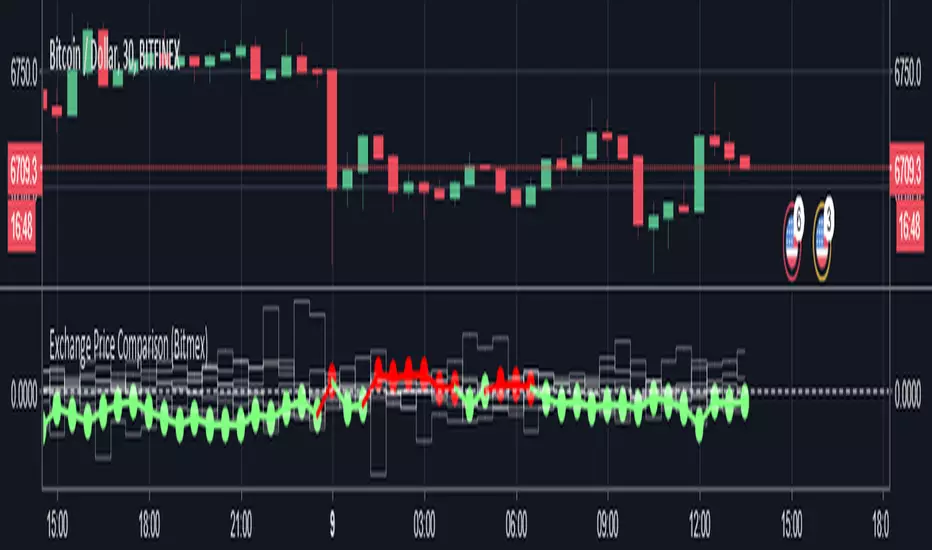
Exchange Price ComparisonCompare the BTC price at your preferred exchange against 7 other exchanges. Avoid trades at poor market value, target trades at good market value.
Average price across 8 exchanges is the 0 line, with your selected exchange displayed green if it's below the average price, red if it's above the average price. Values are displayed as distance from the average, positive or negative.
Useful for evaluating your exchange price vs average market price, to avoid poor market value trades, target good value trades, shop around exchanges for best value, potential to be adapted for arbitrage opportunities.
8 Exchanges used:
Bitfinex
Bitmex
Poloniex
Binance
Coinbase
Bitstamp
Bittrex
Kraken
Requested by Mister_Pocketlint on discord. Inspired by anise.
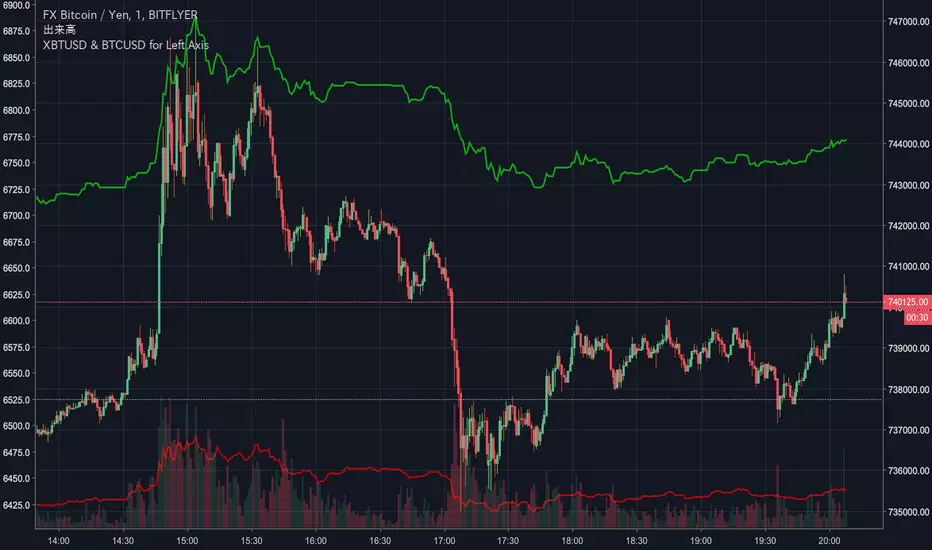
XBTUSD & BTCUSD for Left AxisThis script displays the price of XBTUSD and BTCUSD on the chart.
If you are displaying FXBTCJPY, I recommend you use on the left axis.
CM_Ultimate_MA_MTF_V2 with Alert Long and Short Hello All,
Here is a scirpt of ChrisMoody modified with the alerts of purchases and sales.
I just have a problem with automation. At the bottom of my script my alerts "Buy1" and "Sell2" give alerts constantly and I wish to have a single alert before the order is completed. Before "Sell1" or Buy2 ".
I found the function "barstate.isfirst" that could possibly work?
Does anyone have an idea ? :)

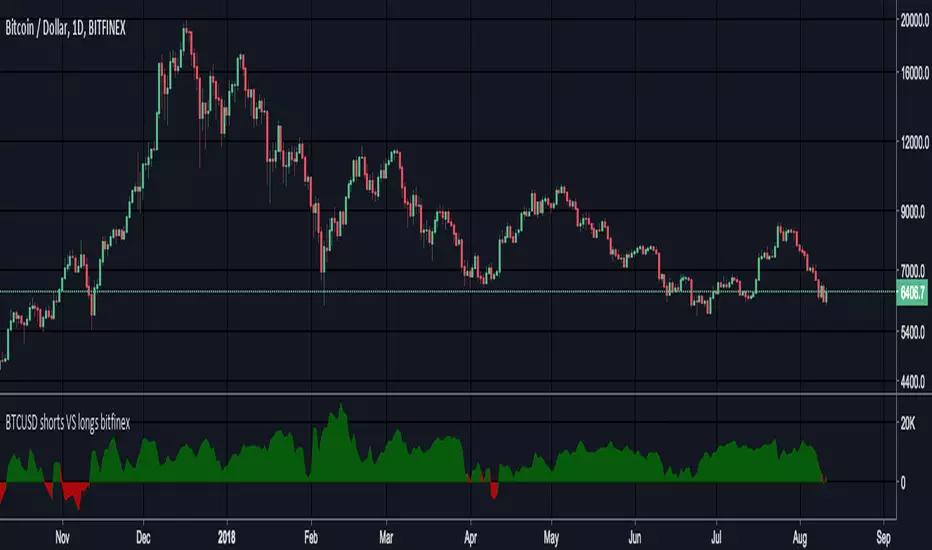
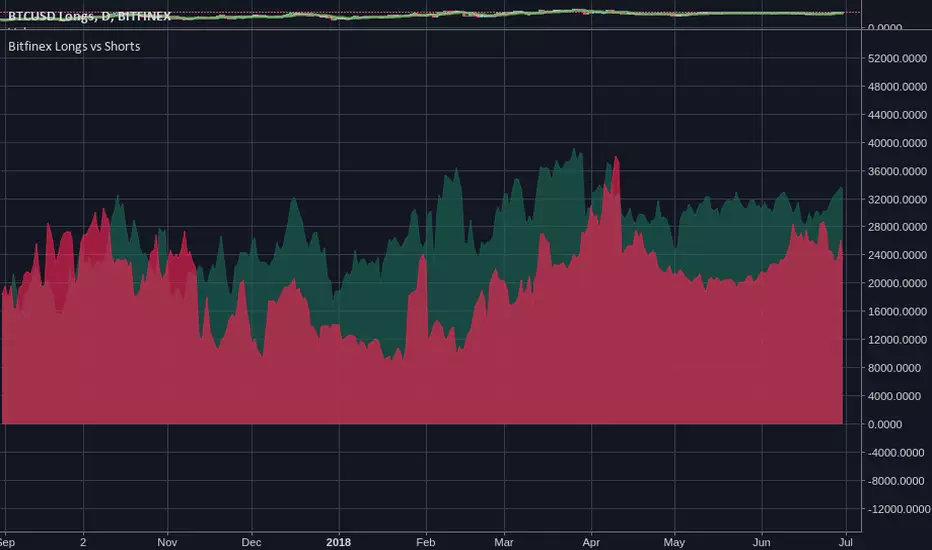
Bitfinex Longs vs Shortssexy view of the current long/short positions on Bitfinex. I saw some pay-for, hidden-source-code version of this and thought: "oh man."
Bitfinex Longs/Shorts Multi-Coin [acatwithcharts]This script plots the longs/shorts ratio derived from Bitfinex for BTCUSDLONGS, BTCUSDSHORTS, and similar for 11 top cryptocurrencies chosen selected based on marketcap, trading volume on Bitfinex, and the maximum number of times that TradingView would let me call the "security" function in one script. Included coins:
BTC, ETH, LTC, BCH, XRP, EOS, IOT (IOTA), ETC, ZEC, NEO, XMR
In addition to just plotting the ratios for the individual coins, this script also calculates for a customizable selection of the 11 coins both the average ratio and a weighted average weighted by (USD price of coin * sum of long and short positions).
I wrote it both to use both for a big picture overview of leveraged positions across major coins and to use as a Swiss army knife of longs/shorts ratio indicators for individual coins, most of which do not currently have individual scripts published.
I'm an amateur and you definitely shouldn't take anything I say or use any of my scripts as financial advice. I'd appreciate any feedback.

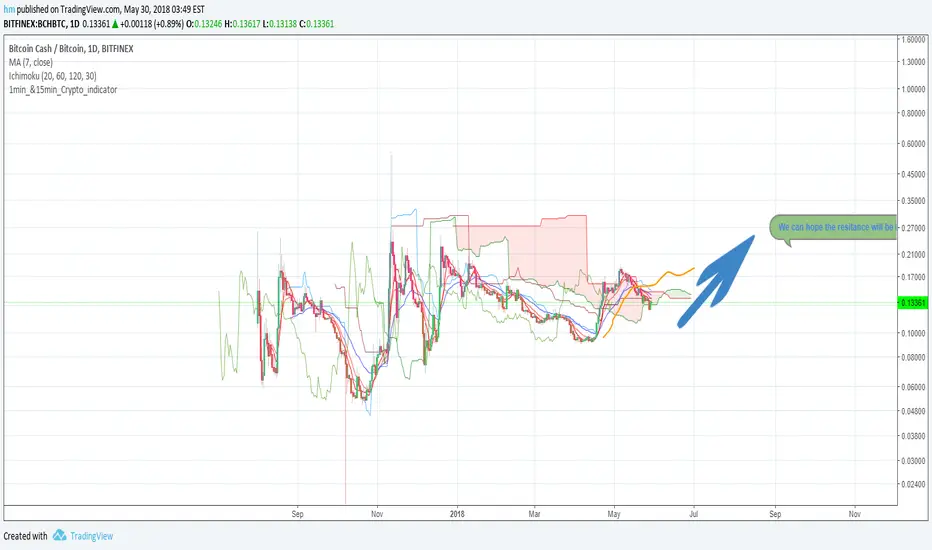
1min_&15min_Crypto_indicatorDear Crypto Community,
on
I set for my thesis a crypto indicator for 15 minutes mostly. It's work at 87 % on BTCUSD & BCH
easy to use:
Green to Short
Purpule to Buy
Bitfinex BTCUSD margin longs vs shortsNon overlay indicator for BTCUSDLONGS and BTCUSDSHORTS + delta

Simple profitable trading strategyThis strategy has three components.
Philakones EMAs are a sequence of five fibonacci EMAs. They range from 55 candles (green) to 8 candles (red) in length. A strong trend or breakout is marked by the emas appearing in sequence of their length from 8 to 55 or vice versa. These EMAs are also used to signal an exit. Only two EMAs are used for exit signals - when the 13 EMA crosses over/under the 55 EMA.
RSI gives a bullish signal when 40 > rsi > 70. Exit signals are oversold (30) or overbought (70)
Stochastics give a bullish signal when stoch < 80 and an exit signal when > 95.
Results include 3 ticks of slippage and taker fees of .002. Provides a pretty smooth equity curve with a 73% win rate and beats buy and hold by than 10x (returns about 60x overall) since start of 2017.

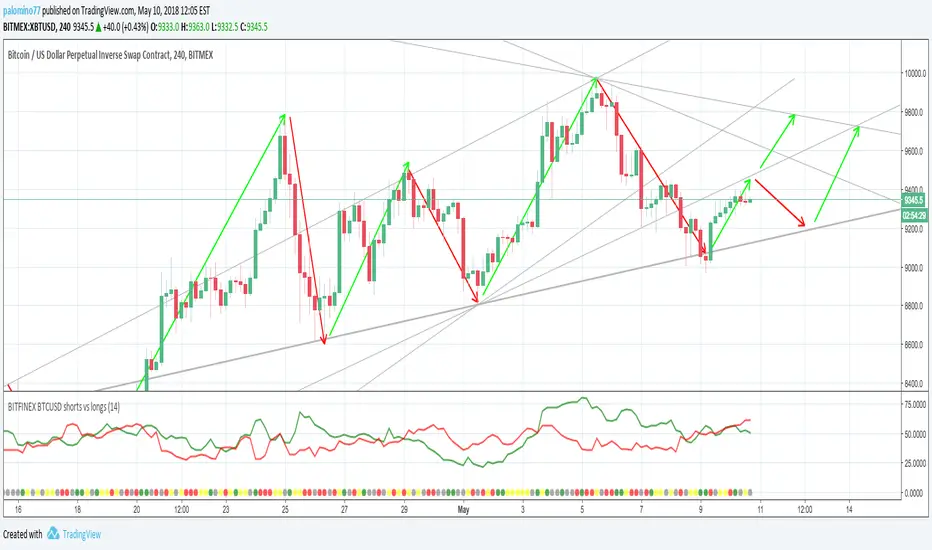
BITFINEX BTCUSD shorts vs longsA simple script to get an RSI of BTCUSD SHORTS and LONGS on Bitfinex.
(Forked from an open sourced script)
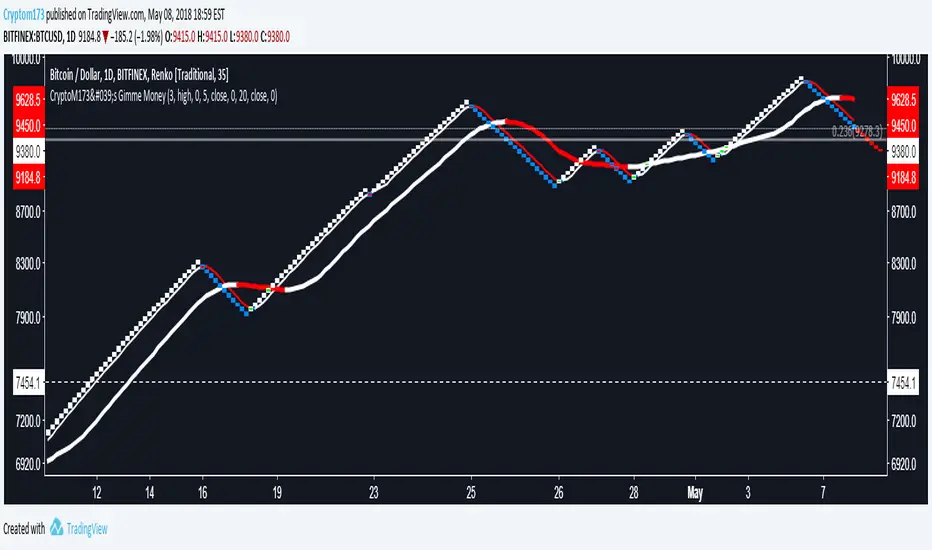
CryptoM173's Gimme MoneyLatest version. Nobody gave me feedback and managing requests to add people became a PITA. Enjoy.
I like money, you like money, this set up has the potential to make a LOT of it. That being said, I do NOTmake any warranties of this making you money, nor do I guarantee you will NOT lose money. In the end, you're the one configuring it and interpreting the results. Providing that you DO set it up correctly and it makes you obscene amounts of money, donations are always welcome (addresses below).
Before you start, it's probably you read EVERYTHING below.
You'll have to do some tweaking of the MA's to find a strat that best suits your needs. It is an indicator you're welcome to use to assist in your trading decisions. I made this script for renko charts and trading bitcoin -1.64% because the standard strat wasn't working out. if you find you're getting a lot of consecutive colored bars or crosses on Renko, you may need to switch from ATR 14 to something like Traditional 50. You will need to adjust the "box value" for traditional renko to fit the asset you're working with, on the time frame you're trading on. Smaller values (i.e. on bitcoin -1.64% I use a box value of 50 on 4hr and 1D with absurd success) but you need to make sure they're not too small, otherwise small moves may appear larger than they are, resulting in a bunch of break-even trades. If you're going to be trading cryptocurrency, it's easiest to switch back to ATR14 to get an idea of the Average Trading range to have a reference point to start from trading btc -1.64% (i.e .000034 rather than 50).
It's a great tool if you're looking to carry both swap and futs positions and keep an eye on the short term swap opportunities while monitoring the status of your futs position and help decide whether or not to close a long at a correction or not and while this strategy has been most effective for me with Renko bars, it's been very useful for monitoring futs positions on traditional charts.
For access, feel free to DM -0.34% me on twitter, @CryptoM173
If you're the generous type, feel free to donate Bitcoin to: 3BMEXWz6Es7iLdi9zAyMWWHHZPNbMKPqrV
Price Converter from BTCJPY to USDThis script shows USD equivalent price which converted from BTCJPY and BTCKRW by fetching latest rate of those local currencies.
By using this script, you can easy to compare the difference of BTC price in USD, JPY and KRW.
Fetching price from BitFlyer for BTCJPY, Bithumb for BTCKRW. Enjoy!

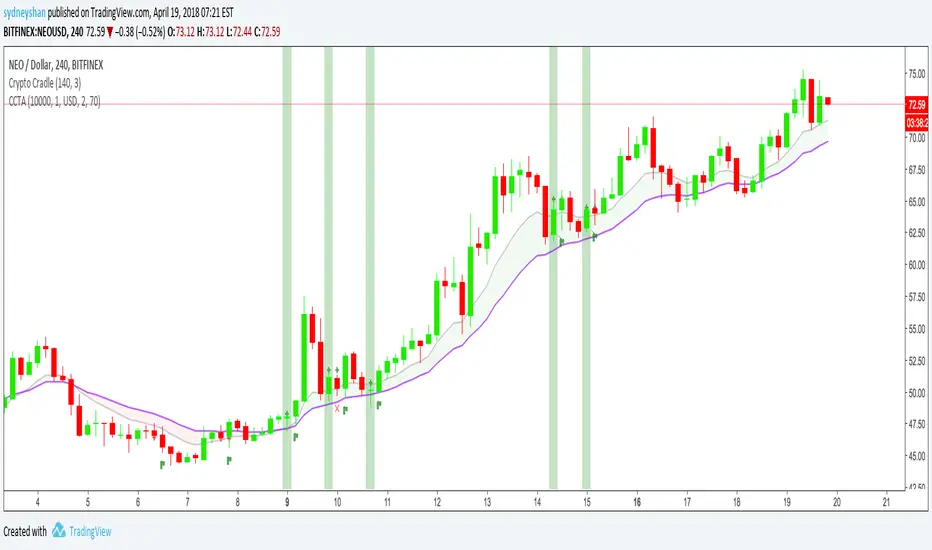
Crypto Cradle Trade AssistantThis indicator compliments the Crypto Cradle indicator by providing your entry, stop, 1:1 scale-out price, trade amount, and potential profit based on your target and scale-out strategy.
1. Ensure you have added the Crypto Cradle and Crypto Cradle Trade Assistant indicators to your chart
2. Click the cog icon to configure this indicator
3. Enter in your account balance and the % you are willing to risk on this trade (default: 1%).
3. Set your target price
4. Tweak the Trade Pair and Precision (Decimals) if required (USD/USDT only BTC & ETH coming soon)
5. Click on the 'Data Window' icon on the right-hand side of the screen and scroll down to CCTA
6. Hover over a highlighted crypto cradle candle (green for long, red for short) and a series of values will appear
Entry price
Stop price
1:1 scale out price
Amount to buy/sell (ie NEO)
Amount in traded currency (ie USD)
Target price (that you set)
Profit based on selling 50% of your bought amount when your reward equals your risk (1:1 scale-out)
Profit based on risking 1% of your portfolio
For more about the Crypto Cradle strategy, visit www.tradercobb.com
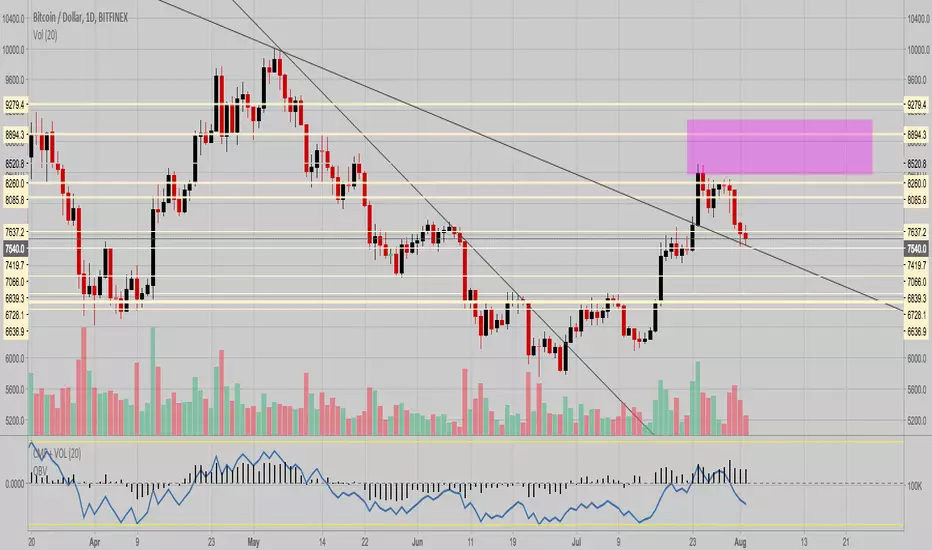
CryptoShadows V1The first Diagonal Support and Resistance indicator. Best for bitcoin and cryptocurrencies

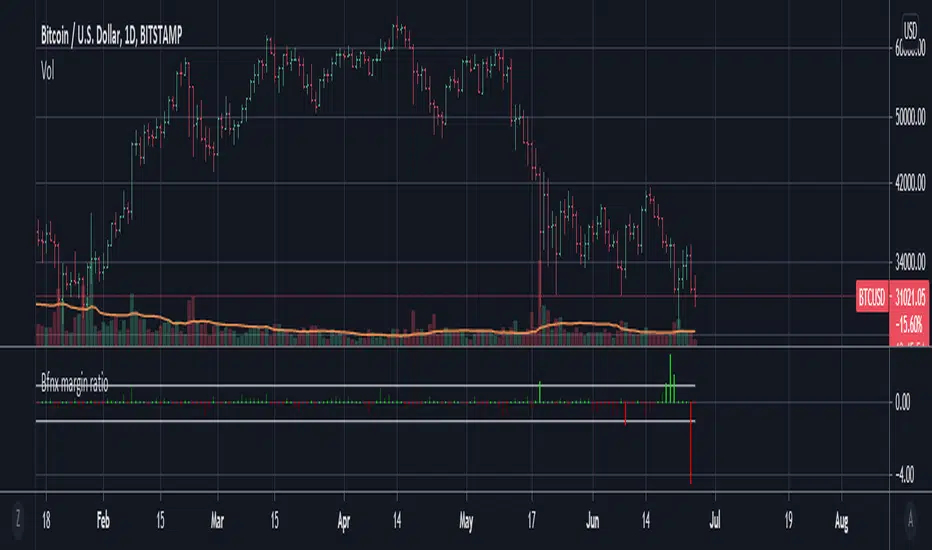
Bitfinex margin change / total volumeThis script tracks the net Bitfinex margin sizes from candle to candle (longs - shorts), and divide it by the total volume from the previous candle. This should give you a ratio of net margin trading volume over total volume on Bitfinex.
Note that assuming the delay is not severe, this ratio should never exceed 1 or -1 (since margin traded volume should strictly be lower than total traded volume during any time interval). As you can see clearly however, the ratio exceeds 1 and -1 quite frequently. Thanks to @CryptoTrendy on Twitter for bringing this issue to attention. Our trading group has noticed this issue ever since they introduced the tickers, and we suspect there are severe inaccuracies in either one, or both of the margin and total volume tickers.
LSX: Mystery BTC strategy with 100% hit rateI said in the main crypto chat, that it was easy to create a BS strategy with a 100% profit rate, so here's the proof.
Looks awesome right? I can promise you, if you trade with this, it will sooner or later blow your account.
Keeping the inner workings of it a secret, just like the scammers do.
Why am I publishing this? To show why investing in these 'mystery strategies' is a terrible idea. That's also why I've hidden the code, so it looks more attractive than it really is.
Say safe, don't get scammed. Don't get rekt.
