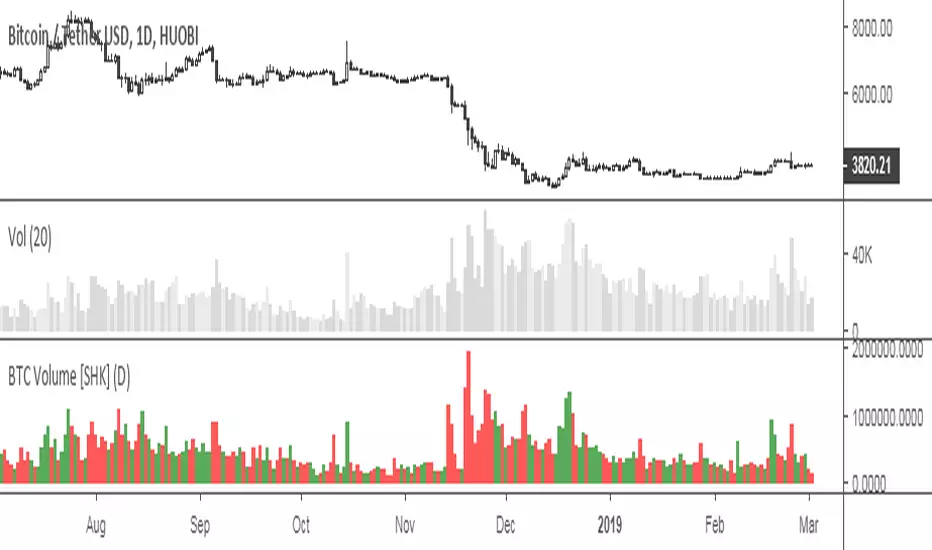
BTC Exchanges Volume [SHK]Useful script to calculate sum of BTC ( Bitcoin ) volumes on different exchanges.
Supported Exchanges:
Coinbase
Bitfinex
Bitmex
Houbi
CEX
Bitstamp
Binance
BitFlyer
Poloniex
Bittrex
Flyer
OkEx
Poloniex
Gemini
HitBTC
Btc-bitcoin


BTC CorrelationA simple script to display how correlated the current ticker is to Bitcoin.
Inputs are the number of bars to check correlation for (default 10) and the the ticker to use for BTC comparison (default is BITFINEX:BTCUSD)
Values of 1 are highly correlated (i.e. bitcoin moves up, so does your current ticker), values of -1 are inversely correlated (i.e. bitcoin moves up, your current ticker moves down).
See: www.babypips.com for some more details on correlation

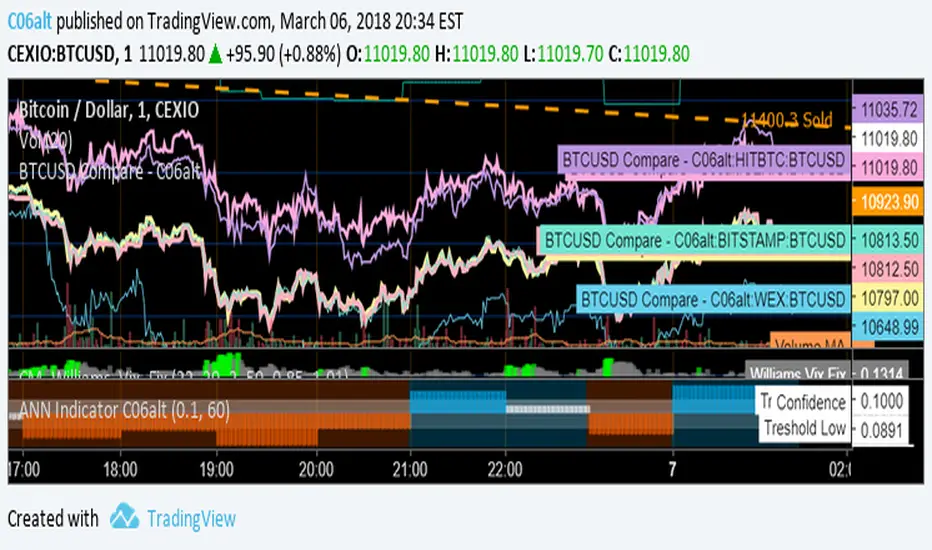
BTCUSD Compare - C06altThis Indicator allows for quick comparison between the BTCUSD exchange closing prices.
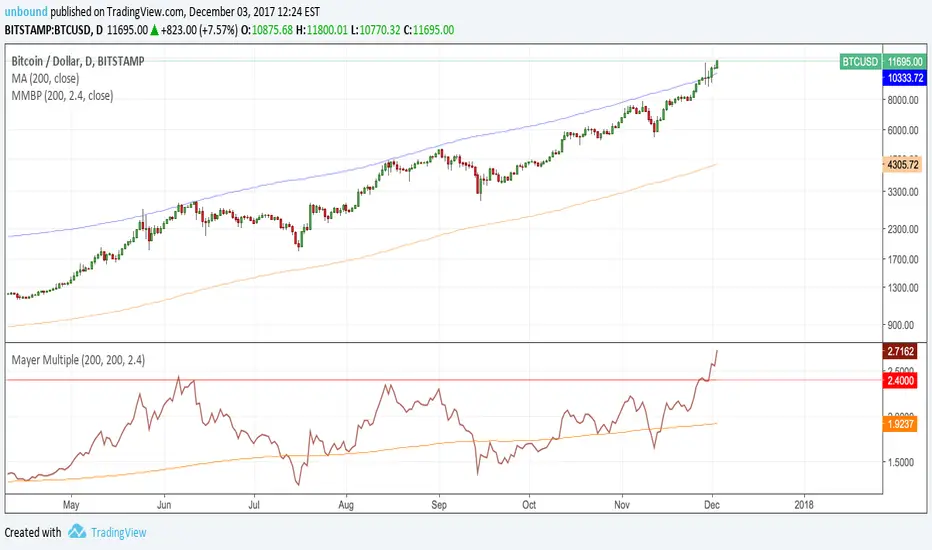
Mayer MultipleFollowing Preston Pysh's "Bitcoin Mayer Multiple" study, I made this simple script to plot the Mayer multiple by calculating the ratio between bitcoin price and its 200-day moving average. It also plots the moving average of ratio itself.
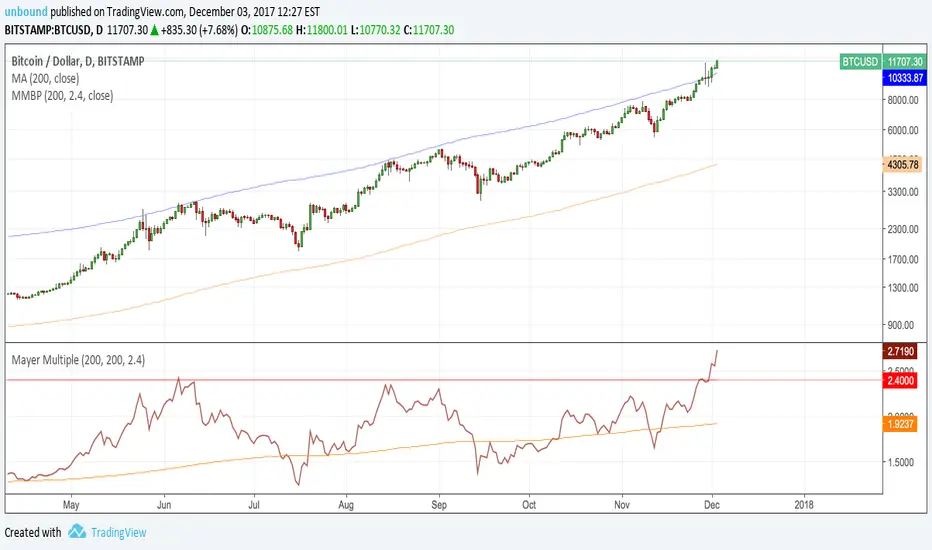
Mayer Multiple Buy PriceFollowing Preston Pysh's "Bitcoin Mayer Multiple" study, I made this simple script to plot the recommended buy price based on the calculated 2.4x ratio between bitcoin price and its 200-day moving average. The ratio and SMA length have default values of 2.4 and 200 and can be adjusted.
(CRISIS) aggregateBTCvol v0.2.4Aggregate multiple exchange volumes into single indicator
This update adds:
*Moving Average
*Add/change/disable to up 6 securities without touching code.
*Monochrome mode for dark themes.

altcoin index oscillatorUse
Compare alt coins to the "altcoin index", an average of a selection of alt coins.
Above zero means the coin you are viewing is worth more than the index, indicating the possibility of overbought.
Below zero indicating the opposite, a possibility of oversold.
Press the cog icon to select which alt coins you want included in the index.
Notes
The coins in the index are ALTBTC, meaning their value against BTC. Due to this the indicator is useless when viewing BTC only charts.
