BTC Spot_PricesSince BTC prices are diverging, this set of 4 indicators charts volume-weighted prices for different exchanges:
Spot, Tether, Futures and South Korea.
I tried doing EUR & JPY, but the divergence is minimal so its a little pointless.
Here is the 4 links:
Btc!
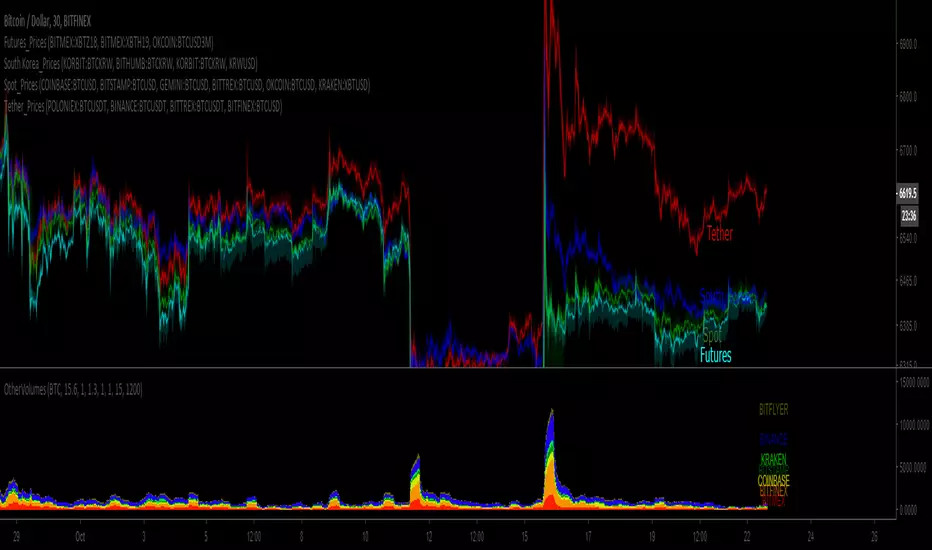
BTC Tether_PricesSince BTC prices are diverging, this set of 4 indicators charts volume-weighted prices for different exchanges:
Spot, Tether, Futures and South Korea.
I tried doing EUR & JPY, but the divergence is minimal so its a little pointless.
Here is the 4 links:

BTC Precognition - Mtrl_Scientist (Multi Time-Frame)Hi everyone,
This indicator is also based on the "BTC Precognition" algorithm, only this time, I've visualized the results on all time frames (1min, 5min, 15min,...,1W). It is supposed to give you confidence in the signals the algorithm already offers.
How it works:
The top blocks are the shorter time frames, whereas the bottom blocks are the longer time frames. As you can see, the signals gradually leak into the longer time frames when a trend is confirmed.
I'm still trying to find patterns, but the most obvious to me was that the best entry is signaled when most blocks of the same color are stacked (marked on chart).
Very good buy signals are often 7-8 green blocks (out of 10) in a row, whereas very good exit signals are 10/10 red blocks.
Note: For best results use Heikin Ashi.
This is still very much work-in-progress, so I'm only publishing it as a private build.
PM me if you want to help test and improve it.
P.S.
As it is with Trading View, accessing higher time frames can lead to repainting. After a lengthy debugging process, it looks like I fixed the repainting issue for higher time frames. However, now there's an issue with skewed calculations on the current time frame (selected time frame == block time frame), that I've only solved for the 1min chart so far (should be possible to fix on all). So please just keep that in mind. As it is now, I'd say everything is correctly displayed on the 1min chart only! You can verify this by refreshing the page and checking if any blocks changed. If they didn't, there's no repaint.
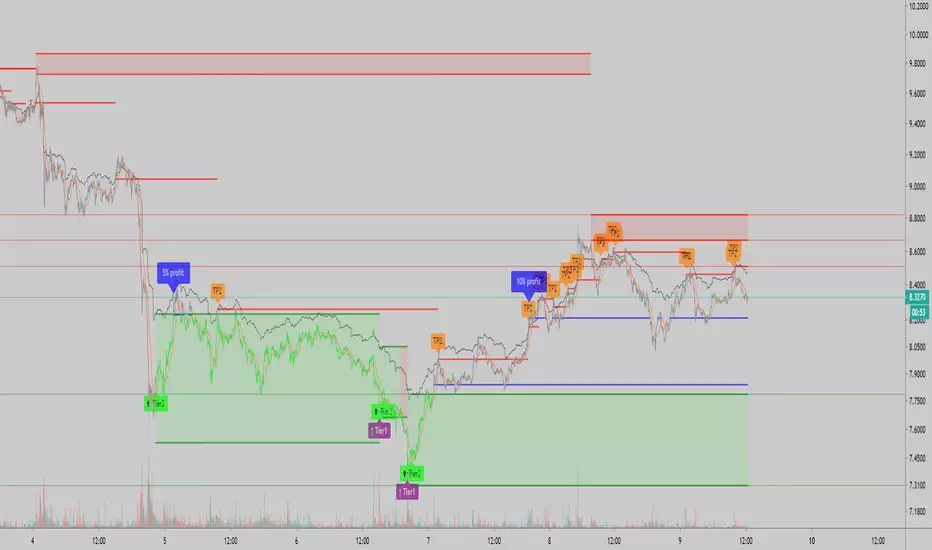

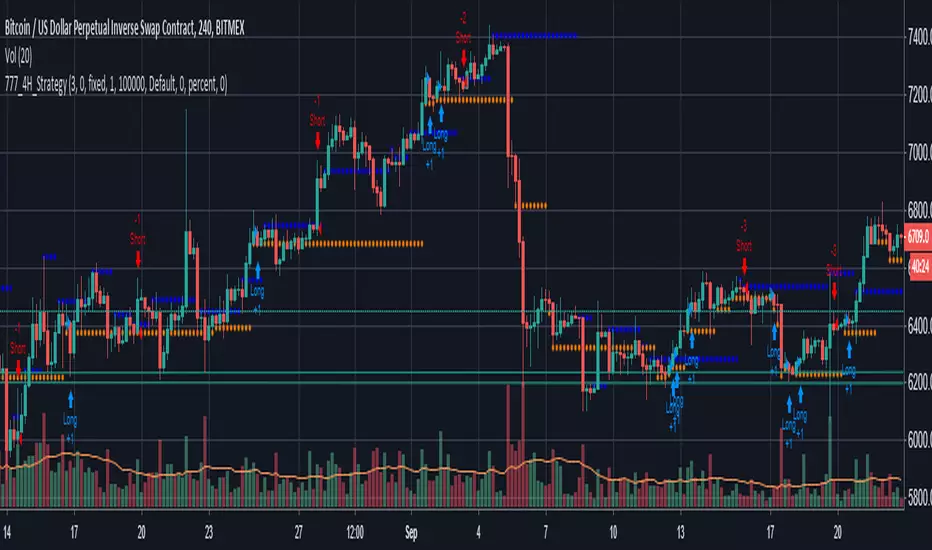
Acceleration / deceleration strategy As promised, the updated acceleration / deceleration strategy.
Added switchable shorts (for exchanges with no margin) and more understandable settings.
The idea of the strategy is to look for the distance between the fast and slow SMA. When it decreases, there is a slowdown in price growth and a change in trend, and at the moment it predicts well the breakdowns of Bitcoin.
In the settings you can configure length of fast SMA, the length of the slow SMA is calculated as the length of the fast + diff. Usually, I pick up the fast SMA length, and then looking for the optimal diff. TrendChangeCandles indicates how many columns are needed in order to form a signal. 1 - the signal will be at each slow/acceleration event, we need to filter it, otherwise there will be a lot of unnecessary signals.
At the moment I have a bot that works on the default settings on the Bitmex exchange, and it gives good results. However, I think it is possible to find other settings for other pairs or timeframes (at least 15 minutes) that would give good results.

U&Dif price has moved up since 1 to 3 candles ago = buy
if price has moved down since 1 to 3 candles ago = sell
has internal SL & TP
tested on
BITFINEX:ETHUSD
BITFINEX:BTCUSD
BITFINEX:LTCUSD
BITFINEX:ETHBTC
4 hour charts

BTC Precognition - Mtrl_Scientist (study version)Hey everyone!
This is the study version of the improved 'BTC - Precognition' algorithm, meaning you'll only see the indicator and not have 'longs/shorts' painted on your chart.
- Works better with normal candles now, as internal calculations are forced to be done on Heikin Ashi, regardless of chosen candle format
- Turned into a study, rather than strategy, as not to interfere with strategies that are already in place
- Added Overbought/Oversold conditions (orange) with adjustable threshold, based on normalized price action helper indicator
Reminder: Only for use with BTCUSD, as it draws data from specific exchanges!
I will also add these changes to the strategy version.
Please let me know what you would like to see improved!

scMAD+ strategyPowerful trend follower. Works best on 1H timeframe.
Steady and constant profit.
To get this fully automated trading system, contact me here.


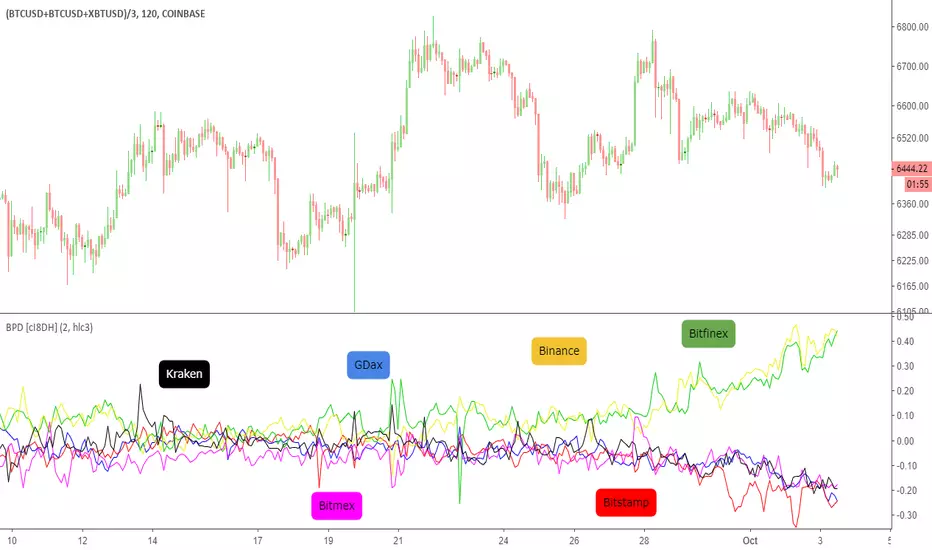
BTC Price Deviation % and Tether price (BPD) [cI8DH]This indicator shows Bitcoin price deviation from average of price across difference exchanges in percentage. As you can see, price at Bitfinex and Binance (both BTC/Tether pairs) are going up relative to BTC/USD pairs. This means Tether price is going down for some fishy reason(s). In the next
update, I will add Tether price calculation.
Thoth Utils - Oscillators
"In art he, Thoth, was often depicted as a man with the head of an ibis bird"
999ug
-----
README
Inside:
- No Repaint
- No Lookahead
- Normalized Oscillators -
Hints:
-- Scripts are not for sale or export outside TV.
-- NO Youtube, NO Twitter, NO Telegram!

Working strategy for ANY market I'm really impressed with this strategy. It is extremely simple, uses only one indicator (accelerator decelerator oscillator) with the standard settings, and works in almost every market I tested it on.
Crypto-currencies - BTC, ETH, XRP - everywhere exceed buy & hodl. Works even in stock markets and FOREX markets (albeit not as efficiently). You really should try this, leave impressions in the comments.
I will improve this strategy with filters for increasing Percent Profitable rate, so stay tuned!

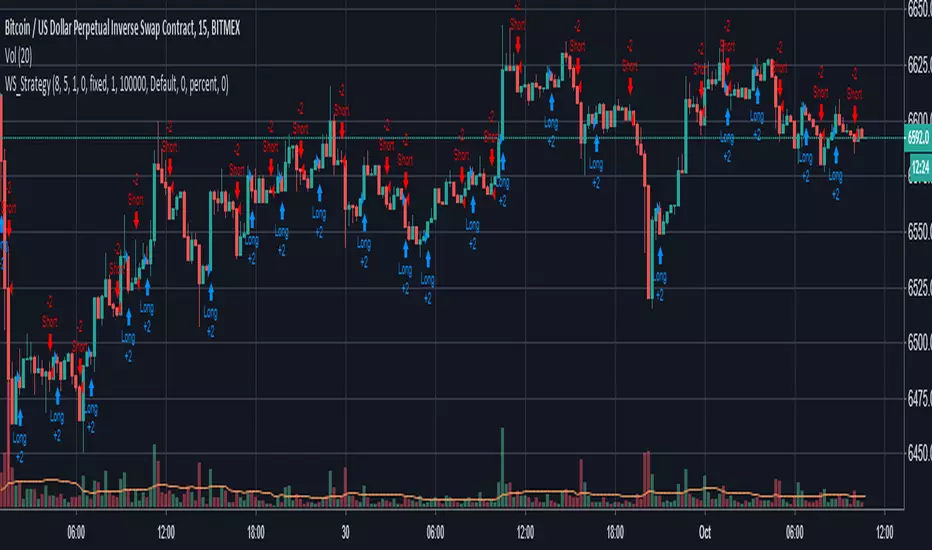
The Wild Storm Trading Strategy - Average of 6 Bars in TradesThis is my Wild Storm trading strategy. A wild storm set of positions taking place with a focus on small quick trades. The ideal strategy for a bot. The strategy is now set to work with the 15min timeframe.
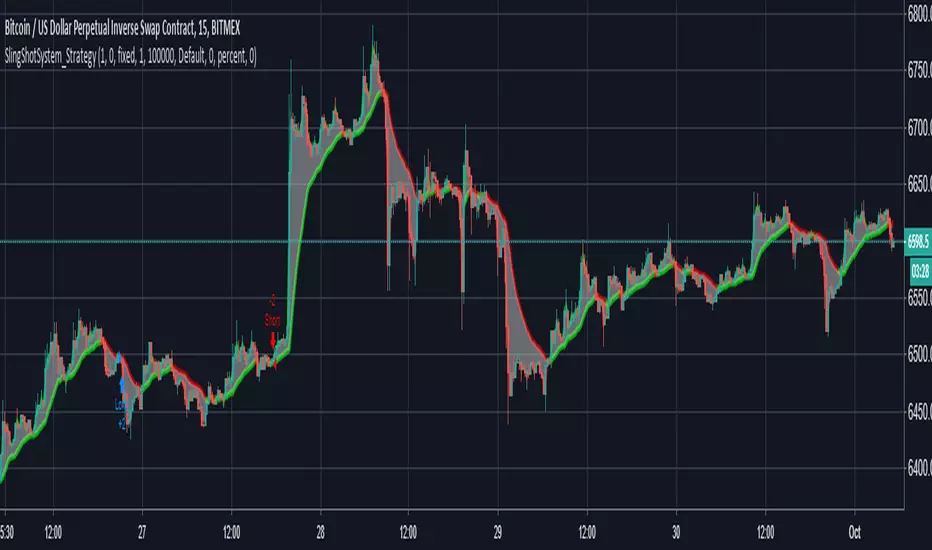
The 15 Minutes SlingShot System StrategyUse this strategy on the 15 Minutes timeframe for maximum profit. Even if the profitability is less than 60%, the profit factor is still above 5 for minimum losses which make it very profitable. The strategy is based on the SlingShot System Study.
The Ultimate TripleX Trading StrategyThe strategy is now set to wor with the 15 Minutes timeframe, but you can adjust it to work with any timeframe.


Bitfinex BTC margin position differencesIf green is over the red it means that longs are currently dominant on BitFinex for BTC.
Same goes if red is over green just that shorts are dominant.
If the green is over red the green will show how many more longs there are than shorts and if you hover over the red you will see how many more shorts there are compared to longs
Vice versa if red is over green .
You can change to a histogram, area, line or any other style of chart in the settings of the indicator
The black dashed line in the middle is 0 aka if u see the indicator go there it means there are an equal amount of longs and shorts

Retail vs. Institutional Bitcoin Volume Ratio [@joemccann]Retail Exchanges
Binance
Bitstamp
Coinbase
Kraken
Bithumb
BitFlyer
OkEx
CEX
Huobi
Institutional Exchanges
Bitfinex
Bitmex
The ratio measure the (total volume of retail exchanges) / (total volume of retail exchanges + total volume of institutional exchanges).
Imperfect. Not investment advice.
H/T @cryptorae for the original version.

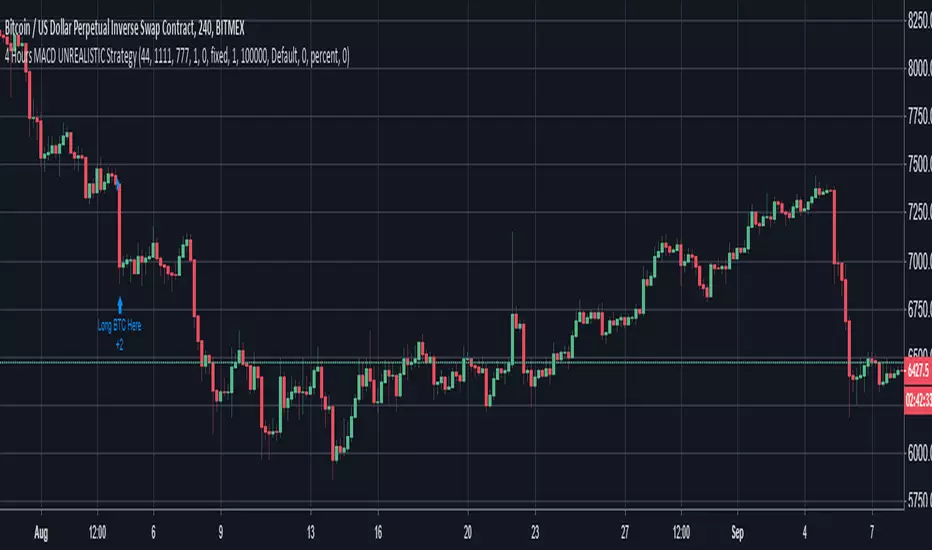
B LAODA bitcoin MACD aptimize Strategy B LAODA bitcoin MACD aptimize Strategy
1 MACD parameter optimization
2 while crossover macd 0 line buy
crossunder macd 0 line then sell
simple and effective,the bitcoin market ,suggest with 4H frame or more for reduce wing
stock market suggest with 1D frame
