Trend is your friendThis indicator evaluates the trend based on crosses of two McGinley moving averages. It paints candles accordingly (it does not repaint), so you can see what the indicator is saying more clearly and stay in your trade until you see a period of consolidation or a reversal. You can control how far away those moving averages need to be for you to consider it a trend. If this distance is not met candles color is not changed and it shows you that the market is in a period of consolidation. I also added visualization of RSI, so you can have an easier time finding appropriate profit targets. For stop loss I would recommend placing it a couple points above or below the previous high / low that is located above / below you final target for entry. You can also use a certain percentage that works for you. I tried adding a stop loss based on ATR, but I did not like the results. Using market structure is a better choice in my opinion.
Here is a basic trading strategy for the default settings:
Wait for the indicator to start printing a series of green or red candles. After that you can enter a long or a short around moving averages. Another valid place to entry is the specific RSI zone. If we are in an uptrend buying when RSI is oversold can be beneficial as you expect market to recover. I do not recommend changing RSI from 14. Vice versa for the downtrend. It gives you an edge as you know at what price RSI will be oversold and allows you to place trades in advance. Pretty neat! You need to realize that no indicator or strategy can give you an exact entry. There will always be some margin of error. What I wanted to say is that if there is a strong trend up and you buy around your key moving averages and when RSI is oversold you entered in good places and there is a pretty good chance you will make money.
Time frame settings:
If you want to use tighter stop losses I would recommend sticking to 15m. Do not go lower. It is not worth the stress. 1h and 4h seems to be very good as well, but expect your stop losses to be wider. What I personally tend to do is display 15m, 30m and 1h and compare it. Think of it as a short, mid and long term. That way you can see things little bit better.
Examples:
1H chart BTC
4h chart EUR / USD
1D chart NASDAQ
15m chart BTC (Daytrading)
That last chart shows that even if you were longing while the trend was about to change you still had a good chance to close it with a little profit and switch to short easily. The default settings is what has worked the best for me. Feel free to change them as you see fit and do not forget to let me know if you find something that works better :)
Notes:
Either disable wick display or change it to a neutral color like gray for both green and red candles. Unfortunately pine script does not allow wick painting, so if you have red / green wicks it will look terrible. If RSI visualization makes your candles look too small you can go to settings and disable the display of individual RSI levels. You will still be able to see the zones, but the scale won't be affected.
Btc!

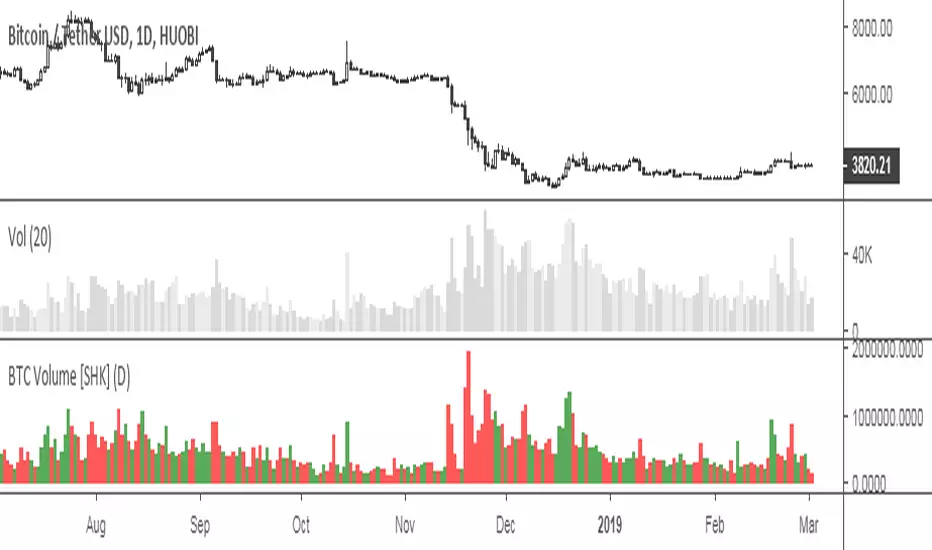
Total Volume for BTC or ETHBITMEX:ETHUSD BITSTAMP:BTCUSD Script includes cumulative Bitcoin volume from exchanges such as Binance, Bitfinex, Bithumb, Coinbase and more
As default, volume is shown based on the number of Bitcoin moved
If volume increases day over day the color will be blue, if it dereases the color will be red. This is not related to price
You can currently switch between ETH or BTC by putting those abbreviations in on the settings inputs
You can also switch to a USD output
You can remove Bitmex data as this exchange is highly leveraged contracts, default includes Bitmex data
Some delays in loading as the indicator pulls data from multiple exchanges
Future updates may include availability of other coins or additional exchanges added

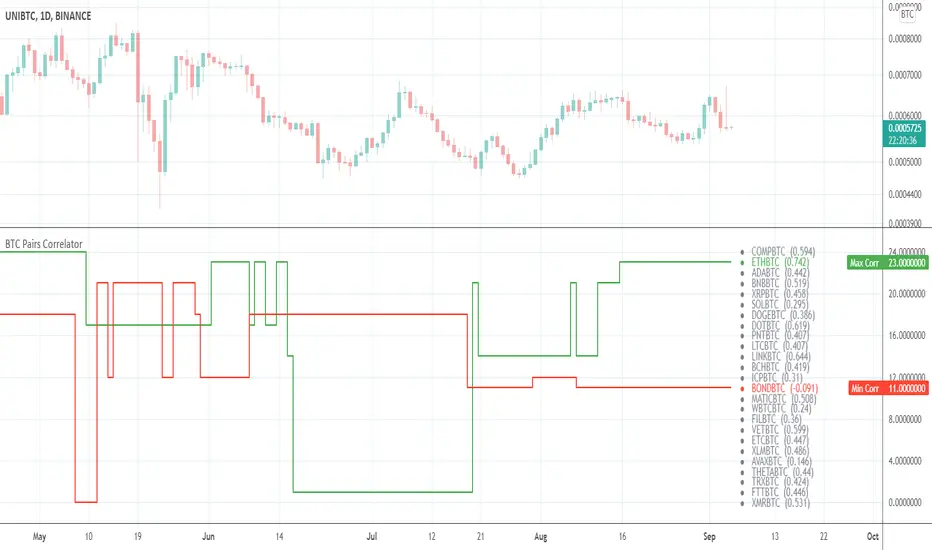
BTC Pairs CorrelatorHey there!
This tool helps to identify the best positive and negative correlated pairs from 38 */BTC cryptocurrency pairs.
By default it will find the best correlations for your current ticker.
If you are a newbie in Correlation Analysis you can find a brief explanation here .
Settings
Lookback for correlations (default: 14 )
Option to use or not to use current ticker (default: true )
You can switch to a custom ticker (default: BTCUSDT )
Choose as many pairs as you want from 38 available pairs.
Available pairs
ADABTC
BATBTC
BCDBTC
BCHBTC
BCNBTC
BNBBTC
BSVBTC
BTGBTC
DASHBTC
DCRBTC
DGBBTC
DOGEBTC
EOSBTC
ETCBTC
ETHBTC
LSKBTC
LTCBTC
IOTABTC
MKRBTC
NANOBTC
NEOBTC
OMGBTC
ONTBTC
PAXBTC
QTMBTC
TRXBTC
TUSDBTC
USDCBTC
VETBTC
WAVESBTC
XEMBTC
XLMBTC
XMRBTC
XRPBTC
XTZBTC
ZECBTC
ZILBTC
ZRXBTC
Good luck!
Bitfinex Longs/Shorts - Real numbersHere you go: real numbers of longs and shorts for most coins on Bitfinex. You can turn off the color between plots.

BTC Exchanges Volume [SHK]Useful script to calculate sum of BTC ( Bitcoin ) volumes on different exchanges.
Supported Exchanges:
Coinbase
Bitfinex
Bitmex
Houbi
CEX
Bitstamp
Binance
BitFlyer
Poloniex
Bittrex
Flyer
OkEx
Poloniex
Gemini
HitBTC
ZR1DMI/ADX
blue is Bull momentum
yellow is Bear momentum
gray line is trending line
dotted is TREND LINE
idea:
look for two lines to be above the dotted TREND LINE
bullish = Bull momentum + Trending Line
bearish = Bear Momentum + Trending Line
when all three are converged or when Tending Line is below dotted its CHOP
Blue flashes when BULL momentum is growing
Yellow flashes when BEAR momentum is growing
NOTE: FOR PA TO MOVE WE DONT ALWAYS NEED 2 LINES ABOVE 1 BELOW
a secondary trade idea is simply on cross over .
when Trending line + one of the momentum lines crosses over the 3rd line (secondary momentum) this can also be seem as trend confirmation.
with that said the strongest and safest set ups are still when 2 is above the TRENDING LINE and 1 below
Relative Estimated Price KivanÇ version (Strategy) By Wicksell Thanks to the great work of KIVANÇ in the Relative Estimated Price REP by KIVANÇ fr3762, it has adapted modifications in the Lookback bar length, transformed into strategy, where a line determines a relative average price of XBTUSD, BTCUSD, ETHUSD and BCH.
the line is a calculation, where it involves reading previous candles where it determines what the current price should be.
When the REP line is above the candle, open buy and close sell, when it is below, open sell and close buy.
When setting which currency, do not forget to change the settings where they are:
1 - XBTUSD
2 - BTCUSD
3 - ETHUSD
4 - BCHBTC
may also be modified:
the Lookback bar length, stop loss settings, test date.
The best results are in the 1H time, with the default settings, but try to modify the data and if you find better results, I would be grateful if you post here.
pivot point strategy(lirshah)The pivot point levels are composed of a pivot point, two higher resistance levels known as R1 and R2, and two lower pivot point supports known as S1 and S2.
Each resistance level is considered a pivot point.
this strategy gives signals based on valid pivot points( reactionary price level) and it has a good results on the variety of pairs in different markets.

MTF Deviation (on-chart) - Mtrl_ScientistHey everyone,
This is an on-chart version of my previous MTF Deviation indicator:
I've added more fib levels and you can now easily see the support/resistance price levels.

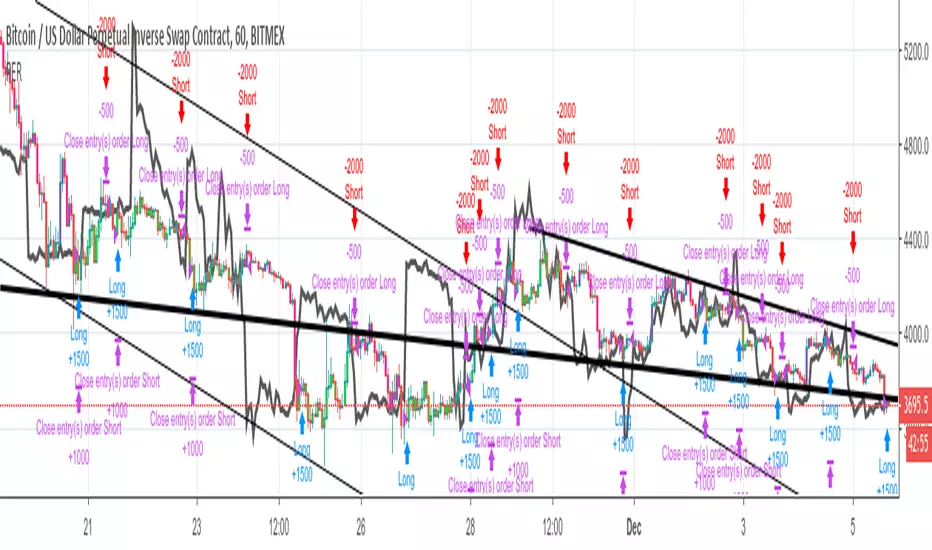
CS Basic Script: Customizable Volume Based Trading (Strategy)Customizable Volume Based Strategy Script that includes the Following Inputs:
- Custom Backtesting Date Range
- Optional Trailing Stop Loss
- Select the Volume Strategy Types (Crossing EMA, SMA, WMA, & Lookback)
- Adjust the MA Volume Range
- Automate with the Autoview Trading Bot
Strategy script may be tested by favoriting and adding to any chart.
Study script is available for automated trading at www.cryptoscores.org

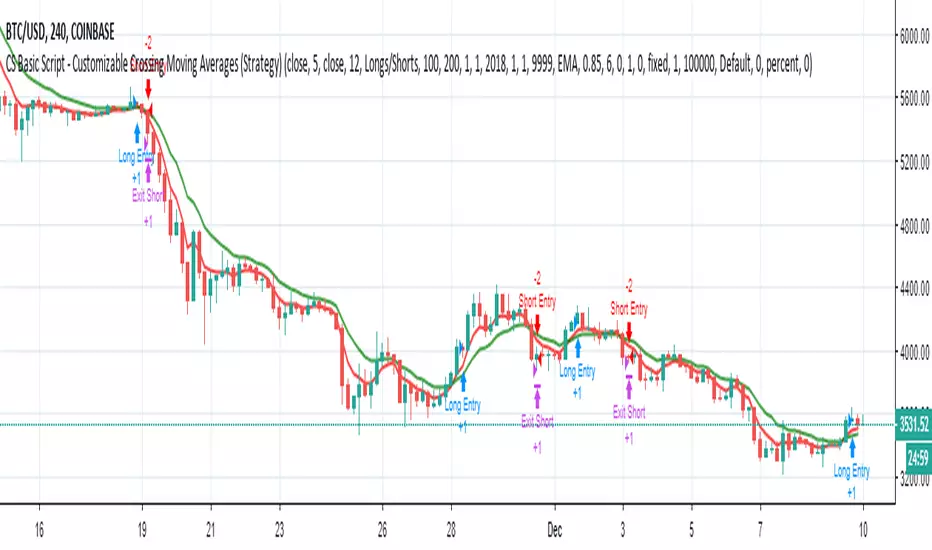
CS Basic Script - Customizable Crossing Moving AveragesThis Crossing MA Script features inputs for:
- Custom Date Range for Backtesting
- Optional Trailing Stop Loss
- Buy/Sell and Long/Short Selections
- Customizable MA Types and Ranges
- Includes EMA, SMA, WMA, ALMA, VMA, HMA, and LSMA Moving Average Types
- Ability to Enable Automated Trading with the Autoview Trading Bot Chrome Extension
For access to the Strategy Script for backtesting, simply favorite the script and add it to any TradingView chart.
For access to the Study Script for Custom Alerts and the Ability to Automize Trades through Autoview, please visit our website at www.cryptoscores.org .
BTCUSD Total VolumesHello traders!
This tool shows you BTCUSD total trade volumes from the all (well, almost) cryptocurrency exchanges on different timeframes.
Supported timeframes
"1"
"3"
"5"
"10"
"15"
"30"
"45"
"60" - 1 hour
"120" - 2 hours
"180" - 3 hours
"240" - 4 hours
"300" - 5 hours
"360" - 6 hours
"420" - 7 hours
"480" - 8 hours
"540" - 9 hours
"600" - 10 hours
"660" - 11 hours
"720" - 12 hours
"780" - 13 hours
"840" - 14 hours
"900" - 15 hours
"960" - 16 hours
"1020" - 17 hours
"1080" - 18 hours
"1140" - 19 hours
"1200" - 20 hours
"1260" - 21 hours
"1320" - 22 hours
"1380" - 23 hours
"D"
"2D"
"3D"
"W"
"M"
How to get access
Buy for only 25$ to get lifetime access to this indicator
Like and follow for more cool indicators!
Happy Trading !

btcATR Bitfinex [csg]A simple script that uses the average true range indicator and compares it against bitcoin's market cap to obtain a visual representation of bitcoin's historical volatility.
A version of this indicator will be made for other coins once tradingview gives us access to the market cap data

MTF Deviation - Mtrl_ScientistHi everyone,
There are a lot of possible ways to look at markets and find valid patterns.
This time, I've looked at how shorter time frames deviate from the overall price consensus.
What you're seeing here is a range-bound difference of the lowest time frame from the overall price consensus (baseline), represented as blue line.
When lower time frames agree with the baseline, the difference becomes 0.
Logically, this difference cannot deviate too much from the baseline, and to quantify that, I've added fib-levels based on a deviation percentage that depends on price volatility and can be adjusted in the settings.
How it works:
First of all, you need to switch to the 1min time frame to get access to the lowest time frame data.
Look at how the blue line follows the support/resistance fib levels.
Oversold conditions are usually given by entering the lowest red band, whereas overbought conditions are given by entering the upper red band.
However, there are also extreme cases, where the blue line exceeds the set fib levels. In that case, price will reverse with very high likelihood.
Alternatively you can also ping-pong between two fib levels for frequent small trades.
Note that this indicator doesn't use any security functions to access time frame data. Instead, I found a different way to avoid repainting.
At the moment I'm just playing around with this to see how I can improve it. Feedback is very welcome!

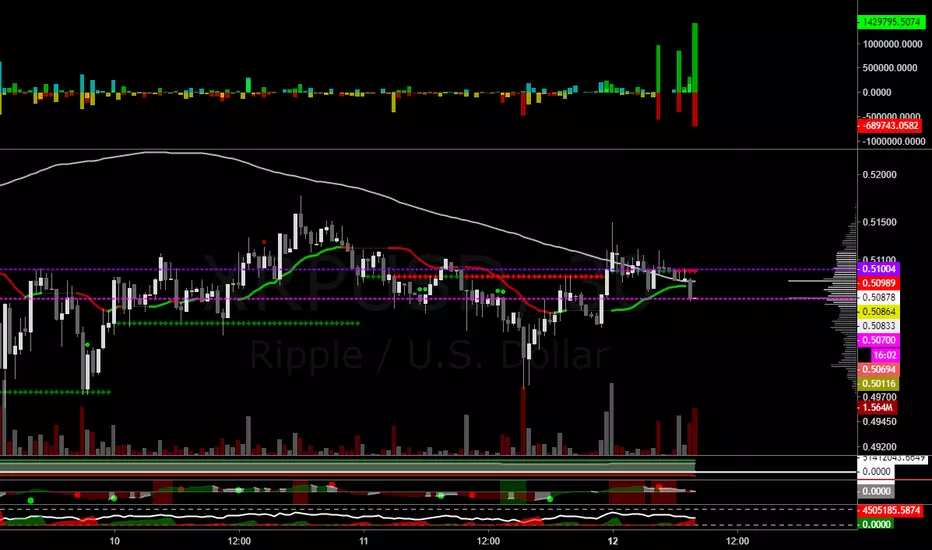
XRPBTCBITFINEXLONGCHANGEBTC建てのロングポジションの変化を示します。
ゼロラインよりも上側のヒストグラムは、ロングポジションの増加を意味します。
ゼロラインよりも下側のヒストグラムは、ロングポジションの減少を意味します。
市場心理を推測し、今後の値動きを予想することに役立ちます。
機械翻訳 Machine translation
The change in long position of BTC is shown.
The histogram above the zero line means an increase in long position.
The histogram below the zero line means a decrease in long position.
It is useful for estimating market psychology and forecasting future price movements.

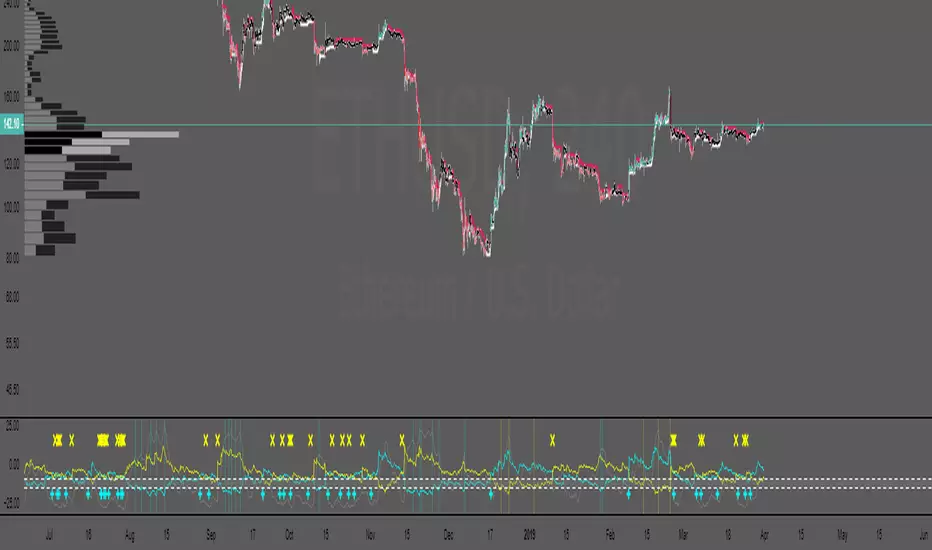
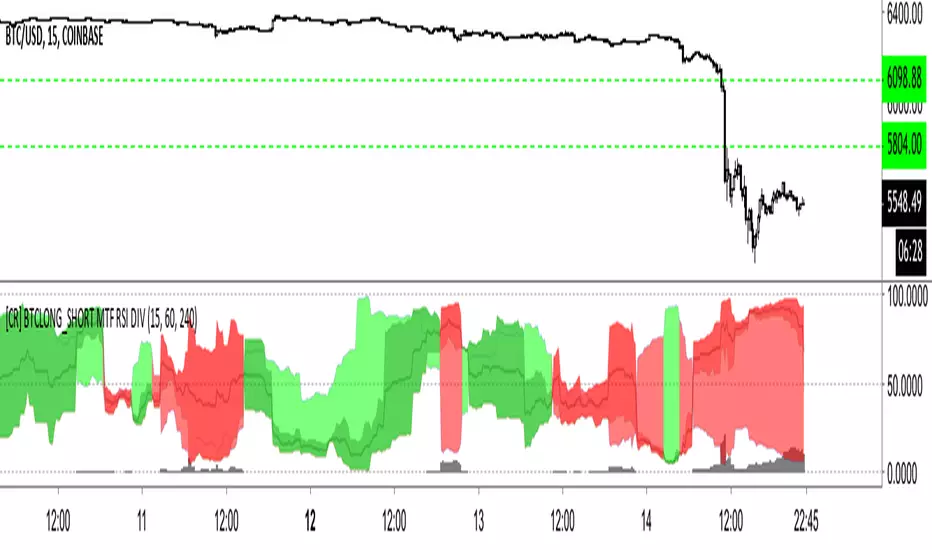
[CR] BTCLONG_SHORT MTF RSI DIVComparing BTCLONG and BTCSHORTS RSI on BITFINEX
+MTF
+RSI
+Difference
Simple indicator to show long/short contract association, including relative difference.

[CR] BTCLONG_SHORT MTF RSI DIV+ MTF x 3 BTCSHORT and BTCLONG on BITFINEX RSI
+ SHORT vs LONG RSI + Difference
This indicator demonstrates the difference between BTCLONG and BTCSHORT values on BITFINEX and compares their relative difference also in RSI.
Red = SHORT > LONG
Lime Over Green = LONG > SHORT difference RSI greater than LONG vs SHORT RSI.
Red Over Darker Red = SHORT > LONG difference RSI greater than SHORT vs LONG RSI.
Black trend line = Total SHORT/LONG RSI
Grey Columns = Total RSI / Difference RSI
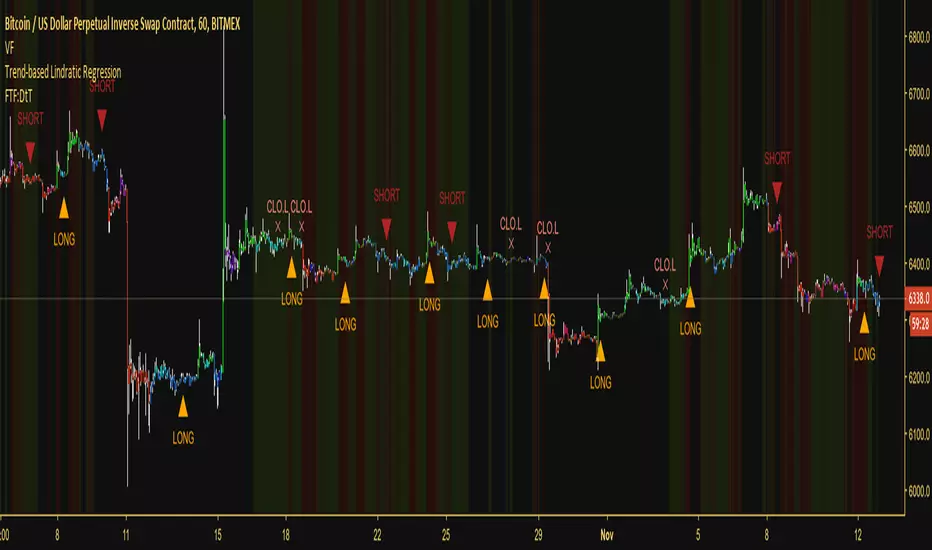
Trend-based Lindratic RegressionThis is an effective trend-following script that uses a finite volume element, linear regression, quadratic regression and multiple EMAs to define appropriate times to enter and exit the market. It can be applied to any asset that has volume data available for it.
As it follows the trend it's a very low-risk strategy, but it's not made to catch and ride reversals. It would rather close a long at the top and close a short at the bottom, although this means you can expect not to be stopped out on any trade you take.
Works on any timeframe, although I did create this with the intention of scalping, so shorter timeframes are recommended.
Combined with a volatility filter, this would be a very effective script, allowing you to stand away from the market during flat periods and trading with the trend during exciting periods.
Access to the script will be grated for 10$ of most low-fee cryptocurrencies, as well as BTC. If you're interested reach out to me through TradingView or, alternatively, contact @overttheraibow through Telegram.
If there's enough demand for it, I will also create a strategy version of this study which will be given for free to those who purchased the script. As always, maximum 250 places available.
Good luck!
VolumeChart BTC Volume Powered by BotBoys [v09/11/2018]Btc global volume by volumeChart team (BotBoys).
Takes volumes of all exchanges with BTC.
It includes Europe, EEUU, Asia and South-America.

Bitfinex Margin ΔShows long/short position changes per chart period
Works for all Bitfinex margin pairs
Red = Short Open
Yellow = Long Close
Cyan = Short Close
Green = Long Open
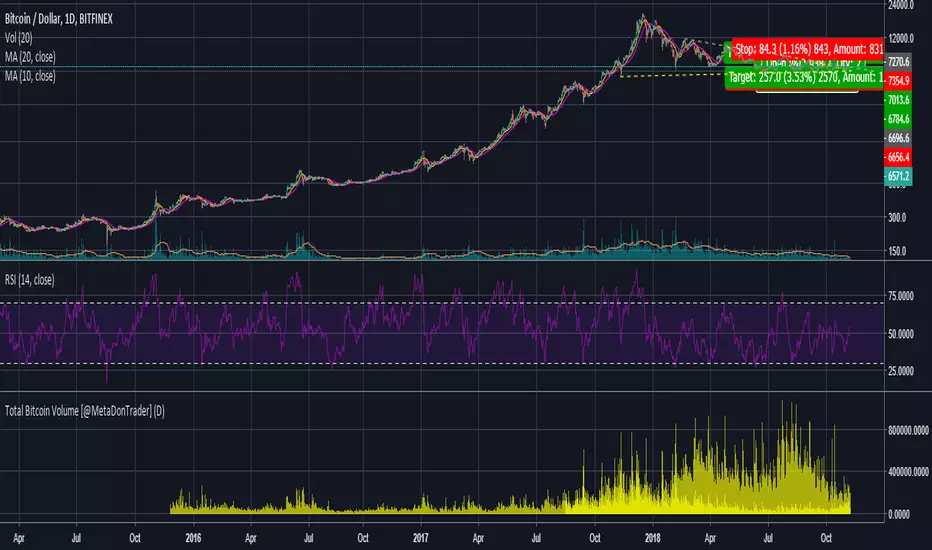
Total Bitcoin Volume [@MetaDonTrader]Aggregates all the bitcoin volume from different exchanges. Note that new exchanges like Binance and Bitmex will have an affect on this data as well. Who's to say how much of it is legit and how much is wash trading.
BITCOIN-INDEX- (*Beta Version*) _BTCXjust like the dollar index and any fiat currency index , this is Bitcoin index , But this is still Beta Version and just Demo
