Golden Ratio Fibonacci Multipliers Top Detector [UO]Fibonacci levels that show the critical top and bottom levels. There is no way to miss the top and bottom. And a top detector.
Also the most important SMA lines (SMA 50, 200), EMA21. Those are the most frequently used lines by traders.
This indicator is based on the work of www.tradingview.com
His work set me thinking. Could I also see the bottom using Fibonacci numbers? Yes, of course.
My favorite timeframes with this indicator are 6H, 1D, 3D.
Intensively used for BTC and BNB. And useful for any other coin.
Btc!

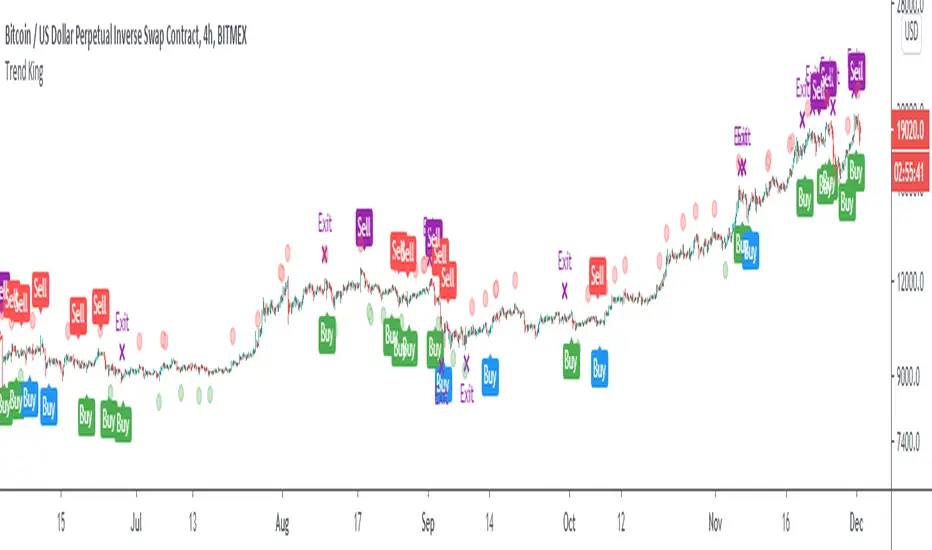
Trend KingIntroducing “Trend King”.
The alpha generating strategy built for Crypto.
“Trend King” combines 4 proprietary indicators. It buys and sells based on:
Short-term momentum
Long-term momentum
Volume compression
Volatility breakouts
The strategy was built on 2 years of BitMEX data (XBTUSD) and backtested on 9 years of Bitcoin data (BLX). Finally, the strategy was validated on multiple large market cap cryptocurrencies, including Ethereum (ETHUSD), without parameter adjustment.
Strategy backtesting checks include:
Used 0.12% fees. 60% more than the actual BitMex/Binance fees of 0.075%.
No Heikin-Ashi Candles (to avoid fake results)
No Stop-losses (to avoid fake order execution)
Market Orders Only (to avoid fake order execution)
The results speak for them self.
See the positive excess return from the “Trend King” strategy returns versus a simple Bitcoin “Buy-and-Hold” strategy. Best functionality on the Daily and 4HR timeframes.
**For Access: Contact me on TradingView or Twitter.
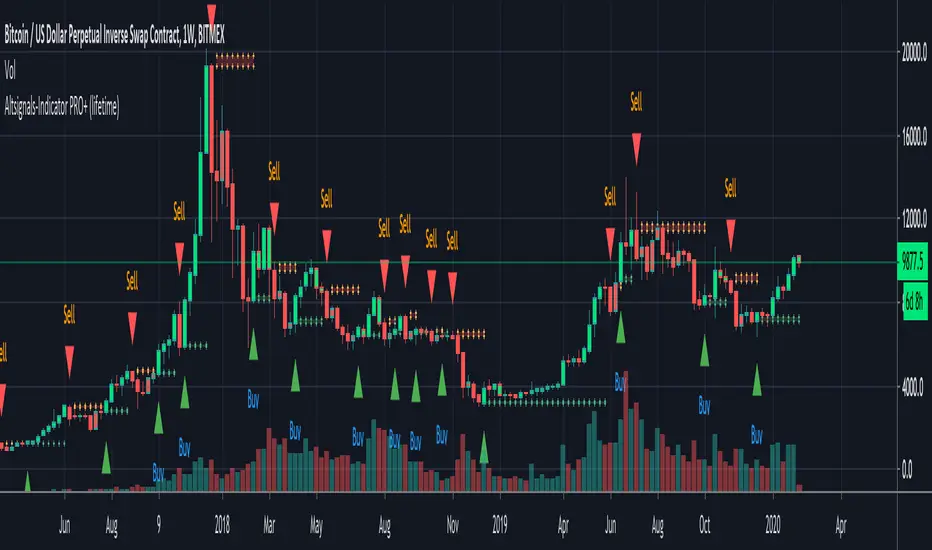
Altsignals-Indicator PRO+ (lifetime)The Altsignals indicator combines various indicators together in an effort to predict accurate and non-bias money making signals. Altsignals Indicator takes out the contradiction so you don’t have to deal with the headaches when you decide to long or short.
There are institutions, whales, and algorithmic bots everywhere in this market, there’s no doubt you’re at a disadvantage. Altsignals Indicator is the secret weapon you need to give you an edge to win in this market.
All-in-one indicator
Supports all trading pairs
Enable Signal Notifications
Fair one-time fee
Risk management features
Works on all markets and all timeframes
Perfect for beginners and people with day-jobs
Common sense required while using this indicator.
Are you experiencing paralysis from analysis? Do you feel like some indicators contradict each other? Don’t know if its worth the risk? If you’re fairly new to trading, then this product is the right fit for you!
Altsignals Indicator is here replace traditional indicators, it does exactly the opposite of all the questions above, telling you exactly when to buy and when to sell, thus giving you the assurance you need to improve your odds of trading.
It takes all aspects into consideration, it utilises multiple indicators such as Divergences, Elliott Waves , Ichimoku , MACD , MACD Histogram, RSI , Stoch , CCI , Momentum, OBV, DIOSC, VWMACD, CMF and multiple EMAs before making a decision.
This PRO+ version has a MAJOR difference to the SLIM+ version.
PRO+ has about 1000 more lines of code and allows you to use multiple advanced indicators at the same time and with a single access.
We added many helpful panels and labels for it so backtesting can be done with ease.
Finally version 2 is out now!
It is now released from all of its bugs we had with custom timeframes, Heikin Ashi and Renko Charts.
Check below what was added and removed.
Added:
- Backtesting
- Labels
- Info Panel
- Bitmex Panel
- Automatic Trendlines
- TJ-Index
- Custom Agg
- Fibonacci Customization
- EMA Customization
Removed:
- SAFE FOMO
- Custom Timeframes
- ZigZag
I have also changed the settings menu with a slightly new design and new default settings.
Altsignals-Indicator SLIM+ (lifetime)The Altsignals indicator combines various indicators together in an effort to predict accurate and non-bias money making signals. Altsignals Indicator takes out the contradiction so you don’t have to deal with the headaches when you decide to long or short.
There are institutions, whales, and algorithmic bots everywhere in this market, there’s no doubt you’re at a disadvantage. Altsignals Indicator is the secret weapon you need to give you an edge to win in this market.
All-in-one indicator
Supports all trading pairs
Enable Signal Notifications
Fair one-time fee
Risk management features
Works on all markets and all timeframes
Perfect for beginners and people with day-jobs
Common sense required while using this indicator.
Are you experiencing paralysis from analysis? Do you feel like some indicators contradict each other? Don’t know if its worth the risk? If you’re fairly new to trading, then this product is the right fit for you!
Altsignals Indicator is here replace traditional indicators, it does exactly the opposite of all the questions above, telling you exactly when to buy and when to sell, thus giving you the assurance you need to improve your odds of trading.
It takes all aspects into consideration, it utilises multiple indicators such as Divergences, Elliott Waves , Ichimoku , MACD , MACD Histogram, RSI , Stoch , CCI , Momentum, OBV, DIOSC, VWMACD, CMF and multiple EMAs before making a decision.
Simply choose a Power level, set your Take profits and Stop Loss and enjoy trading.

[BERA] KEANU REEVES STRATEGY TESTThis is a strategy test of my indicator.
Indicator based on Average true range.
LIME ARROW = LONG
RED ARROW = SHORT
LIME COLOR BARS IF GREEN ARROW CONDITION VALID.
RED COLOR BARS IF RED ARROW CONDITION VALID.

Hash RibbonsBuying during Miner Capitulation yields wonderful returns.
The best buy signals occur on Hash Rate "recovery", and when price momentum is also positive.
Historically, this strategy has yielded average returns to cycle peak of >5000%, with max Drawdown of -15%.
Follow me to learn more about this indicator.

Bitmex BTC Backwardation / ContangoThis indicator calculates difference between price of Bitmex's XBTUSD, and Bitmex's two nearest futures.
If the difference is negative, then it is backwardation.
If the difference is positive, then it is contango.
This script will be updated every about 3 months, when the nearest Bitmex future will be expired.
This is an updated script of , with better description.

BTC Volume absolute (fiat vs Tether vs futures)BTC volume split by fiat, Tether and futures in USD
fiat = COINBASE + BITFLYER + BITSTAMP + KRAKEN
Tether = BITFINEX + BINANCE + HUOBI + HITBTC
futures = BITMEX + BYBIT

True Trend BTC (Conquer Trading & Investing)Bitcoin tends to really trend for long period of times, whether it’s up or down. It’s a trending asset because it’s a new asset, full of price discovery.
I really hope this indicator is instrumental in your Bitcoin trading, it really does an outstanding job in defining the trend and helping you stay with it.

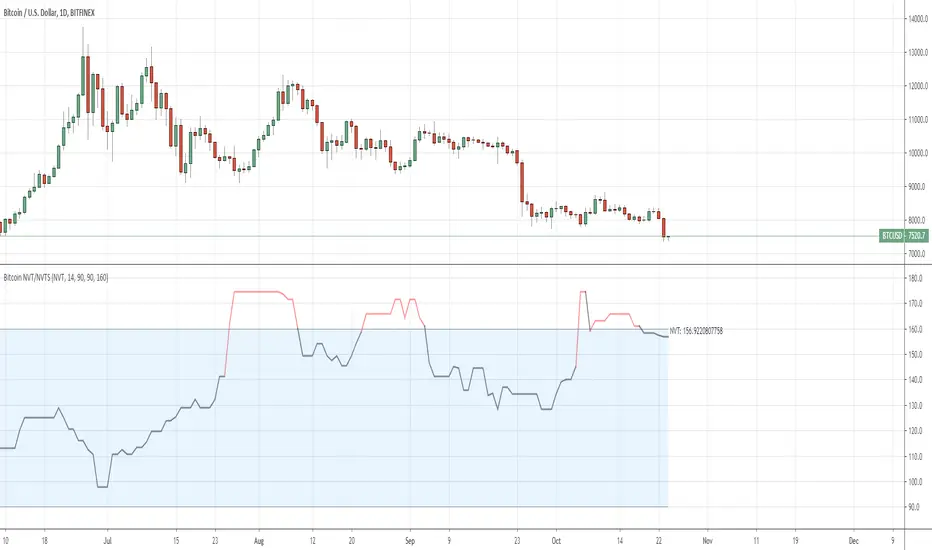
QuantNomad - Bitcoin NVT/NVTSIn this script I included 2 quite interesting indicators for Bitcoin:
* NVT (Network Value to Transactions Ratio)
* NVTS (NVT Signal)
Both indicators are based on Bitcoin Network Value (Market Cap) and 24h transaction volume.
For both these values I'm using Quandl datasets from Blockchainc.com:
market_cap: QUANDL:BCHAIN/MKTCP
transac_vol: QUANDL:BCHAIN/ETRVU
Calculation for both indicators are pretty simple:
NVT = median(market_cap / transac_vol, 14 bars)
NVTS = market_cap / sma(transac_vol, 90 bars)
NVT and NVTS are cryptocurrency's answers to P/E ratio. They can help you to understand if bitcoin is under/overvalued.
When NVT or NVTS is relatively high it can be a pretty good point to short bitcoin, if it's low it good time to buy bitcoin.
NVT Ratio - was created by Willy Woo
NVT Signal - was created by Dimitry Kalichkin
Because of different sources of transaction volume data, these indicators can differ in values from originals, but magnitude should be the same.
This is a pretty simple example where you can select only static overbought/oversold levels and when indicator will be above/below it you will see in changing in color.
I have many more things in my head how these indicators can be developed further and what strategies can be derived from them, but as is they can be a pretty good base for you. Will share my advanced findings later.
Codex NY|LDN SessionsPRIVATE SCRIPT published strictly for use/testing by close acquaintances for the Bitcoin and cryptocurrency markets.
Study shows London and New York trading sessions to help provide a closer look at how traditional hours/futures can/do effect the market.

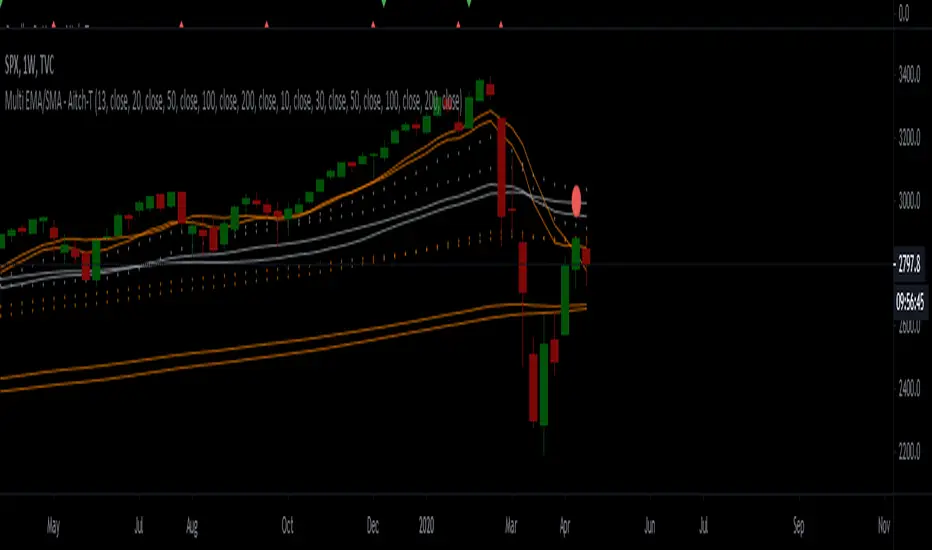
Multi-EMA | 5 EMAs in 1 ScriptAdd up to 5 EMAs to your charts with this script.
Fully Customizable.
----------------------------------------
Wanna try my other scripts?
Histogram with Divergence Finder:
Willams %R with 13 EMA and Divergence Finder:
More scripts here:
www.tradingview.com
1337 Simple Strategy - FREE - simple BTCUSD H1-H6 trendfollowing strategy
- best on H2-H4
- longterm strategy (no scalping)
- best with 1-3 pyramiding (but also without good)
TF = HTF Input
src = OHLC4 or hl2 for best results
Noisfilter = avoid too many Signals

Metcalfes Law - Bitcoin Fair PriceMetcalfe's Law has been successfully used to value a variety of network effect technologies and businesses, including Facebook and Tencent.
Applying Metcalfe's Law to Bitcoin, using "Daily Active Addresses" (DAA) as the "n" value, yields interesting results.
Historically, Bitcoin has tracked the Metcalfe Law Fair Price reasonably well. A number of studies have been performed over recent years which validate this and have used various derivations of Metcalfe’s Law. Note: this indicator sticks to the original Metcalf’s Law.
Prior to 2018, every time Bitcoin was above the Metcalfe’s Law fair price (calculated using a default “A” of 0.5 here), a bubble had formed, and price quickly reverted back down to the mean.
Nonetheless, since February 2018, Metcalfe's Law Fair Price has remained below the actual Bitcoin price, suggesting Bitcoin is currently overvalued.
There may be a few reasons for this:
1. Possibility A: Bitcoin may still be extremely overvalued. Since the December 2017 peak, Bitcoin has only reverted to the Metcalfe’s Law Fair Price briefly during the December 2018 bottom. If this case is true, there could be further to fall unless DAA numbers pick up to fill the gap.
2. Possibility B: The introduction of side-chains, private transactions and the Lightning Network may have fundamentally altered the effectiveness of using DAA to value Bitcoin. As more daily transactions are completed off-chain, or on large platforms/exchanges which use fewer addresses, the relative number and growth of DAA may be misrepresented and artificially low. In this case, DAA as it is reported today is no longer useful in assessing the fair value of Bitcoin with Metcalfe’s Law and this Indicator is effectively useless.
3. Possibility C: Neither of the above are true. We are just in an anomalous period in which price and Metcalfe’s Law Fair Price have deviated from the mean for an extended period (and will meet again in the future, potentially at a higher price).
4. Possibility D: Metcalfe’s Law doesn’t really work for Bitcoin.
I am inclined to believe Possibilities “C” and “D” are unlikely. Given the way Bitcoin infrastructure is being developed and used in 2019, Possibility “B” seems the most likely, as this case is supported by the fact that a number of other metrics indicate that Bitcoin is currently on the lower side of “fair value” (including Dynamic Range NVT Signal).
Regardless, Possibility “A” remains a strong candidate. Only time will tell. It will be interesting to check back on this indicator in 12-24 months time. Hopefully this indicator has been proven redundant by then.

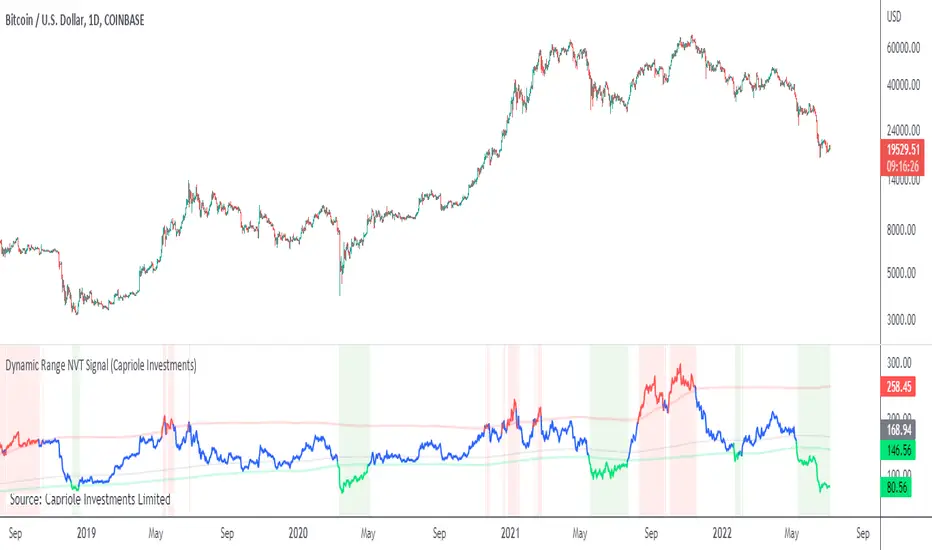
Dynamic Range NVT SignalABOUT DYNAMIC RANGE NVT SIGNAL
NVT Signal (Credit: Willy Woo and Dmitry Kalichkin) is akin to a "PE" ratio for Bitcoin , and can be used to identify when Bitcoin is overbought or oversold based on the relative value of transactions sent across the network.
This indicator includes a 2 year moving average and standard deviation to identify outlier values, instead of declaring a static high-low range for relative valuation.
THEORY
A dynamic "high-low" range was chosen for the following reasons:
- Bitcoin is only 10 years old, it is likely that relatively "high" and relatively "low" NVT values will change with time, as have PE ratios over the last century.
- Some transactions are now made off-chain (eg. Liquid Network's private side-chain which is used by many major exchanges). If this trend continues, we can expect "normal" NVT ranges to increase with time (as the relative portion of public on-chain transaction values decreases).
CALCULATION
- NVT = Circulating Market Cap / 90 average On-chain Transaction Value*
- Overbought (default): NVT > 2-year mean + 2*standard deviations. I.e. NVT Signal is in the top 2.5% of values for the prior 2 years.
- Oversold (default) NVT < 2-year mean - 0.5 * standard deviations.**
*Data source: Blockchain.info, estimated transaction value does not include returned to sender as change.
**Oversold under 2-year mean was chosen due to the skewness of NVT Signal, it is not normally distributed. For example: NVT Signal has never been less than the 2-year mean - 2* standard deviations. This may change in the future.
NOTES ON USAGE
- Use with care. Bitcoin can remain "overbought" or "oversold" for extended periods (eg. 2015-2016).
- As Bitcoin ages, the validity of NVT Signal will need to be monitored. Particularly with respect to potentially increasing use of side-chains, private transactions and potentially the lightning network.
- It is likely that a 2-year “look back period” for calculating mean and standard deviation will not be sufficient in the decades to come. As Bitcoin matures and stabilizes (some time in the future), a longer "look back period" should probably be used. To allow for this, the defaults for this indicator can be easily adjusted.
REAL STRATEGY : Dow_Factor_MFI/RSI_DVOG_StrategyI'm actually one of those who think it's more important to extract clues from indicators than strategy, but I wanted to test the data about the probability and dow factor I've shared for a long time.
Usually, Bitcoin is used as an eye stain for strategy success, since the graph has increased significantly from the beginning.
To prevent this, I used a commission and in the last lines of document I shared Bitmex's Bitcoin and Ethereum 1W test results.
I don't think there's a factor to repaint. ( Warn me if u see or observe )
I considered Bitcoin because I found working with liquid parities much more realistic.
Ethereum and Bitmex have been featured as a spot and may soon find a place at the CME , so I've evaluated the Ethereum .
But since the Ethereum Bitmex was also spot new, I deleted results that were less than 10 closed trades.
Since the Dow Theory also looks at the harmony in the indices, just try it in the Cryptocurrency market.
Use as indicator in other markets. Support with channels, trend lines with big periods and other supportive indicators.
And my personal suggestion : Use this script and indicator TF : 4H and above.
Specifications :
Commission. ( % 0.125 )
Switchable Methods ( Relative Strength Index / Money Flow Index )
Alarms. (Buy / Sell )
Position closure when horizontal market rates weighs.
Progressive gradual buy/sell alarms.
Clean code layout that will not cause repaint. (Caution : source = close )
Switchable barcolor option (I / 0 )
*****Test results :*****
drive.google.com
Summary:
It was a realistic test.
It has achieved great success in some markets, but as I mentioned earlier, use it only to gain insight into the price movements of cryptos.
Use as indicator in other markets.
This code is open source under the MIT license. If you have any improvements or corrections to suggest, please send me a pull request via the github repository : github.com
Stay tuned ! Noldo.

Strategy based on the principles of Price ActionIt is considered the percentage of candles with low and high closure for a certain period. Then, a moving average is built from these values. When the moving average of the ratio of tall candles to low candles is greater than the ratio of low candles to high, then long (that is, when the green line crosses the red). And vice versa - a condition for short. It also works on crypto with other settings. Idea for improvement: you can make partial exit by taking, at certain profit levels, the chart will be more stable. Result with a commission of 0.004% You can create an optimizer, and use this strategy on any liquid asset. (Sorry for google translator)

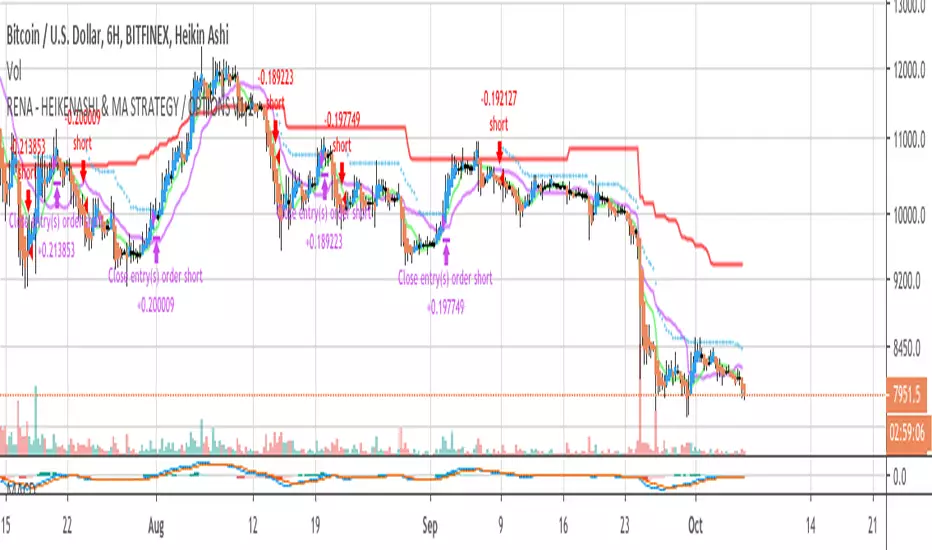
RENA 1.2 - STUDY / OPTIONSA swiss army knife type script, lots of indicators etc, good for crypto markets.
This is the strategy for the study that can be found here.
PM for source code :)
happy trading
xo

RENA 1.2 - OPTIONS - STUDYA swiss army knife type script, lots of indicators etc, good for crypto markets.
The strategy for this study can be found here.
PM for source code !

RENA - OPTIONS V1.2A swiss army knife type script, lots of indicators etc, good for crypto markets.
Study with alerts baked in can be found here
pm me for source code
happy trading xo
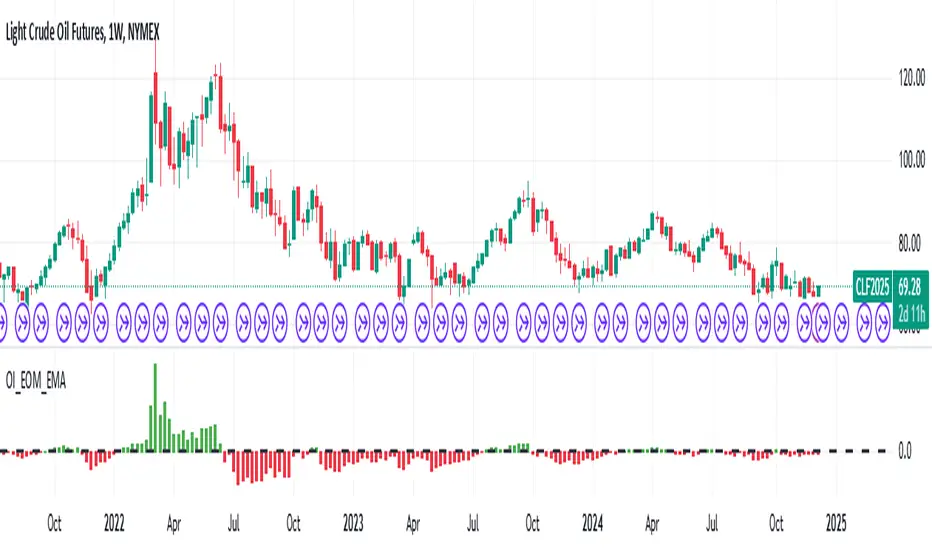
Open Interest Exponential Ease of MovementModified Ease of Movement :
* Open Interests used on Futures instead of Volume (Includes Bitcoin)
* Exponential Moving Average used instead of Simple Moving Average
* Division Number cancelled. (Division Number gives wrong signals inside strong trends.)
NOTE : This code is open source under the MIT License. If you have any improvements or corrections to suggest, please send me a pull request via the github repository github.com
Stay tuned. Best regards !
[BERA] SUper BOSSHey beras and bulas, this is another gift for you! work in sync with KNIFE CUT script
Please message me if you like my indicators. Thanks you.
This indicator work in sync with KNIFE CUT, check it.
SUper BOSS
Is a special indicator with 2 metrics you can use for be a better trade and stop losing money entering useless positions.
using also KNIFE CUT you will get up to 4 parameters you can compare, for enter only good trades.
This indicator can:
Supports and resistances area as point of reference.
OverBought, Oversold candles
Green line is a LONG, Red line is a SHORT.
4H example, work with all timeframes also for excellent 15m scalping.
SEE? many opportunities.
Tried this with 15m timeframe trading ALGO MOON or DOOM and the result is incredible.
With SUper BOSS and KNIFE CUT, you will earn money in any timeframe!
I may find 15 trades a day with this system.
See price history.
You not believe? i believe.

[BERA] KNIFE CUT
Hey beras and bulas, this is my gift for you!
Please message me after you tried my indicators.
This indicator work in sync with SUper BOSS or SB , check it.
KNIFE CUT
Is a special indicator with 2 metrics you can use for be a better trade and stop losing money entering useless positions.
This indicator can:
The Area in the center measure "Market cycles" check below, and "BUY PRESSURE", check the reaction with the price action, impressive? i know.
About the bars green or red, are trend bars, compare it to the price action and you can see that these bars catched all uptrends and downtrends.
(you can change also resolutions of background bars, current H4 resolution if you watch lower timeframes.)
*BUY PRESSURE / TREND BACKGROUND BARS
*MARKET CYCLES
This script work with every exchange and pairs, also forex.
See price history.
You not believe? i believe.
