BITMEX Bybit binance Bitfinex OKCOIN BTC SMA AlertBITMEX Bybit binance Bitfinex OKCOIN BTC SMA TREND Alert
This is a very effective trend strategy.
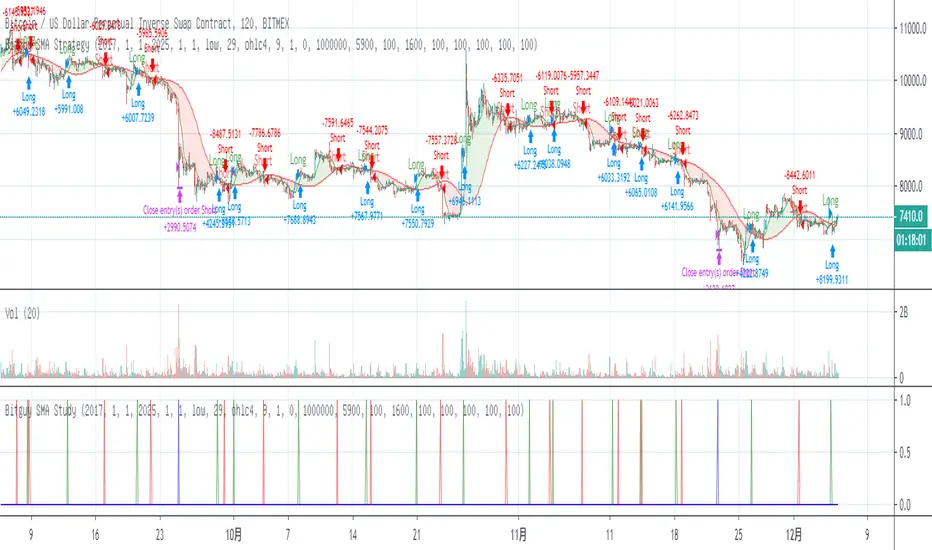
BITMEX Bybit binance Bitfinex BTC SMA TREND strategy
Strategy principle
HOW TO USE
set long position when a green arrow appears in the chart.
set short position when a red arrow appears in the chart.
For the long position and the short direction, you can set the stop profit & stop loss or trailing profit stop & trailing stop loss respectively.
When a purple arrow appears to close a position, an aggressive trader can go in the opposite direction when it is purple.
Strategy applicability
The default setting is for bitmex perpetual swap contract XBTUSD , bybit BTCUSD perpetual futures contract ,binance btcusdt Spot,Bitfinex BTCUSD Spot,bitflyer BTCJPY Spot,bithumb BTCKRW Spot,bitso BTCMXN Spot, bitstamp BTCUSD Spot,bittrex BTCUSDT Spot,Coinbase BTCUSD spot, deribit BTCPERP perpetual futures contract,gemini BTCUSD Spot,Hitbit BTCUSDT Spot,huobi BTCUSDT Spot KRAKEN XBTUSD spot,OKCOIN OKEX BTCUSD3M BTCUSD BTCUSD2W,Poloniex BTCUSDT Spot etc btc symbol with 30 minutes timeframe.
This indicator has broad applicability and can be applied to multiple different symbols.
This indicator also applies to the ETHUSD symbol etc, just adjust the default configuration.
Using the alert of the indicator, it can work well on the trading robot like Gunbot,autoview, without repaint false signals.
这是非常有效的趋势策略。
如何使用
在图表中出现绿色线就做多。
在图表中出现红色线就做空。
对于多头头寸和空头方向,您可以分别设置止损和止损或尾随利润止损和尾随止损;当出现紫色箭头时平仓,激进的交易者,可以在紫色时就做反方向。
策略适用性
默认设置是针对bitmex交易所 XBTUSD永久掉期合约,BYBIT交易所 BTCUSD永续期货合约,binance币安交易所 btcusdt现货,Bitfinex交易所 BTCUSD现货,bitflyer交易所 BTCJPY现货,bithumb交易所 BTCKRW现货,bitso交易所 BTCMXN现货,bitstamp交易所 BTCUSD现货,bittrex交易所 BTCUSDT现货,Coinbase交易所 BTCUSD现货,deribit交易所 BTCPERP永续期货合约,gemini双子星交易所 BTCUSD现货,Hitbit交易所 BTCUSDT现货,huobi火币交易所 BTCUSDT现货,KRAKEN交易所 XBTUSD现货,OKCOIN OKEX交易所 BTCUSD3M OK BTC季度合约 BTCUSD BTCUSD2W OK BTC次周合约,Poloniex BTCUSDT现货等2小时区间的btc交易。
Bitmex XBTUSD 2H 比特币期货 2 hours Bitcoin Futures
Binance BTCUSDT 2H 比特币期货 2 hours Bitcoin spot
这个指标具有广泛的适用性,可以适用多个不同交易品种。
该指标还适用于ETHUSD交易品种等,只需调整默认配置即可。
Bitmex EOSBTC 30分钟 EOS合约 30分钟 ETHUSD Futures
Bitmex XRPBTC 30分钟 XRP合约 30分钟 ETHUSD Futures
使用该指标的警报设置,它可以在自动交易机器人上很好地工作,而无重绘错误的信号。
Btc!

BITMEX Bybit binance Bitfinex OKCOIN BTC SMA TREND strategy BITMEX Bybit binance Bitfinex Coinbase OKCOIN BTC SMA TREND strategy
This is a very effective trend strategy.
BITMEX Bybit binance Bitfinex BTC SMA TREND strategy
Strategy principle
HOW TO USE
set long position when a green arrow appears in the chart.
set short position when a red arrow appears in the chart.
For the long position and the short direction, you can set the stop profit & stop loss or trailing profit stop & trailing stop loss respectively.
When a purple arrow appears to close a position, an aggressive trader can go in the opposite direction when it is purple.
Strategy applicability
The default setting is for bitmex perpetual swap contract XBTUSD , bybit BTCUSD perpetual futures contract ,binance btcusdt Spot,Bitfinex BTCUSD Spot,bitflyer BTCJPY Spot,bithumb BTCKRW Spot,bitso BTCMXN Spot, bitstamp BTCUSD Spot,bittrex BTCUSDT Spot,Coinbase BTCUSD spot, deribit BTCPERP perpetual futures contract,gemini BTCUSD Spot,Hitbit BTCUSDT Spot,huobi BTCUSDT Spot KRAKEN XBTUSD spot,OKCOIN OKEX BTCUSD3M BTCUSD BTCUSD2W,Poloniex BTCUSDT Spot etc btc symbol with 30 minutes timeframe.
This indicator has broad applicability and can be applied to multiple different symbols.
This indicator also applies to the ETHUSD symbol etc, just adjust the default configuration.
Using the alert of the indicator, it can work well on the trading robot like Gunbot,autoview, without repaint false signals.
这是非常有效的趋势策略。
如何使用
在图表中出现绿色线就做多。
在图表中出现红色线就做空。
对于多头头寸和空头方向,您可以分别设置止损和止损或尾随利润止损和尾随止损;当出现紫色箭头时平仓,激进的交易者,可以在紫色时就做反方向。
策略适用性
默认设置是针对bitmex交易所 XBTUSD永久掉期合约,BYBIT交易所 BTCUSD永续期货合约,binance币安交易所 btcusdt现货,Bitfinex交易所 BTCUSD现货,bitflyer交易所 BTCJPY现货,bithumb交易所 BTCKRW现货,bitso交易所 BTCMXN现货,bitstamp交易所 BTCUSD现货,bittrex交易所 BTCUSDT现货,Coinbase交易所 BTCUSD现货,deribit交易所 BTCPERP永续期货合约,gemini双子星交易所 BTCUSD现货,Hitbit交易所 BTCUSDT现货,huobi火币交易所 BTCUSDT现货,KRAKEN交易所 XBTUSD现货,OKCOIN OKEX交易所 BTCUSD3M OK BTC季度合约 BTCUSD BTCUSD2W OK BTC次周合约,Poloniex BTCUSDT现货等2小时区间的btc交易。
Bitmex XBTUSD 2H 比特币期货 2 hours Bitcoin Futures
Binance BTCUSDT 2H 比特币期货 2 hours Bitcoin spot
这个指标具有广泛的适用性,可以适用多个不同交易品种。
该指标还适用于ETHUSD交易品种等,只需调整默认配置即可。
Bitmex EOSBTC 30分钟 EOS合约 30分钟 ETHUSD Futures
Bitmex XRPBTC 30分钟 XRP合约 30分钟 ETHUSD Futures
使用该指标的警报设置,它可以在自动交易机器人上很好地工作,而无重绘错误的信号。
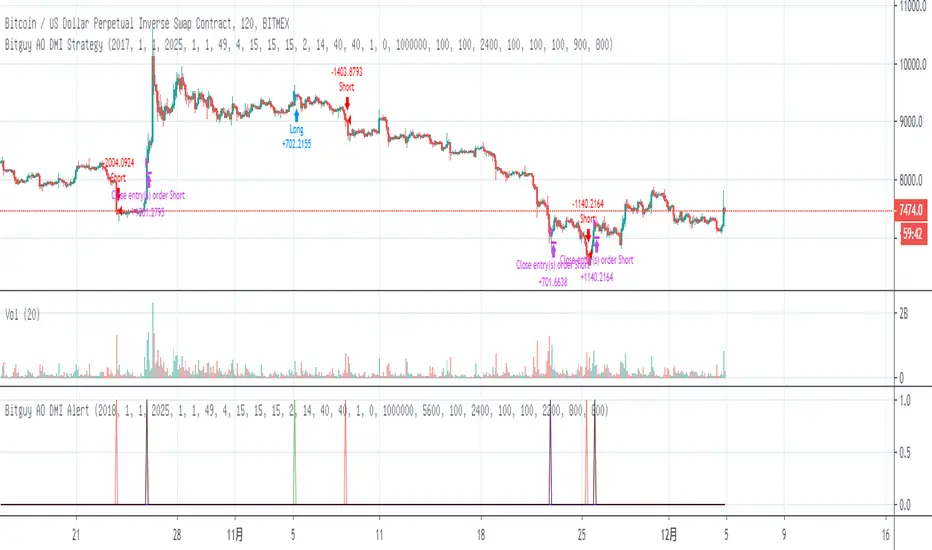
BITMEX Bybit binance Bitfinex BTC ETH AO DMI TREND AlertBITMEX Bybit binance Bitfinex Coinbase OKCOIN BTC ETH AO DMI TREND Alert
This is a very effective trend strategy.
BITMEX Bybit binance Bitfinex BTC ETH AO DMI TREND strategy
Strategy principle
HOW TO USE
set long position when a green arrow appears in the chart.
set short position when a red arrow appears in the chart.
For the long position and the short direction, you can set the stop profit & stop loss or trailing profit stop & trailing stop loss respectively.
When a purple arrow appears to close a position, an aggressive trader can go in the opposite direction when it is purple.
Strategy applicability
The default setting is for bitmex perpetual swap contract XBTUSD , bybit BTCUSD perpetual futures contract ,binance btcusdt Spot,Bitfinex BTCUSD Spot,bitflyer BTCJPY Spot,bithumb BTCKRW Spot,bitso BTCMXN Spot, bitstamp BTCUSD Spot,bittrex BTCUSDT Spot,Coinbase BTCUSD spot, deribit BTCPERP perpetual futures contract,gemini BTCUSD Spot,Hitbit BTCUSDT Spot,huobi BTCUSDT Spot KRAKEN XBTUSD spot,OKCOIN OKEX BTCUSD3M BTCUSD BTCUSD2W,Poloniex BTCUSDT Spot etc btc symbol with 30 minutes timeframe.
This indicator has broad applicability and can be applied to multiple different symbols.
This indicator also applies to the ETHUSD symbol etc, just adjust the default configuration.
Using the alert of the indicator, it can work well on the trading robot like Gunbot,autoview, without repaint false signals.
这是非常有效的趋势策略。
如何使用
在图表中出现绿色线就做多。
在图表中出现红色线就做空。
对于多头头寸和空头方向,您可以分别设置止损和止损或尾随利润止损和尾随止损;当出现紫色箭头时平仓,激进的交易者,可以在紫色时就做反方向。
策略适用性
默认设置是针对bitmex交易所 XBTUSD永久掉期合约,BYBIT交易所 BTCUSD永续期货合约,binance币安交易所 btcusdt现货,Bitfinex交易所 BTCUSD现货,bitflyer交易所 BTCJPY现货,bithumb交易所 BTCKRW现货,bitso交易所 BTCMXN现货,bitstamp交易所 BTCUSD现货,bittrex交易所 BTCUSDT现货,Coinbase交易所 BTCUSD现货,deribit交易所 BTCPERP永续期货合约,gemini双子星交易所 BTCUSD现货,Hitbit交易所 BTCUSDT现货,huobi火币交易所 BTCUSDT现货,KRAKEN交易所 XBTUSD现货,OKCOIN OKEX交易所 BTCUSD3M OK BTC季度合约 BTCUSD BTCUSD2W OK BTC次周合约,Poloniex BTCUSDT现货等2小时区间的btc交易。
Bitmex XBTUSD 2H 比特币期货 2 hours Bitcoin Futures
Bitmex XBTUSD 30分钟 比特币期货 30 minutes Bitcoin Futures
这个指标具有广泛的适用性,可以适用多个不同交易品种。
该指标还适用于ETHUSD交易品种等,只需调整默认配置即可。
Bybit ETHUSD 30分钟 以太币合约 30分钟 ETHUSD Futures
使用该指标的警报设置,它可以在自动交易机器人上很好地工作,而无重绘错误的信号。

BITMEX Bybit binance Bitfinex BTC ETH AO DMI TREND strategyBITMEX Bybit binance Bitfinex Coinbase OKCOIN BTC ETH AO DMI TREND strategy
This is a very effective trend strategy.
Strategy principle
HOW TO USE
set long position when a green arrow appears in the chart.
set short position when a red arrow appears in the chart.
For the long position and the short direction, you can set the stop profit & stop loss or trailing profit stop & trailing stop loss respectively.
When a purple arrow appears to close a position, an aggressive trader can go in the opposite direction when it is purple.
Strategy applicability
The default setting is for bitmex perpetual swap contract XBTUSD , bybit BTCUSD perpetual futures contract ,binance btcusdt Spot,Bitfinex BTCUSD Spot,bitflyer BTCJPY Spot,bithumb BTCKRW Spot,bitso BTCMXN Spot, bitstamp BTCUSD Spot,bittrex BTCUSDT Spot,Coinbase BTCUSD spot, deribit BTCPERP perpetual futures contract,gemini BTCUSD Spot,Hitbit BTCUSDT Spot,huobi BTCUSDT Spot KRAKEN XBTUSD spot,OKCOIN OKEX BTCUSD3M BTCUSD BTCUSD2W,Poloniex BTCUSDT Spot etc btc symbol with 30 minutes timeframe.
This indicator has broad applicability and can be applied to multiple different symbols.
This indicator also applies to the ETHUSD symbol etc, just adjust the default configuration.
Using the alert of the indicator, it can work well on the trading robot like Gunbot,autoview, without repaint false signals.
这是非常有效的趋势策略。
如何使用
在图表中出现绿色线就做多。
在图表中出现红色线就做空。
对于多头头寸和空头方向,您可以分别设置止损和止损或尾随利润止损和尾随止损;当出现紫色箭头时平仓,激进的交易者,可以在紫色时就做反方向。
策略适用性
默认设置是针对bitmex交易所 XBTUSD永久掉期合约,BYBIT交易所 BTCUSD永续期货合约,binance币安交易所 btcusdt现货,Bitfinex交易所 BTCUSD现货,bitflyer交易所 BTCJPY现货,bithumb交易所 BTCKRW现货,bitso交易所 BTCMXN现货,bitstamp交易所 BTCUSD现货,bittrex交易所 BTCUSDT现货,Coinbase交易所 BTCUSD现货,deribit交易所 BTCPERP永续期货合约,gemini双子星交易所 BTCUSD现货,Hitbit交易所 BTCUSDT现货,huobi火币交易所 BTCUSDT现货,KRAKEN交易所 XBTUSD现货,OKCOIN OKEX交易所 BTCUSD3M OK BTC季度合约 BTCUSD BTCUSD2W OK BTC次周合约,Poloniex BTCUSDT现货等2小时区间的btc交易。
Bitmex XBTUSD 2H 比特币期货 2 hours Bitcoin Futures
Bitmex XBTUSD 30分钟 比特币期货 30 minutes Bitcoin Futures
这个指标具有广泛的适用性,可以适用多个不同交易品种。
该指标还适用于ETHUSD交易品种等,只需调整默认配置即可。
Bybit ETHUSD 30分钟 以太币合约 30分钟 ETHUSD Futures
使用该指标的警报设置,它可以在自动交易机器人上很好地工作,而无重绘错误的信号。
BEAM BandsBEAM Bands is a version of the BEAM indicator that is drawn directly on the price chart. It is a more visual representation of BEAM and lets you compare it directly to the price.
Disclaimer: This is not financial advice. For educational purposes only.
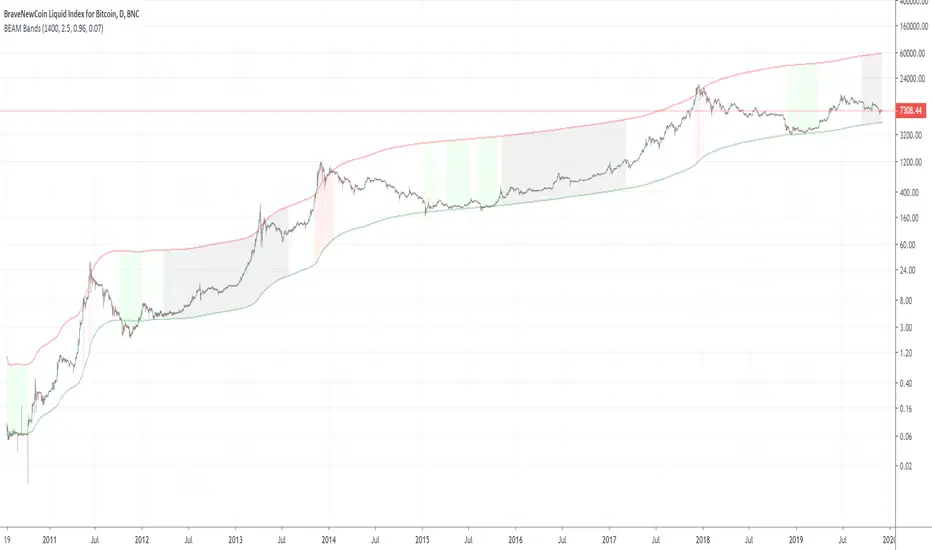
BEAMThe BEAM indicator helps identifying promising times during a cycle for buying and selling Bitcoin or other crypto currencies. It can also be used with gold or silver after adjusting its parameters, but does not work very well with stocks.
Disclaimer: This is not financial advice. For educational purposes only.

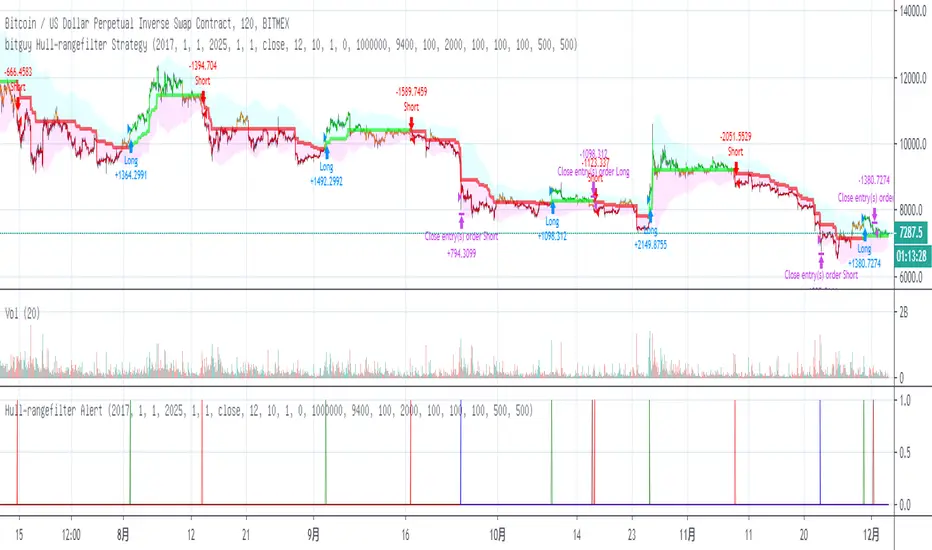
BITMEX Bybit binance BTC ETH HR TREND strategyBITMEX Bybit binance Bitfinex Coinbase OKCOIN BTC ETH HR TREND strategy
This is a very effective trend strategy.
Strategy principle
HOW TO USE
set long position when a green arrow appears in the chart.
set short position when a red arrow appears in the chart.
For the long position and the short direction, you can set the stop profit & stop loss or trailing profit stop & trailing stop loss respectively.
When a purple arrow appears to close a position, an aggressive trader can go in the opposite direction when it is purple.
Strategy applicability
The default setting is for bitmex perpetual swap contract XBTUSD , bybit BTCUSD perpetual futures contract ,binance btcusdt Spot,Bitfinex BTCUSD Spot,bitflyer BTCJPY Spot,bithumb BTCKRW Spot,bitso BTCMXN Spot, bitstamp BTCUSD Spot,bittrex BTCUSDT Spot,Coinbase BTCUSD spot, deribit BTCPERP perpetual futures contract,gemini BTCUSD Spot,Hitbit BTCUSDT Spot,huobi BTCUSDT Spot KRAKEN XBTUSD spot,OKCOIN OKEX BTCUSD3M BTCUSD BTCUSD2W,Poloniex BTCUSDT Spot etc btc symbol with 30 minutes timeframe.
This indicator has broad applicability and can be applied to multiple different symbols.
This indicator also applies to the ETHUSD symbol etc, just adjust the default configuration.
Using the alert of the indicator, it can work well on the trading robot like Gunbot,autoview, without repaint false signals.
这是非常有效的趋势策略。
如何使用
在图表中出现绿色线就做多。
在图表中出现红色线就做空。
对于多头头寸和空头方向,您可以分别设置止损和止损或尾随利润止损和尾随止损;当出现紫色箭头时平仓,激进的交易者,可以在紫色时就做反方向。
策略适用性
默认设置是针对bitmex交易所 XBTUSD永久掉期合约,BYBIT交易所 BTCUSD永续期货合约,binance币安交易所 btcusdt现货,Bitfinex交易所 BTCUSD现货,bitflyer交易所 BTCJPY现货,bithumb交易所 BTCKRW现货,bitso交易所 BTCMXN现货,bitstamp交易所 BTCUSD现货,bittrex交易所 BTCUSDT现货,Coinbase交易所 BTCUSD现货,deribit交易所 BTCPERP永续期货合约,gemini双子星交易所 BTCUSD现货,Hitbit交易所 BTCUSDT现货,huobi火币交易所 BTCUSDT现货,KRAKEN交易所 XBTUSD现货,OKCOIN OKEX交易所 BTCUSD3M OK BTC季度合约 BTCUSD BTCUSD2W OK BTC次周合约,Poloniex BTCUSDT现货等2小时区间的btc交易。
Bitmex XBTUSD 89分钟 比特币期货 89 minutes Bitcoin Futures
Bitmex XBTUSD 2H 比特币现货 2 hours Bitcoin Futures
Bitmex XBTUSD 1小时 比特币期货 1 hour Bitcoin Futures
Bybit BTCUSD 1小时 比特币合约 1 hour Bitcoin Futures
binance BTCUSDT 1H 比特币现货 1 hours Bitcoin Spot
这个指标具有广泛的适用性,可以适用多个不同交易品种。
该指标还适用于ETHUSD交易品种等,只需调整默认配置即可。
Bitmex ETHUSD 1小时 以太币合约 1H ETHUSD Futures
Binance ETHUSD 1小时 以太币现货 1H ETHUSD Spot
Bybit ETHUSD 1小时 以太币合约 1H ETHUSD Futures
使用该指标的警报设置,它可以在自动交易机器人上很好地工作,而无重绘错误的信号。
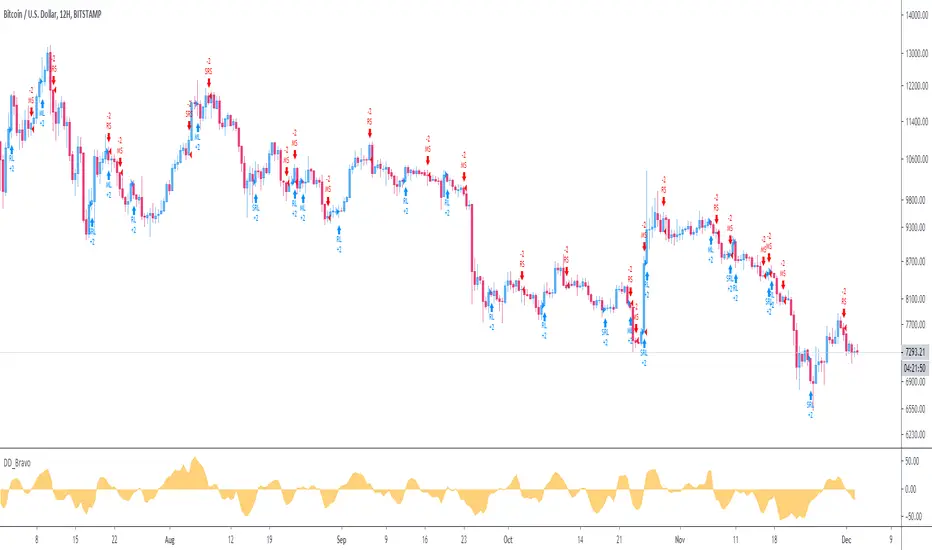
DD_Bravo_StrategyThe DD_Bravo_Strategy is a mean reversal strategy that captures oversold or overbought levels, and accordingly goes long or short. It is based on price difference between successive candles and normalization of this difference. It works best on 12H timeframe for BTCUSD.
DM me for details for access.
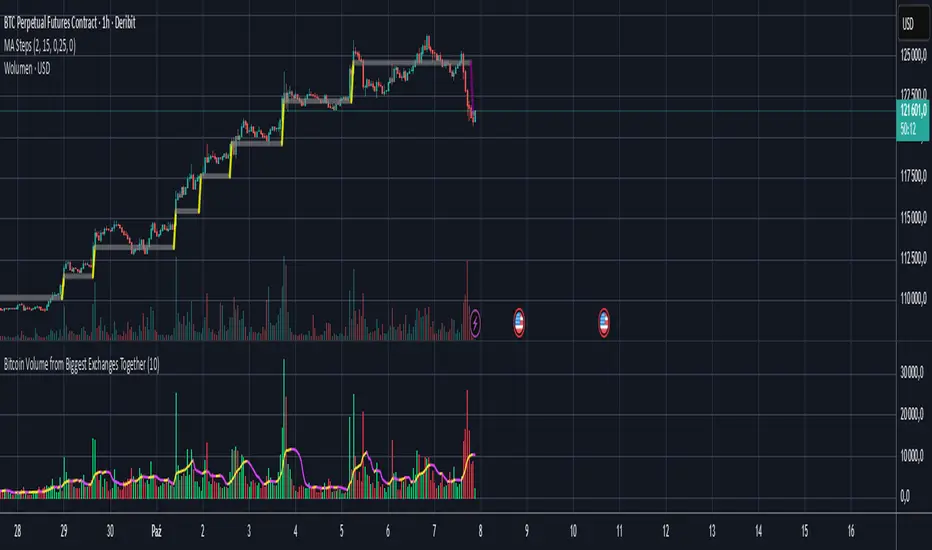
Bitcoin Volume from Biggest Exchanges TogetherEnglish description:
With this script you can see BTC to Fiat/Stable/Contracts together on one volume chart:
- Fiat exchanges: Bitfinex, Coinbase, Bitstamp, Kraken, Gemini, Bittrex
- Stable coins exchanges (USDT for now): Binance, Poloniex, Bitterx
- Contract exchange: Bitmex
Polish description:
Dzięki temu skryptowi możesz wyświetlić na jedym wykresie wolumen BTC do Fiato/Stable coinów/Kontraktów:
- Giełdy z parami do walut fiducjarnych/Fiat: Bitfinex, Coinbase, Bitsamp, Kraken, Gemini, Bittrex
- Giełdy z parą do Stable-coinów(USDT): Binance, Poloniex, Bittrex
- Giełda z kontraktami terminowymi: Bitmex
Ace Pro Long Indicator - 1 Minute BTCUSD Bitcoin ChartThe Ace Pro Long Indicator calculates overbought and oversold conditions.
It focuses on momentum to identify whether the market is overbought or oversold.
If it detects that the market is oversold, it gives an alert of “long entry”
If it detects that the market is overbought, it gives an alert of “long exit”
Users are also able to set notifications on Tradingview with this version of the indicator.
To set an alert, after adding the indicator, at the top left of the chart where the indicator is listed, click on the "more" option (three dots), and then select "Add alert."
Please note the following:
The Ace Pro Long indicator is designed only for use on the 1 minute Bitstamp BTCUSD chart.
It is only to be used for opening and closing long positions.
It is not recommended for use with short positions.
It is not recommended for use with time frames other than the 1 minute.
In a sideways market, or during a violent move, it is likely to produce false signals.
Traders must use confluence from their technical analysis to enter trades.
Because this is an invite only script, users with a free Tradingview account will not be able to obtain access.
Traders must use confluence from their technical analysis to enter trades.

Ace Pro Short Indicator - 1 Minute BTCUSD Bitcoin Chart The Ace Pro Short calculates overbought and oversold conditions.
It focuses on momentum to identify whether the market is overbought or oversold.
If it detects that the market is overbought, it gives an alert of “Short Entry”
If it detects that the market is oversold, it gives an alert of “Close Short”
Users are also able to set notifications on Tradingview with this version of the indicator.
To set an alert, after adding the indicator, at the top left of the chart where the indicator is listed, click on the "more" option (three dots), and then select "Add alert."
Please note the following:
The Ace Pro Short indicator is designed only for use on the 1 minute Bitstamp BTCUSD chart.
It is only to be used for opening and closing short positions.
It is not recommended for use with long positions.
It is not recommended for use with time frames other than the 1 minute.
In a sideways market, or during a violent move, it is likely to produce false signals.
Traders must use confluence from their technical analysis to enter trades.
Because this is an invite only script, users with a free Tradingview account will not be able to obtain access.
Traders must use confluence from their technical analysis to enter trades.

BITMEX Bybit binance HUOBI OKCOIN BTC ETH TREND ATR alertBITMEX Bybit binance HUOBI Coinbase OKCOIN BTC ETH TREND ATR alert
This is a very effective trend strategy.
Strategy principle
HOW TO USE
set long position when a green arrow appears in the chart.
set short position when a red arrow appears in the chart.
For the long position and the short direction, you can set the stop profit & stop loss or trailing profit stop & trailing stop loss respectively.
When a purple arrow appears to close a position, an aggressive trader can go in the opposite direction when it is purple.
Strategy applicability
The default setting is for bitmex perpetual swap contract XBTUSD , bybit BTCUSD perpetual futures contract ,binance btcusdt Spot,Bitfinex BTCUSD Spot,bitflyer BTCJPY Spot,bithumb BTCKRW Spot,bitso BTCMXN Spot, bitstamp BTCUSD Spot,bittrex BTCUSDT Spot,Coinbase BTCUSD spot, deribit BTCPERP perpetual futures contract,gemini BTCUSD Spot,Hitbit BTCUSDT Spot,huobi BTCUSDT Spot KRAKEN XBTUSD spot,OKCOIN OKEX BTCUSD3M BTCUSD BTCUSD2W,Poloniex BTCUSDT Spot etc btc symbol with 30 minutes timeframe.
This indicator has broad applicability and can be applied to multiple different symbols.
This indicator also applies to the ETHUSD symbol etc, just adjust the default configuration.
Using the alert of the indicator, it can work well on the trading robot like Gunbot,autoview, without repaint false signals.
这是非常有效的趋势策略。
如何使用
在图表中出现绿色箭头就做多。
在图表中出现红色箭头就做空。
对于多头头寸和空头方向,您可以分别设置止损和止损或尾随利润止损和尾随止损;当出现紫色箭头时平仓,激进的交易者,可以在紫色时就做反方向。
策略适用性
默认设置是针对bitmex交易所 XBTUSD永久掉期合约,BYBIT交易所 BTCUSD永续期货合约,binance币安交易所 btcusdt现货,Bitfinex交易所 BTCUSD现货,bitflyer交易所 BTCJPY现货,bithumb交易所 BTCKRW现货,bitso交易所 BTCMXN现货,bitstamp交易所 BTCUSD现货,bittrex交易所 BTCUSDT现货,Coinbase交易所 BTCUSD现货,deribit交易所 BTCPERP永续期货合约,gemini双子星交易所 BTCUSD现货,Hitbit交易所 BTCUSDT现货,huobi火币交易所 BTCUSDT现货,KRAKEN交易所 XBTUSD现货,OKCOIN OKEX交易所 BTCUSD3M OK BTC季度合约 BTCUSD BTCUSD2W OK BTC次周合约,Poloniex BTCUSDT现货等2小时区间的btc交易。
Bitmex XBTUSD 90分钟 比特币期货 90 minutes Bitcoin Futures
Bitmex XBTUSD 2H 比特币现货 2 hours Bitcoin Futures
Bitmex XBTUSD 16分钟 比特币期货 90 minutes Bitcoin Futures
这个指标具有广泛的适用性,可以适用多个不同交易品种。
该指标还适用于ETHUSD交易品种等,只需调整默认配置即可。
Bitmex ETHUSD 2H 以太币合约
Bitmex ETHUSD 30 以太币合约
Bybit ETHUSD 30分钟合约
使用该指标的警报设置,它可以在自动交易机器人上很好地工作,而无重绘错误的信号。
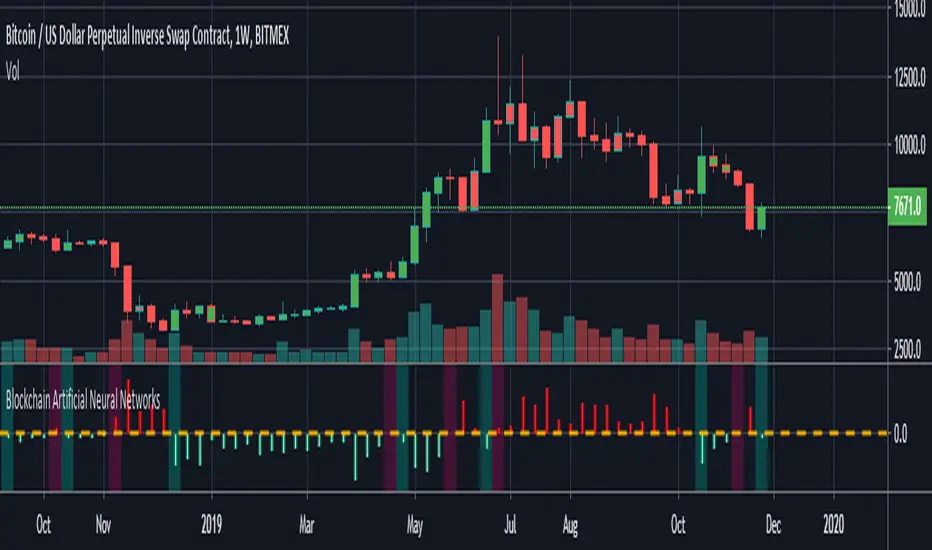
Blockchain Artificial Neural NetworksI found a very high correlation in a research-based Artificial Neural Networks.(ANN)
Trained only on daily bars with blockchain data and Bitcoin closing price.
NOTE: It does not repaint strictly during the weekly time frame. (TF = 1W)
Use only for Bitcoin .
Blockchain data can be repainted in the daily time zone according to the description time.
Alarms are available.
And you can also paint bar colors from the menu by region.
After making reminders, let's share the details of this interesting research:
INPUTS :
1. Average Block Size
2. Api Blockchain Size
3. Miners Revenue
4. Hash Rate
5. Bitcoin Cost Per Transaction
6. Bitcoin USD Exchange Trade Volume
7. Bitcoin Total Number of Transactions
OUTPUTS :
1. One day next price close (Historical)
TRAINING DETAILS :
Learning cycles: 1096436
AutoSave cycles: 100
Grid :
Input columns: 7
Output columns: 1
Excluded columns: 0
Training example rows: 446
Validating example rows: 0
Querying example rows: 0
Excluded example rows: 0
Duplicated example rows: 0
Network :
Input nodes connected: 7
Hidden layer 1 nodes: 5
Hidden layer 2 nodes: 0
Hidden layer 3 nodes: 0
Output nodes: 1
Controls :
Learning rate: 0.1000
Momentum: 0.8000
Target error: 0.0100
Training error: 0.010571
The average training error is really low, almost worth the target.
Without using technical analysis data, we established Artificial Neural Networks with blockchain data.
Interesting!
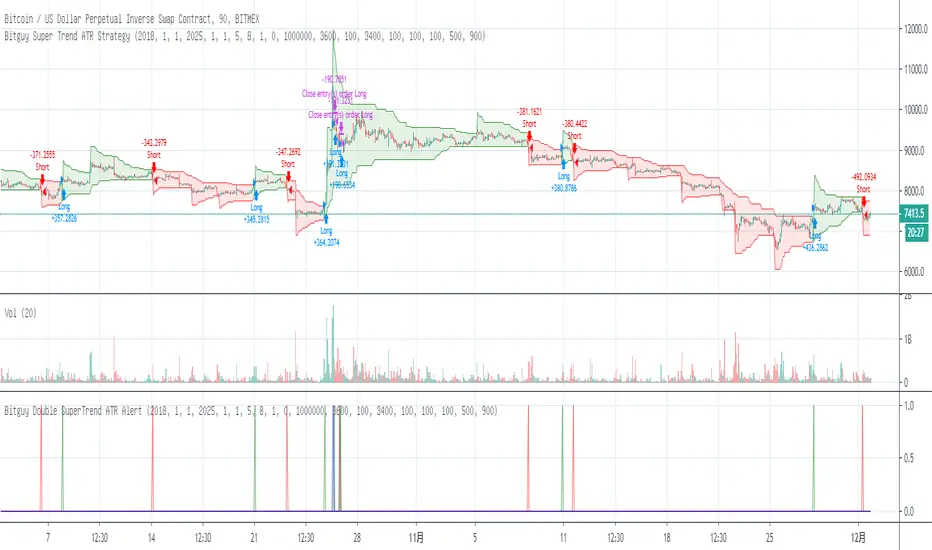
BITMEX Bybit binance bitstamp Coinbase HUOBI BTC ETH TRENDBITMEX Bybit binance bitstamp Coinbase HUOBI BTC ETH TREND
This is a very effective trend strategy.
Strategy principle
Constructs the trailing ATR stop above or below the price, and switches directions when the source price breaks the ATR stop.
Uses the Average Directional Index (ADX) to switch between ATR multipliers. The higher multiplier is used when the ADX is rising, and the lower ATR multiplier is used with the ADX is falling.
This ADX criteria further widens the gap between the source price and the trailing ATR stop when the price is trending,and lessens the gap between the ATR and the price when then price is not trending.
The ATR-ADX stop is effectively a double adapative stop that trails the price,by both adapting to the true range of the price, and the average directional change.
HOW TO USE
set long position when a green arrow appears in the chart.
When the stop is below the price (long trade) the value never decreases until the price intersects the stop, and it reverses to being above the price (short trade)。
set short position when a red arrow appears in the chart.
When the stop is above the price it will never increase until it is intersected by the price. As the true range and ADX change, the stop will move more quickly or more slowly.
For the long position and the short direction, you can set the stop profit & stop loss or trailing profit stop & trailing stop loss respectively.
When a purple arrow appears to close a position, an aggressive trader can go in the opposite direction when it is purple.
Strategy applicability
The default setting is for bitmex perpetual swap contract XBTUSD , bybit BTCUSD perpetual futures contract ,binance btcusdt Spot,Bitfinex BTCUSD Spot,bitflyer BTCJPY Spot,bithumb BTCKRW Spot,bitso BTCMXN Spot, bitstamp BTCUSD Spot,bittrex BTCUSDT Spot,Coinbase BTCUSD spot, deribit BTCPERP perpetual futures contract,gemini BTCUSD Spot,Hitbit BTCUSDT Spot,huobi BTCUSDT Spot KRAKEN XBTUSD spot,OKCOIN OKEX BTCUSD3M BTCUSD BTCUSD2W,Poloniex BTCUSDT Spot etc btc symbol with 2 hour timeframe.
This indicator has broad applicability and can be applied to multiple different symbols.
This indicator also applies to the ETHUSD ETHBTC EOSBTC BNBBTC symbol etc, just adjust the default configuration.
Using the alert of the indicator, it can work well on the trading robot like Gunbot,autoview, without repaint false signals.
这是非常有效的趋势策略。
策略原理
在价格之上或之下构造追踪的支撑压力位并在源价格突破压力位时的切换操作方向,使用平均趋向指数(ADX)与ATR系数之间切换。
当ADX上升时使用上升的ATR系数,而ADX时下降时使用下降的ATR系数。
当价格趋势变化时,ADX参数在价格趋向变大时使源价格止损点与后续ATR进一步扩大,并在价格趋向平缓时减小了ATR与价格之间的差距。
如何使用
ATR-ADX压力线通过适应价格的真实波动范围和平均趋向变动达到跟随价格的双适应性止损目的。当做多时,止损线低于价格,并随价格升高,直到止损线与价格相交,然后反转至高于价格,此时启动空头交易;
在图表中出现绿色箭头就做多。
当做空时,止损线高于价格,并随价格降低,直到止损线与价格相交,然后反转至低于价格,此时启动多头交易;在图表中出现红色箭头就做空。随着真实波动和ADX的变化,止损线将移动得更快或更慢。
对于多头头寸和空头方向,您可以分别设置止损和止损或尾随利润止损和尾随止损;当出现紫色箭头时平仓,激进的交易者,可以在紫色时就做反方向。
策略适用性
默认设置是针对bitmex交易所 XBTUSD永久掉期合约,BYBIT交易所 BTCUSD永续期货合约,binance币安交易所 btcusdt现货,Bitfinex交易所 BTCUSD现货,bitflyer交易所 BTCJPY现货,bithumb交易所 BTCKRW现货,bitso交易所 BTCMXN现货,bitstamp交易所 BTCUSD现货,bittrex交易所 BTCUSDT现货,Coinbase交易所 BTCUSD现货,deribit交易所 BTCPERP永续期货合约,gemini双子星交易所 BTCUSD现货,Hitbit交易所 BTCUSDT现货,huobi火币交易所 BTCUSDT现货,KRAKEN交易所 XBTUSD现货,OKCOIN OKEX交易所 BTCUSD3M OK BTC季度合约 BTCUSD BTCUSD2W OK BTC次周合约,Poloniex BTCUSDT现货等2小时区间的btc交易。
Bitmex XBTUSD 2H 比特币合约
Binance币安 BTCUSDT 2H 比特币现货
Bitfinex BTCUSD 2H 比特币现货
Bitstamp BTCUSD 2H 比特币现货
COINBASE BTCUSD 2H 比特币现货
HUOBI火币 BTCUSDT 2H 比特币现货
OKEX BTCUSD3M 2H 比特币季度合约
Bybit BTCUSD 2H 比特币合约
这个指标具有广泛的适用性,可以适用多个不同交易品种。
该指标还适用于ETHUSD ETHBTC EOSBTC BNBBTC交易品种等,只需调整默认配置即可。
bitmex ETHUSD 2H期货
binance ETHUSDT 2H现货
Bybit ETHUSD 2H合约
HUOBI火币 ETHUSDT 2H现货
OKCOIN ETHUSD1W 2H期货
binance币安EOSBTC 2H
Binance币安 ETHBTC 2H
使用该指标的警报设置,它可以在自动交易机器人上很好地工作,而无重绘错误的信号。

[BA] Multi Time Frame Moving Averages for BTCThis is a multi time frame moving average script. It includes 7 moving averages. Most of them are SMAs and WMAs but EMA were also used. Time frame was set to 1 day. It means that you can change the time frame of your chart freely without losing your lines. Levels will not change.
I wrote this script just to trade BTC. I prefer daily and weekly charts with this script but lower time frames are also preferable.
Since some of the lengths are too high; older exchanges are recommended due to their relatively deep historical data.
While MA1 is for taking actions like 'take profit' or 'stop loss' or just to follow 'price action' easily, other MAs are for seeing supports and resistances.
MA6 and MA7 are disabled by default in order to minimize the confusion but you can enable them from settings if you need to.
Since some newer exchanges have less historical data, you may not see MA4 and MA5 on the daily chart. In such circumstances MA6 and MA7 might be helpful to use as substitution. Some may like to use all of them.
I am using this script just for BTC but it can be useful for other coins as well.

Cracking Cryptocurrency - ParalloxParallox
Many traders are familiar with or utilize the Relative Strength Index ( RSI ) and/or the Commodity Channel Index ( CCI ). For good reason, these classic and simple to understand indicators have made their way into many traders indicator bays with mixed results. As we often do with our trading style and indicators here at Cracking Cryptocurrency is take things that traders have used one way and attempt to view it in a different light to improve our trading efficiency and performance. That is what we have done with Parallox.
Parallox harnesses the calculations of both the Relative Strength Index and Commodity Channel Index , but through a calculation for a new breed of trader and a new market. RSI and CCI were designed to work in the stock markets of old, and their effectiveness nowadays is more-so due to the "self fulfilling prophecy" concept of so many traders using them rather then their technical applicability to any particular market or market circumstance. Moreover, because so many retail traders now utilize the RSI and CCI , trading it the traditional way, for reversals, has created a golden zone of opportunity for larger traders, institutions, and whales to come in and grab the liquidity of counter-trend retail traders basing their signals off of overbought and oversold conditions in the market utilizing RSI and CCI .
What Parallox does is quite different. Instead of relying on the readings of RSI and CCI , it looks at the value of RSI relative to the value of CCI . By looking at the convergence or divergence of these two indicators, a much more accurate reading of the directional trend can be established. No more using these oscillators to pick false tops and bottoms, instead we can utilize their relative conditions to determine market trend. Not only that, but we can identify objective signals when we cross the barrier between convergence and divergence, therefore giving us clear buy and sell signals for any trading asset.
However, we haven't left reversal traders completely by the way side. What is often an "entry" point for reversal traders, when one has determined that the particular direction of the market is at it's extreme, is where Parallox crosses back the other way, identifying an "overbought" and "oversold" region of sorts, from which we can utilize as an exit indicator when in deeply profitable trending trades.
How to Use
Using Parallox is quite simple. It can be utilized as an Initiator or Confirmer, or also as a longer-term directional marker on any time frame. In it's most simple form, the Parallox Line will cross zero from below and the line will turn green. This is an indication that the market has moved from a bearish zone of control to a bullish zone of control, and can be viewed as a potential buy signal. Conversely, when the line crosses zero from above, the line will turn red, indicating the opposite and can be viewed as a potential short sell signal.
For exit indications in strongly trending markets, when the line goes below the lower dashed line when bearish , and above the upper dashed line when bullish , and comes either back below or back above, those can be seen as trend exhaustion signals and often represent great moments to take profit or to go flat in the market until another trend establishes itself.
Settings
Let's take a look at the settings of Parallox.
First, we can input the look back length we want for our RSI and CCI indicators. You will notice that the defaults are unnatural, that is because they are tuned specifically for the BTC USD market. When trading a different asset, you will want to experiment with the optimum look back length for the best signals.
We then take a moving average of our indicators to have plotted values to work with. As above, the look back lengths for the two moving averages are optimized for BTC USD. The same caveats for optimization apply.
Then we can select the smoothing, or type of moving average we wish to utilize. Parallox performs well with different types of moving average smoothing, and I recommend that you experiment with your style of trade to find the signals that best suit your trading system.
We can also select the source of our indicator values. By default, this is hl2 , which I find to be the best for most indicators, in a close tie with hlc3.
Strategy
Please let me know of your success stories, as well as any features you think would be helpful to add. If you notice any errors within it, please notify me so I can fix them. Trade Safely.

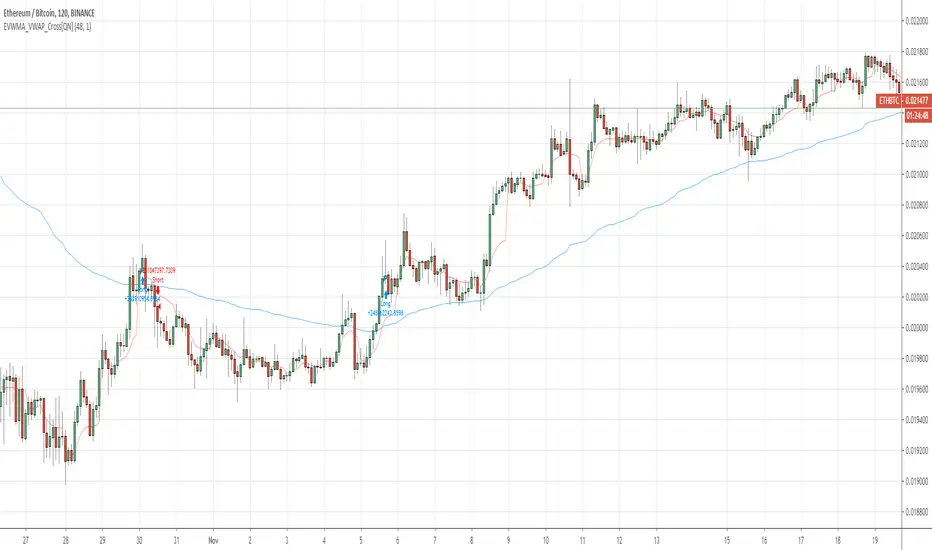
EVWMA VWAP Cross Strategy [QuantNomad]Continue to experiement with VWAP and EVWMA.
It seems that just simple crosses between VWAP and EVWMA can be pretty good signals. VWAP is a bit choppy so you can use VWAP smoothing input to smoth it a bit.
Here are few other strategies based on EVWMA:
EVWMA VWAP MACD Strategy
QuantNomad - EVWMA MACD Strategy
[SignalFI] MACD PrimeWelcome! As part of our continual process to build and enhance trusted existing indicators, we're proud to release MACD Prime to the PRIME series for those traders that rely on the popular divergence mechanics traditional MACD provides.
MACD Prime provides a default MACD structure using the popular 12,26 EMAs and a 9 lockback signal line as the core of the indicator's functionality. In this way, you will get a consistent view for what you're use to, but of course we've added additional functionality that can be used to increase the value this view provides when trading.
ADDITIONAL Functions:
1) MACD Fast and Slow EMA sources are selectable, thus allowing the user to select OHLC variants as the source input for the 12/26 trendlines.
2) Background Coloring is based on a secondary "Signal" color which be default has been set to 6. This length is configurable, and providing a leading edge to the typical "MACD Cross". Said simply, the background color will change with the trend BEFORE a default MACD cross occurs. This may provide early warning of a MACD cross, and allow for additional entry/exit signals to manifest depending on other confluence with price and trend information.
3) MACD Trend Lines. In accordance with the PRIME series MACD Prime comes bundled with Trend Line support and resistance pivots that provide additional context for how the MACD may act based on a previous and projected trend line information. By default projections are turned off, but can be enabled from within the menu options. These trendlines can be used to spot divergences as well, and can be tuned within the option to increase resolution or decrease noise provided by trend lines.
All other standard functions persist, including the typical MACD line, MACD Signal Line, and MACD Histogram.
SignalFI was created to help traders and investors to effectively analyze the market based on the Golden Mean Ratio (Fibonacci numbers), plan a trade and ultimately execute it. To help inform and educate market decisions we developed a set of Trading Indicators which are available on TradingView.
SignalFI indicators are just that, indicators. Our indicators are generally configured to use completely historical data (negating repaint), and we advise all alerts created with SignalFI indicators to be fired upon "close" of the current candle. Our indicators can provide valuable context and visualization support when performing market analysis and executing buy and sell decisions. However. we are not financial experts, and all information presented on this site or our other media outlets are for educational purposes only.

SAMURAI SWORDSamurai Sword is an add on tool for Ninja Scalper and the next evolution of the Trend Trade Indicator.
It auto plots the fib retracement to speed up target acquisition support and resistance areas based on the formula to increase the success rate of trade entry and exits.
None of this is to be taken as investment advice but rather Edutainment and infotainment
#TradeSocially

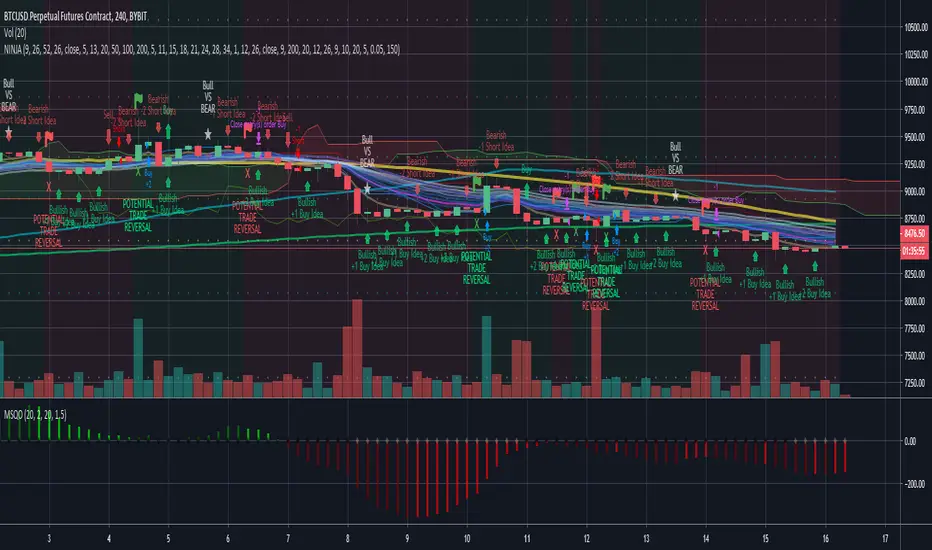
BTC BRAWL NINJA TRADERThe NINJA TRADER was devloped for trading competition higher leverage scalp trading. It is a modified from my Trade Trend Indicator (indicator) has been the brain child of 23 years of trading experience rolled into a simple to understand all market setup alert system based solely on 5 high probability trade set ups with a 6th high risk. The hope is to provide something that is can assist traders in building confidence in their trades with a little assistance from the indicator.
This like any and all indicators is not a be all and end to trading, yes while back tested the indicator has produced fantastic profitable results; past performance is not a guarantee of future but which with human intervention can increase the return result exponentially.
You need to be able to chart simple candle sticks and you need to have an understanding of support and resistance areas to make sense of what you are doing in trading otherwise even this indicator won't help you.
While this may alert buy or sell / long or short entrance these are to be taken as educational points of reference and if you wish to trade you are understanding that you enter and exit at your own risk. Not many indicators will alert you to the possibility of a rogue wave spike / dump or both, this will but everything is perspective of the time frame you are on.
The indicator is designed for the 4hour time frame with trade entry on the 15min and managed on the 30min time frame. Alot can happen within these time frame but as we know not every trader can sit in front of a screen for hours at a time and this let's one trade for swings. Once you have your entry you place your exits and you set your stops. If you wait for the alert to exit you are in a draw down this should never reach that point pay yourself for being right.
The set ups are simple:
1. Trend change from bearish to bullish buys are dip interim support entries.
2. Trend change from bullish to bearish sells are top interim resistance exits.
3. Blue buy is an entry position for a trade.
4. Blue long is an add position for a trade.
5. Red short is just that a short trade idea. (this is advanced and requires a manual cover target),
6. Green buy is a break out over the next candle to print above (highest risk)
All trades are based on a 5% to 10% of capital entry with no more than 40% ever in 1 trade goal is many consistent trade wins while limiting the losses and size.
Certain set ups such as longs over the Moving Averages but below the cloud can lead to strong rally returns as well as short in a bearish trend just above the Moving Averages can give prolonged selling pressure.
Pay attention to the golden dump line as it rises the closer to the candle it gets the higher the risk of the trade lacking continuation.
Made the golden dump line easier to bringing it forward.
Changed the trade trend reversal to stand out more as a marker of a trade even when alerts stacked
Added a calculation for the alert to recalculate based on the time frame chosen
Added a check balance verse the break out buy as to not false alert during the BTC BRAWL CHALLENGE in high risk trade setups
Added notification of bullvsbear action to avoid being caught in the BTC BRAWL CHALLENGE
Added a take profit reminder based on time frame volume
None of this is to be taken as investment advice but rather Edutainment and infotainment
//#TradeSocially
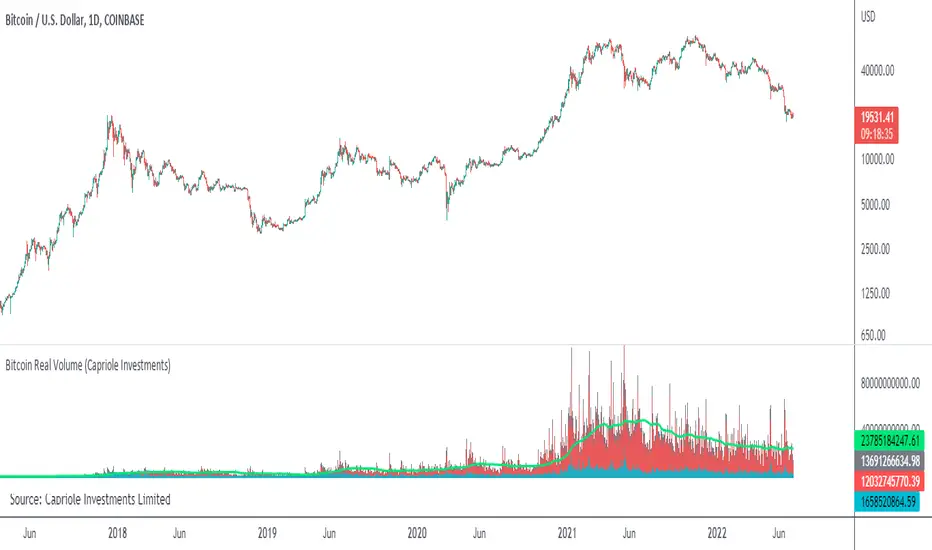
Bitcoin Real VolumeBitcoin’s Real Volume
An accurate read on the change in Bitcoin’s volume profile over time.
Based on 2019 reports by Bitwise and Alameda Research.
Please see the script code notes for assumptions and details on data selection.
Follow me for more information on this script.
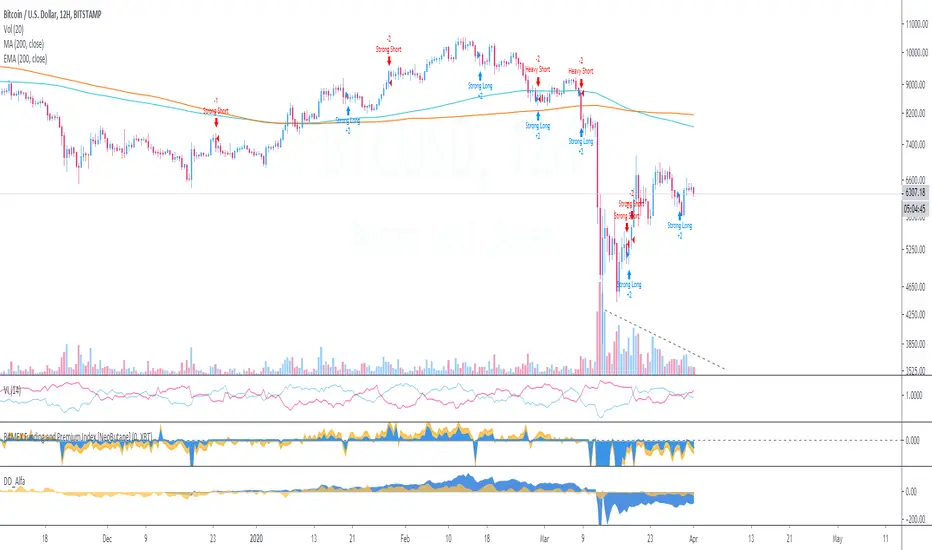
DD_Alfa_StrategyThis is my alfa strategy.
Backtested on the 12H timeframe from June 14, 2019 to November 11, 2019.
Summary:
Net Profit: 50.99%
B&H Return: - 4.49%
Max Drawdown: - 5.41%
Sharpe Ratio: 1.309
Profit Factor: 3.979
Hit Rate: 61.33% (Overall), 47.5% (Longs), 77.14% (Shorts)
Message me for access.
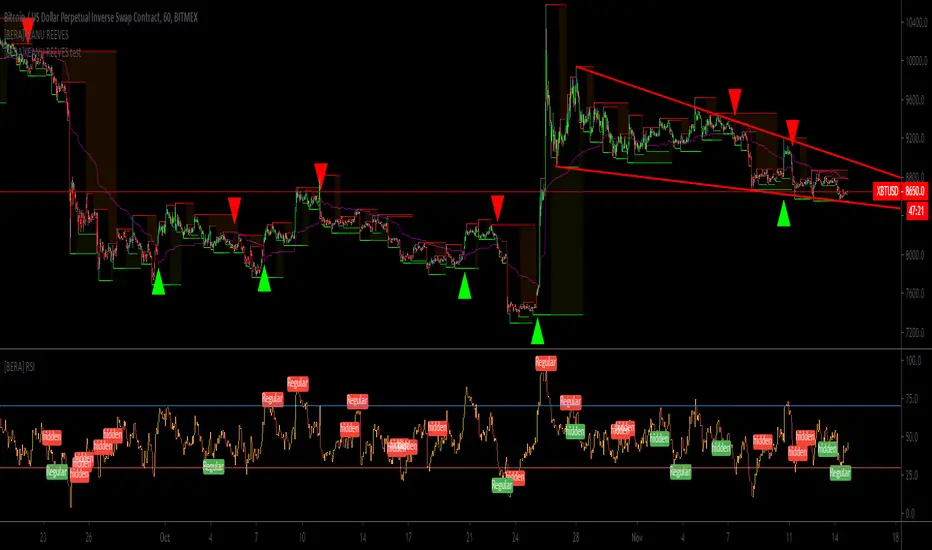
[BERA]KEANU REEVESThis is BUY/SELL indicator integrated with support and resistance (HIGH AND LOW).
THIS IS ONLY FOR TESTING PURPOSES(SOME PEOPLE ASKED ME A TRY), I WILL REMOVE IT.
Indicator based on Average true range .
LIME ARROW = LONG
RED ARROW = SHORT
LIME COLOR BARS IF GREEN ARROW CONDITION VALID.
RED COLOR BARS IF RED ARROW CONDITION VALID.
>CURRENT SETUP OF METRICS IS IDEAL FOR BTC H1 CHART, FOR ALTCOINS YOU SHOULD USE DIFFERENT METRICS,