Trend former ver stockTrend Former's stock version service indicator.
It is designed to be printed on daily and three-day bars.
Market characteristics require longer breathing than coin in position.
For further details, we will gradually increase the upload.
트랜드 포머의 주식버전 서비스 지표입니다.
일봉과 3일봉에서 출력되도록 설계 되어 있습니다.
마켓 특성상 포지션에서 코인보다는 더 긴 호흡을 요구합니다.
추가적인 자세한 설명은 점차 업로드를 늘려가도록 하겠습니다.
Btc!

HeiKin Crossover With Alerts [Lofi]HeiKin LoFi - Crossover With Alerts
The goal of this indicator is to plot stoch, rsi, ema values "as if" the chart is a true price action based on a Heiken-Ashi Chart. It can also be used on a regular candle stick setting or the original Heikin Ashi chart.
The script is currently under development and additional updates will be added based on performance from a 24/7 active bot that is using this on 1hr, 4hr, 12hr time frames. The output may vary slightly between different chart time frames for the same indicator settings. A bad setting would be something like a sub 10-15 minute chart with BTCUSDT binance although some progress has been made on lower time frames. I have added an adjustable setting window for user tuning.
This is an "Invite Only" script. Contact me for details.
User Interface/Detail Description:
- Green Arrow = Buy
- Red Arrow = Sell
- Purple Arrow = High Risk Long
- Yellow Arrow= High Risk Short
This indicator can be easily used with popular bot trading platforms. Feel free to contact me for details.
Can be used for all Charts
Basic Entry Chart Layout:
BITMEX:
BINANCE:
FOREX:
I allow users to tune functions for almost any time interval. example 5 Second Chart:
Intraday S/RPlots yesterday's low and high, and the current day's open, as intraday support/resistance levels.

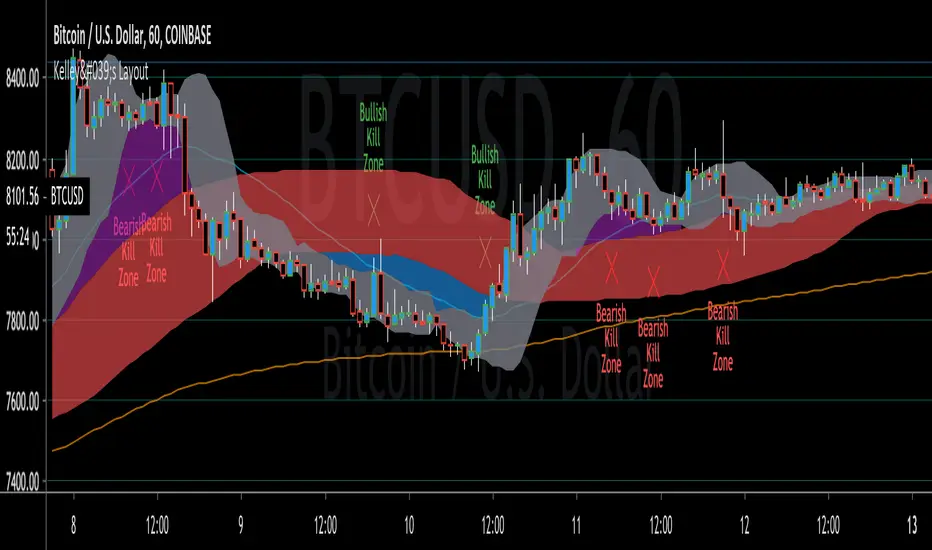
Kelley's LayoutWe use our own proprietary script with a collection of technical indicators that show support and resistance levels as well as momentum and trend direction. The Kelley’s Layout took over 2 years to prefect the formula that allows us to scalp the market in a safe conservative manner. However we do use Moving Averages, Moving Average Convergence Divergence ( MACD ), Simple Moving Average , Golden Ratio, Fibonacci Retracement , Relative Strength Index , and Gann Fan and Square as filters. Using these many filters is the reason why it took us over 2 years to prefect.
1 ~ Simple Moving Average
2 ~ Weighted Moving Average
3~ Convergent Divergent Alpha (Slow)
4~ Convergent Divergent Omega (Fast)
5 ~ Kelley’s Layout Proprietary Bearish Kill Zone
6 ~ Kelley’s Layout Proprietary Bullish Kill Zone
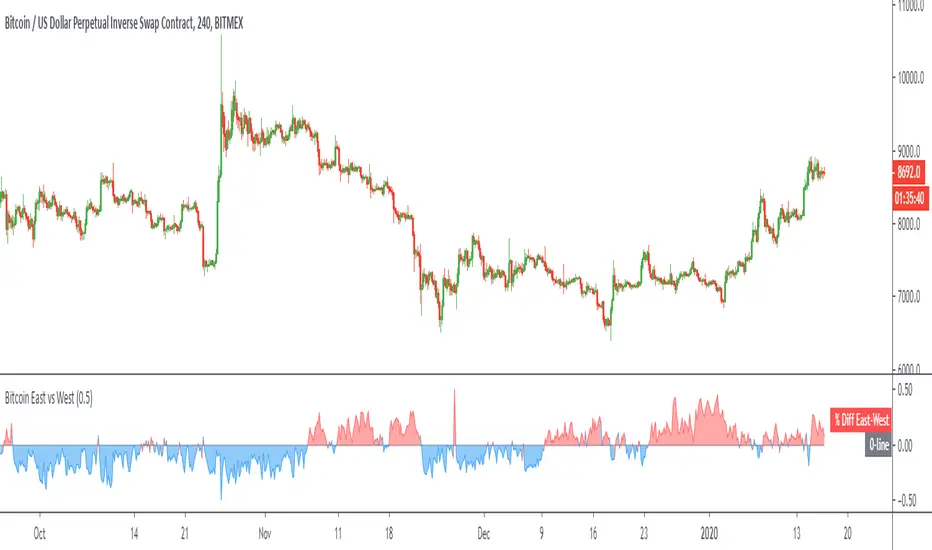
Bitcoin East vs WestPlots the volume weighted price difference between the top spot exchanges in the "East" (Asian markets) versus the "West" (US/UK/EU markets).
Optional: view the volume difference between the two.
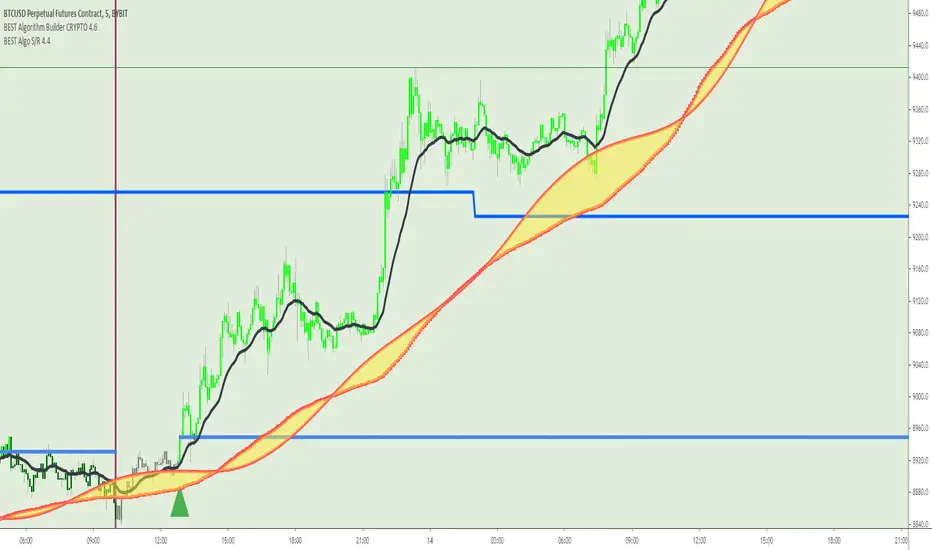
BEST Algorithm Builder CRYPTOHello traders 👋
I. 💎 SCRIPTS ACCESS AND TRIALS 💎
1. Every trial request access has to be done through my website.
2. My website URL is in this script signature at the very bottom (you'll have to scroll down a bit and going past the long description) and in my profile status available here: Daveatt
3. Many video tutorials explaining clearly how all our indicators work are available on your website > guides section and on our Discord forum.
4. You can also contact me directly for more information regarding the trading method included in the indicator or how to access it
II. Forewords
Algorithm trading has THE ambitious goal to reduce the number of decisions we have to make when trading.
It's so much easier to get a signal whenever all indicators are converging rather than monitoring each one individually.
Even better when that convergence has been found by experienced quant traders - so that our subscribers only worry about managing their trades according to our trading method.
We don't only provide scripts. They're based on our trading method we've built over years across many asset classes (including cryptocurrencies)
Feel free to check us out for more information (links in my profile or signature below)
This indicator is for the Intraday CRYPTO traders looking for fixed entries based on a trading method designed by 2 experienced traders.
It's a variation of our Algorithm Builder with a custom method for intraday trading - can be coupled with the UNIVERSAL Algo Builder also for swing positions.
We designed this framework for CRYPTO/USD and CRYPTO/CRYPTO pairing (ex: LTC/BTC, XRP/ETH, ...)
Made for crypto with enough trading volume (big and mid-caps)
ETH/BTC
XRP/ETH
EOS/USD
It includes :
- our proprietary method with fixed entries
- a hard exit system (built-in stop-loss)
- 🔔 Compatible with dynamic alerts 🔔
Dynamic alerts are bringing automated trading to a whole new level. The third-party solutions capturing TradingView alerts are able to use them.
- (optional) we let the users decide to use or not our built-in Trade Manager.
Regardless of the Trade Manager is used or not, one must mandatory exit, once a vertical hard exit bar appears.
- the Algorithmic Supports and Resistances used as safeguards and take profit zones.
Final words
We made it as simple as we could (to be honest it's a very simple system for the end-user) - even with several hundreds of calculations in the indicator.
Please hit me up for any questions/feedback/comments
Become the BEST trader that you deserve to be
Dave
Bitcoin Difficulty Ribbon - Best IndicatorHello everyone,
Today I programed the Bitcoin Difficulty Ribbon Indicator.
First of all, special thanks to:
Vinny Lingham
Willy woo
I just added a green background to clarify the buy signal.
Introducing the Difficulty Ribbon, signaling the best times to buy Bitcoin
Introducing the Bitcoin Difficulty Ribbon.
When the ribbon compresses, or flips negative, these are the best times to buy Bitcoin .
The ribbon consists of simple moving averages on mining difficulty so we can easily see the rate of change in difficulty.
How it the Difficulty Ribbon works
This visualisation of network mining difficulty speaks to the impact of mining on Bitcoin's price. As new coins are mined into existence, miners sell some of their mined coins to pay for production costs. This produces bearish price pressure.
The weakest miners sell more of their coins to remain operational. When it becomes unsustainable, they capitulate, hashing power and network difficulty reduces (ribbon compression), leaving only the strong, who sell less leaving more room for more bullish price action.
Typically we see this at the end of bear cycles, after miners capitulate, the lack of miner selling pressure allows the price to stabilise and then climb; the classic accumulation bottom.

Deadband cross detection for BTC (XBT)Description: meant to be used with BTCUSD (or XBTUSD ) on 3 mins to 1h candles charts.
Idea is to provide a tool to detect break-out's from a dead band around an EMA, and to detect back-in's to the dead band.
Detection is fundamentally based on how much %, at least, a certain candle body has ruptured the dead band (adjustable).
Long and short flags are placed on the chart, as well as the deadband. Can be used to generate alers.
With minimal modifications, can be convert to a Strategy script.
Following are ideas to play around if you want. Room for improvements:
- convert constants into inputs, and diversify thresholds assimetrically
- play around with wether or not using pyramiding (here pyramiding is blocked)
- look at several bars in a sequence, not only current

Bitcoin Halving CountdownHello traders,
I offer you today the BTC halving countdown updated in real-time on your charts
I inspired myself greatly from the gentleman @everget's script LTC halving countdown below
(
The countdown date is coming from that source www.bitcoinblockhalf.com.
The halving date is estimated to be around May 13th, 2020 .
That date is hardcoded in the script and is used for the countdown calculation.
The Bitcoin block mining reward halves every 210,000 blocks, the coin reward will decrease from 12.5 to 6.25 coins.
Enjoy the weekend
Dave

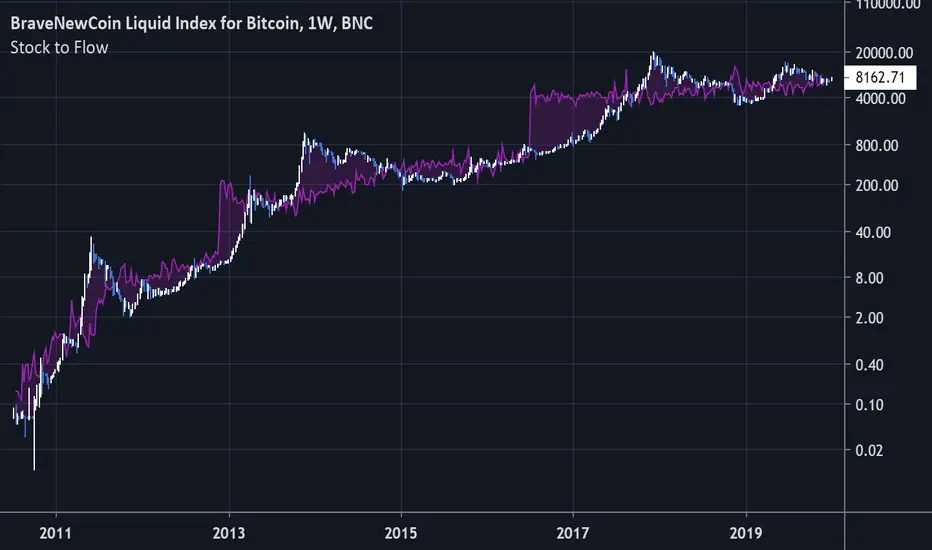
Bitcoin Stock to FlowModeling Bitcoin's Value With Scarcity
The Stock to Flow model for Bitcoin suggests that Bitcoin price is driven by scarcity over time.
Bitcoin is the first scarce digital object the world has ever seen. It is scarce like silver & gold, and can be sent over the internet, radio, satellite etc. Bitcoin includes a mathematical mechanism to restrict its supply over time making it more rare as time goes on. Digital Scarcity.
In 2017 BTC exceeded the market capitalization of Silver. After the next halving in 2024, Bitcoin will become the hardest asset the world has ever seen, rarer than Gold.
There is only enough Bitcoin in the world for each person to own .0023 BTC. Because of this, Bitcoin's value should continue to rise over time.
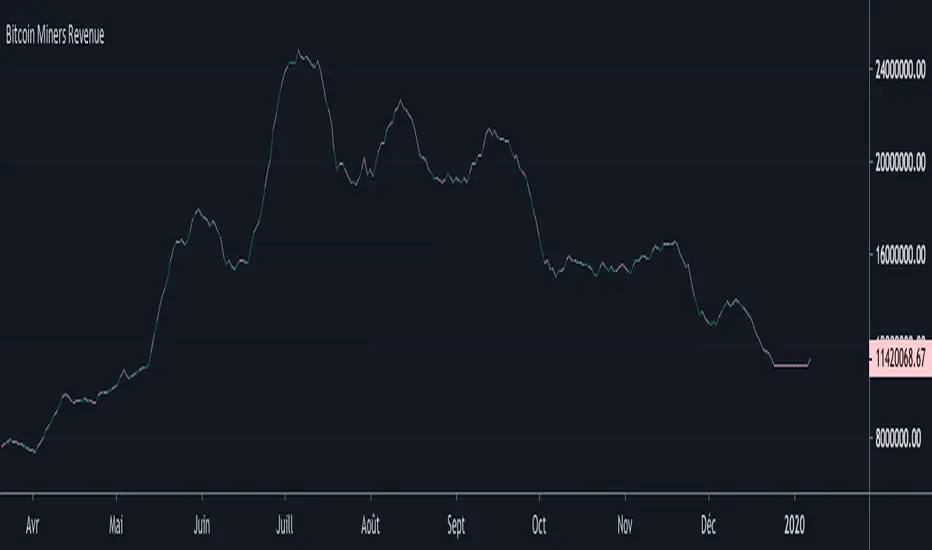
Bitcoin Miners RevenueHello everyone,
Bitcoin Miners Revenue Indicator :
Historical data showing (number of bitcoins mined per day + transaction fees) * market price.
Total value of coinbase block rewards and transaction fees paid to miner
Bitcoin Cost Per TransactionHello,
An indicator for Bitcoin, to have the cost per transaction, on a 10 days average.

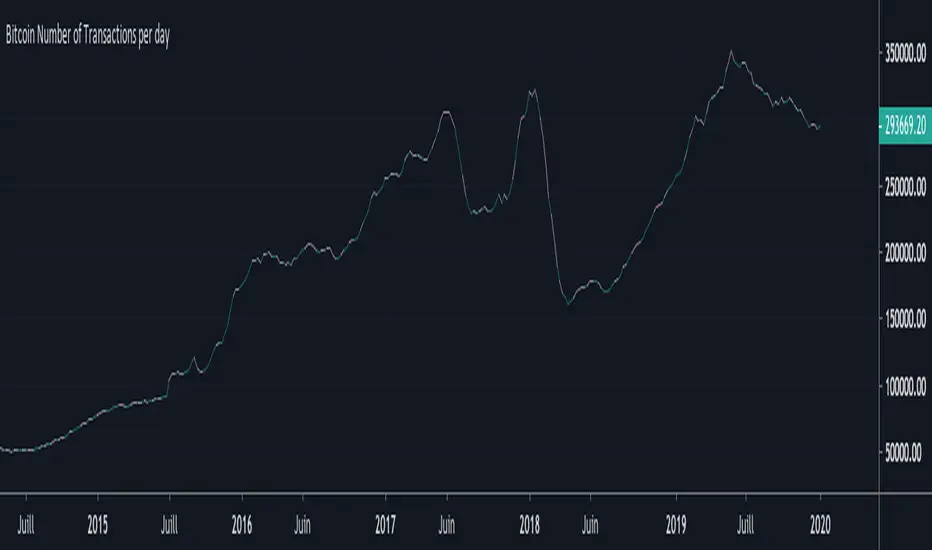
Bitcoin Number of Transactions per dayHello everyone,
Again an indicator for Bitcoin : the Number of Transactions / day.
Total number of unique bitcoin transactions per day
Precision : 10 DAYS AVERAGE
Bitcoin DifficultyHello everyone,
An other indicator for bitcoin : the difficulty
What is difficulty?
Difficulty is a measure of how difficult it is to find a hash below a given target.
The Bitcoin network has a global block difficulty. Valid blocks must have a hash below this target.
Mining pools also have a pool-specific share difficulty setting a lower limit for shares.

Bitcoin Hash RateHello everyone,
An interesting indicator for Bitcoin : the hash rate.
What is the Hash Rate ?
The estimated number of tera hashes per second (trillions of hashes per second) the Bitcoin network is performing.

BTC-Trend
BTC-Trend
BTC-Trend is a technique that shows how much BTC is dominating the market and it's effect over the whole Crypto Market.
*** Features
* Color grading to show you the Increase of domination effect (Green).
* Color grading to show you the Decrease of domination effect (Red) .
* Better understanding to the market ,and that will help you with a very good timed trades at the best trading times .
/////////////////////////////////////////////
*Note
Special thanks for Lazybear for his momentum algorithm .

GMA BTC1D-BYBIT-SignalA specialised Moving Average Cross Strategy script
This script allows you to set up your own alerts for automated trading. Make sure to only trigger alerts on candle close
After having spent hours on backtesting various settings for the classic MA cross strategy, I have identified a highly efficient combination for the slow and fast MA length.
This particular indicator is is tailored to trade Bitcoin 1D on Bybit and I've simplified it by removing the option to change MA lengths.
As a reminder, the MA cross strategy produces the following signals:
- BUY when the Fast MA is crossing above the Slow MA
- SELL when the Fast MA is crossing below the Slow MA

BTC Transaction/On-Chain Volume (Basic)Description:
Whale: Whale utilizing discounted prices (increasing on-chain volume & decreasing price)
Recovering: Positive momentum in price after potential whale activity
Cycle Volume Support: The transaction volume support during a cycle
What’s the best time to invest?
After institutions make up their mind at low price levels.
How’s on-chain volume related to whales or institutional money?
On-chain volume is contributed not only by using BTC as payment methods, but more importantly by large custodians using the BTC chain to settle internal whale trades. When OTC volume is estimated 2-3 times of exchange volume, and when total on-chain volume is only a small fraction of the exchange volume, the OTC settlement plays a big factor in moving the on-chain volume around.
Why does the price drop further after spotting whale money?
Does new money equal higher true value? Yes.
Does new money equal higher price? No.
Whales could not only ladder in when they see the price on discount, but also push the price further down to accumulate at better price levels. However, either route chosen, it’s most likely for the price to rise to a higher level compared to the level when the whales enter. Whales are here to make money after all.

Exponential Least Squares Moving AverageModified LSMA (Least Squares Moving Average) to use exponential rates of growth instead of linear regression. Inputting a number into the confidence interval allows the user to have set percentage of statistical guarantee based on past movement. To set this percentage of guarantee (Default set to 97.5%), refer to the input values below:
0.000 = 50%
0.255 = 60%
0.525 = 70%
0.835 = 80%
1.040 = 85%
1.285 = 90%
1.645 = 95%
1.960 = 97.5%
2.330 = 99%

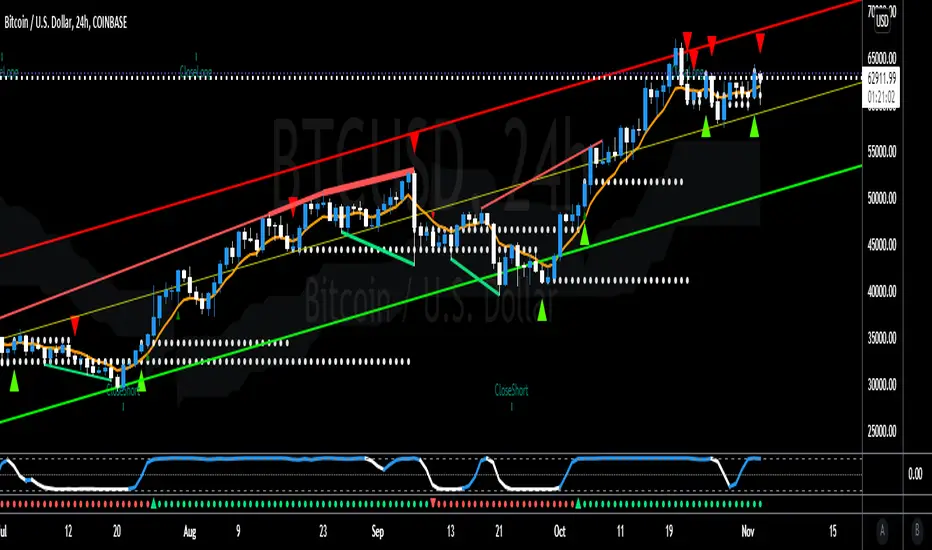
ANN BTC MTF CM Sling Shot SystemHi all, this script was created as a result of ANN training in all time frames of bitcoin data.
Trained data is built on Chris Moody's Sling Shot system.
CM Sling Shot System :
This system automatically generates the ANN output for all time periods.
Therefore, it has multi-time-frame feature.
Artificial Neural Networks training details:
Average Errors
1 minute = 0.005570
3 minutes = 0.006674
5 minutes = 0.007067
15 minutes = 0.010000
30 minutes = 0.009398
45 minutes = 0.010000
1 Hour = 0.006848
2 Hours = 0.006901
3 Hours = 0.009608
4 Hours = 0.009774
1 Day = 0.010000
1 Week = 0.010000
The results look good (All Average Error <= 0.01 ), the Sling Shot Method is also good, but you can also refer to historically slower period averages to filter these arrows a bit more. I leave the decision to you.
Best regards.

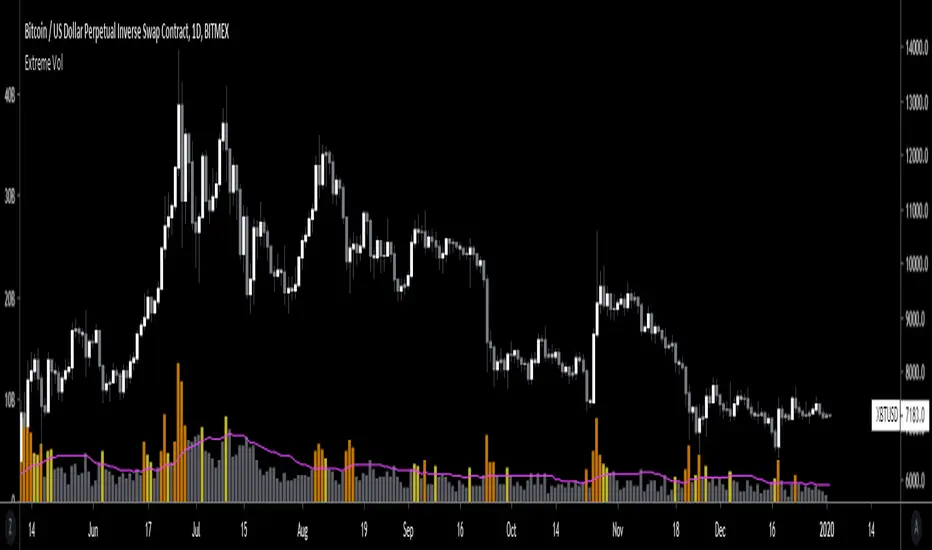
Extreme VolumeThis indicator colors volume bars that are significantly higher volume than the vol moving average ( SMA ). Utilizes two multiplier that can be adjusted by user. Defaults are that the indicator colors volume bars yellow if 20% higher than average, and orange if over 50% higher than average.
Reason why i created this indicator is i typically don't care about volume unless it is significantly higher than average. I find extreme volume useful for confirmation of a breakout, etc. This is why the rest of the volume bars are gray, they are still available for reference, but I dont pay much attention until volume is higher than average.
Also, when you load this indicator it will be in its own pane below the chart. To try and figure out how to add it to same pane as the chart was a huge pain in the ass. Once you figure it out it is pretty easy. I'll try to explain below...
Next to the indicator name you have the following options ... Hide, Settings, Show Source Code{}, Delete(X), and More (3 dots)
1) Click on "More" (3 dots)
2) Click on "Move To" then chose "Existing Pane Above"
3) Volume will likely be too large. Volume scale should be on left side, use your mouse to adjust volume smaller
4) Volume will likely be in the middle of your chart, click on it and drag it down.
Deribit Contango Calculator v3Same as XBT Contango Calc V3, however built specifically for Deribit Futures . See link to XBT Contango Calc V3 for full description.
Above is capture of how this indicator performed on December Futures Contract BTC27Z19, since I assume I will loose this as the main chart when I update to June contract
Current (Dec. 2019) futures contracts are as follows:
Blue = BTC26M20
Orange = BTC27H20

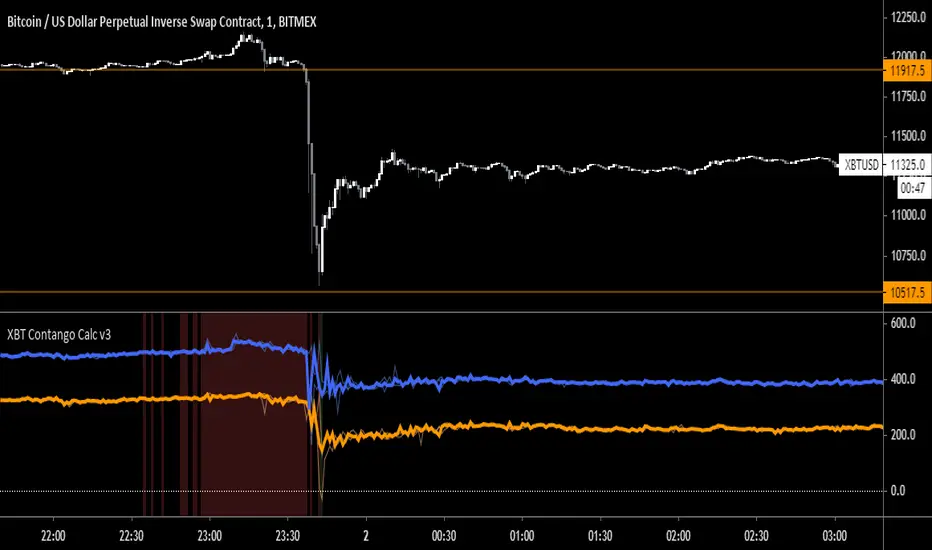
XBT Contango Calculator v3Since creating the first version of the XBT Contango Calculator, I found that the first version is good a calculating contango and backwardation in real time, however does not do a good job of capturing historical data of brief moves. Since backwardation moves are often brief, and since the first version Contango Calc was based on candlestick closes, it did not do a good job of recording the move after it occurred.
It took me a couple versions to try and fix this an eventually settled on version 3 which I have been using on my own for the last few months. You can see in the comparison chart above it does a much better job of capturing backwardation moves and extreme contango. Below is a comparison of how it performed vs. Version 1 during December futures XBTZ19
In addition I have added high/low lines that can be used to understand the amount that futures premium/discount has moved in a specific time frame. For example, the big drop Bitcoin had on September 24th, XBTZ19 went from +$273 contango to -$247 backwardation = $520 move! This move was in addition to the spot price move which was almost -$1,700 from high to low and -$1,100 from open to close. See below:
The high/low lines can also be removed from the chart by unchecking a box in the input tab.
The last update is the ability to lock the spot price to be XBT (index) no matter what chart you pull up. This can be useful if evaluation XBT futures correlation to other bitcoin derivatives such as GBTC or CME futures. You can also disable this feature in the input tab, which will then just calculate based on the current chart you are viewing.
Current Contracts (December 2019)
Blue = XBTM20
Orange = XBTH20