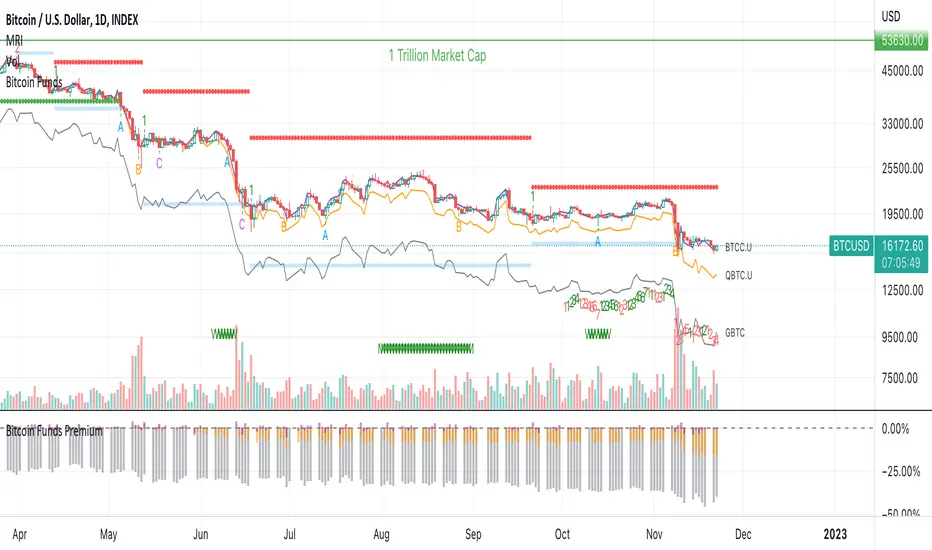
Bitcoin Funds PremiumDisplay the % premium of 4 different Bitcoin Funds relative to the price of Bitcoin in your current chart.
BTCC ETF
QBTC Fund
GBTC Trust
VBTC ETN
This indicator uses the metrics from the fund management websites to calculate the "Net Asset Value per Unit (NAVPU)" to calculate the true underlying value of the fund.
The difference is then compared to the price of Bitcoin in the chart you have open.
Note that the metrics change and therefore the graph is not accurate for long past timeframes.
If TradingView would expand their script language in a way to ingest CSV data from the funds website then this could be improved.
You can update the metrics for each fund in the settings dialogue.
The script will autodetect the currency pairs of your current graph and only display compatible funds:
BTC / USD will show BTCC.U, QBTC.U and GBTC
BTC / CAD will show BTCC and QBTC
BTC / EUR will show VBTC
The script should not show in other currency pairs so it will not mess up other charts you might switch to.
If you find bugs with this logic, please comment below so I can fix them.
Due to TradingViews "no-links in description" policy, you need to google each funds website yourself to find the current metrics. These search terms should help:
BTCC search "Purpose Bitcoin ETF"
QBTC search "3iq The Bitcoin Fund (QBTC)"
GBTC search "Grayscale® Bitcoin Trust"
VBTC search "VanEck Vectors Bitcoin ETN"
Btc!
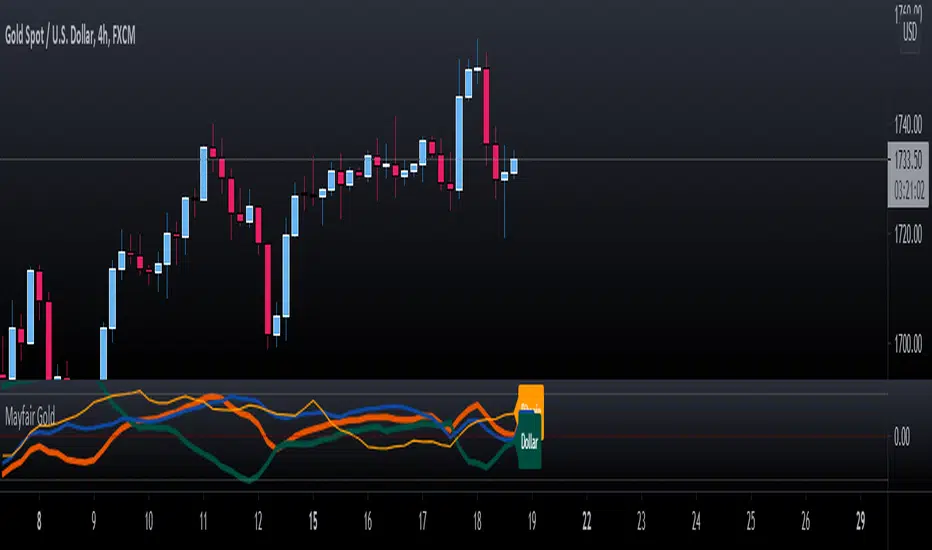
Mayfair GoldGold Oscillator using SPX & DXY to measure the moving average cross of the 3.
Gold in Orange
DXY in Green
SPX in Blue
To use this indicator, you need to see the strength (Orange above the 50%) line, use your own configurations and settings for the two MA's as a cross.
The idea is not to enter trades but to know when either SPX or/and DXY is getting stronger or weaker to help with profit-taking of gold positions.
As per any Oscillator - look for patterns, cross-overs and momentum shifts. (Treat like a MACD, RSI or Stochastic).
Price Extractor By CryptoScriptsThe Price Extractor is an indicator I've been working on for awhile that involves a Price Oscillator derived from various moving averages combined with Bollinger Bands and Overbought/Oversold levels. This indicator is unique because it not only measures the standard deviations whenever the oscillator crosses outside the BBs but it does so at ranges that are most advantageous for the trader to identify KEY buy/sell levels (as shown above). I'll break down each signal below and how to best take advantage of them so you can get the best entries and capture the most profit per trade.
*This indicator works best on the Binance or Bybit exchange for crypto but also works for stocks and forex. It's best used on small-medium timeframes such as the 15m, 1h, 4h, 8hr, or 12h. It tends to give more false signals on the 1D timeframes and higher.
Red Alarm - this signal indicates that the price oscillator is overbought AND is crossing outside of the bollinger bands. This is a STRONG sell signal but should still be combined with support/resistance levels and confirmed with other indicators.
Red Diamond - this signal indicates that the price oscillator is crossing outside of the bollinger bands above the 20 level but is not yet overbought. This is a potential sell signal but should still be combined with support/resistance levels and confirmed with other indicators.
Red Shaded Area - this indicates the price oscillator is overbought. This is a potential sell signal but should still be combined with support/resistance levels and confirmed with other indicators.
Rocket - this signal indicates that the price oscillator is oversold AND is crossing outside of the bollinger bands. This is a STRONG buy signal but should still be combined with support/resistance levels and confirmed with other indicators.
Green Diamond - this signal indicates that the price oscillator is crossing outside of the bollinger bands below the 20 level but is not yet oversold. This is a potential buy signal but should still be combined with support/resistance levels and confirmed with other indicators.
Green Shaded Area - this indicates the price oscillator is oversold. This is a potential buy signal but should still be combined with support/resistance levels and confirmed with other indicators.
Input Options
Show 80 Levels - This checkbox will create a red zone and green zone for the 60-80 levels on the indicator. This is useful if the price oscillator reaches one of these levels, you can be sure it's going to reverse soon and can have more confidence if it crosses outside of the BBs in addition to that.
PEO Length - This changes the height of the oscillator and will change how your signals flash (more or less often). Use this if you find you're getting too many signals or not enough. I find this is best at 21 but feel free to test out what works for you depending on your timeframe.
Moving Average Price Source - This is currently set to None but you can change it to Exponential, Hull, or Simple moving average. I found that None works best but feel free to test out the different options.
Moving Average Length - Changing this length will do nothing to your chart if None is selected for the Moving Average Price Source, therefore you will most likely keep this setting default at 9.
Alerts
I've set alerts on this indicator for each icon (Red Alarm, Red Diamond, Overbought, Rocket, Green Diamond, Oversold). I HIGHLY recommend setting the alerts for Candle Close so that you can be sure the signal is confirmed.
You may notice that the indicator can give multiple signals back-to-back or be overbought/oversold for multiple candles. When this happens, it's best to look at other indicators such as the RSI, MFI Pro, etc to nail the best entry and have confluence with your decision. With that said, having multiple signals back-to-back can also be an indication that the move is close to happening.
This indicator is a strong indicator by itself but works best when paired with my Volume Extractor indicator i.e taking a trade when both indicators are displaying overbought/oversold or crossing outside of the bollinger bands. Measuring price action is an extremely important aspect of trading and one I believe should not be overlooked. I hope I made everything as clear as possible and please let me know if I didn't.
PM me to obtain access and please let me know if you have any questions!

BTC Futures Premium IndexThe script collects data from various Futures and Spot prices and creates an index which identifies buy and sell zones . When combined with Open interest , this tool can be invaluable in making critical decisions .
Good Luck and I would request a like if you can spare that click :)
Thanks in advance and Happy Trading

ADX Momentum cross + MacD + HH LL + Buy/Sell Signals and alerts Hello, This is the first indicator I have made and would like to contribute to the community.
This strategy came from trying to replicate a previous ADX Cross Indicator that I loved on MT4 which I used successfully on EUR/USD on high and low time frames. Through the process of trying to replicate it I failed, I decided to take what I had written so far and create my own ADX cross strategy using the combination of 3 ADX's, their lag. Then also using Higher highs and lower lows with the MacD to further filter the signals.
There are two buy and two sell conditions , the difference between these are just the order in which the ADX crossing determines the entry. The MacD and higher highs and lower lows are the same for filtering the signal.
You can change the look back for HH and LL look back range, along with the DI Length & ADX Smoothing for all ADX's. The lag used for either the buy or sell strategy with the Lag_Buy/Lag_Sell inputs. Lag_mid setting will affect all 4 conditions.
From testing and based on the ADX cross logic you should follow this structure when changing the inputs for:
DI Length: Lowest DI value (I.E. 1)
DI Lengtha: Middle DI value (I.E. 2)
DI Lengthb: Highest DI value (I.E. 3)
ADX Smoothing: Lowest Smoothing value (I.E. 1)
ADX Smoothinga: Middle Smoothing value (I.E. 2)
ADX Smoothingb: Highest Smoothing value (I.E. 3)
I tested this on the EUR/USD, but mainly I have been using it on BTC/USDT(binance) and BTC/USDT Perpetual futures(binance) with the 5 minute chart. I suggest playing around with the settings depending on the Symbol and timeframe you use because the default settings are what I last found to be optimal for my self on the 5min BTC/USDT Perpetual futures(binance) chart.
A good starting point I found when using the indicator on other charts is to use the below values:
DI Length: 7
DI Lengtha: 14
DI Lengthb: 21
ADX Smoothing: 7
ADX Smoothinga: 14
ADX Smoothingb: 21
If you have any questions, suggestions, or requests for this indicator feel free contact me. You can either comment on here or Message me
If you like this indicator please like and comment where you found it useful.

BTC Multi Exchange Perpetual PremiumThis script tracks the premium/discount of Bitcoin perpetual contracts at various exchanges.
The premium/discount is calculated against an index price. The index price is calculated from spot exchange prices and are weighted as follows:
Bitstamp:28,81%
Bittrex:5,5%
Coinbase: 38,07%
Gemini: 7,34%
Kraken: 20,28
The difference between this script and other available scripts, is that exciting script seems to only focus on one exchange. This script is also open source.

MicroStrategy Software Business Share PriceSimilar to the MicroStrategy Premium script. This indicator derives MSTR's core software business value by calculating its Bitcoin holdings as a percentage of market cap. Thus you can do, (1 - Bitcoin holdings as a % of market cap) * current share price = Core business share price

(D7R) FTX Bitcoin FuturesFTX Contract Futures Price with 3 different value display modes. (Percentage, Delta, Absolute).
This information can be used to understand when futures are trading at relative strong premium or discount against each other.
This information can either be used for hedging or price speculation when difference between contracts offer that arbitrage.

(D7R) Deribit Bitcoin FuturesDeribit Contract Futures Price with 3 different value display modes. (Percentage, Delta, Absolute).
This information can be used to understand when futures are trading at relative strong premium or discount against each other.
This information can either be used for hedging or price speculation when difference between contracts offer that arbitrage.

MA200W buy sell BTC ColoredA script to help you plan your entrances and exits with beautiful colors for BTC. It just helps to better highlight the gap between the start of the week and the end.
It only work on Weekly.
Info :
Blue ... you can wait, enjoy your life
Green is when you buy
Yellow when you enter bull market
Orange is when you begin to take care of next week
Red when you begin to sell low part
White, if while a week you see white you can sell bigs bags, if it end with White you can close majors positions
Warning White may not appear, if second week after first Red week is not White you can sell large position
Good luck and take a breath

Arbitrage Sniper (POC)Good Morning Traders!
Today I want to share with you the proof-of-concept of how you would be able to do arbitrage with crypto pairs.
THE INDICATOR MUST BE PLACED ON THE TRADING PAIR OF THE TWO CURRENCIES (i.e. ETH/BTC, EOS/ETH etc.)
This arbitrage method is based on the transitional decorrelation between the crypto treding pair and the price ratio of the involved currencies, of course computing commissions as well.
Whenever the non-arbitrage condition is not respected, there is an arbitrage oportunity.
This indicator won't consider the chance of shorting, so if the arbitrage oportunity occurs the indicator will suggest you just the chance of buying the relative-undervalued currency (but inside the code you will know how to do the alternative method as well, by shorting the relative-overvalued currency)
Let's take the trading pair ETH/BTC (as in the graph) → if we assume commissions for the 0.075% of the order, the non-arbitrage condition will be presented like this
This arbitrage method will need three orders, so n=3
So let's assume that P(ETH)/(P(BTC)*P(ETH/BTC))>(1-0.075)^(-3) → it means that the price of Ethereum is currently overreated enough (relatively to the trading pair) for doing arbitrage.
We have two alternatives:
• Buy BTC, change it into ETH (by "buying" ETH in the trading pair ETH/BTC) and then sell ETH
• Sell ETH, buy BTC, change it into ETH (by "buying" ETH in the trading pair ETH/BTC)
On the other hand, if P(ETH)/(P(BTC)*P(ETH/BTC))<(1-0.075)^(-3) → it means that the price of Ethereum is currently underrared enough (relatively to the trading pair) for doing arbitrage.
We have two alternatives:
• Buy ETH, change it into BTC (by "selling" ETH in the trading pair ETH/BTC) and then sell BTC
• Sell BTC, buy ETH, change it into BTC (by "selling" ETH in the trading pair ETH/BTC)
I'm saying that is nothing more than a proof-of-concept since:
- Arbitrage Oportunities will emerge frequently just nearly zero commissions
- Data of prices are retrieved using security() function and there can be some delay (so the arbitrage oportunity will be already extinguished by the time the signal is retrieved)
- In order to have the freshest data, repiainting will occurr

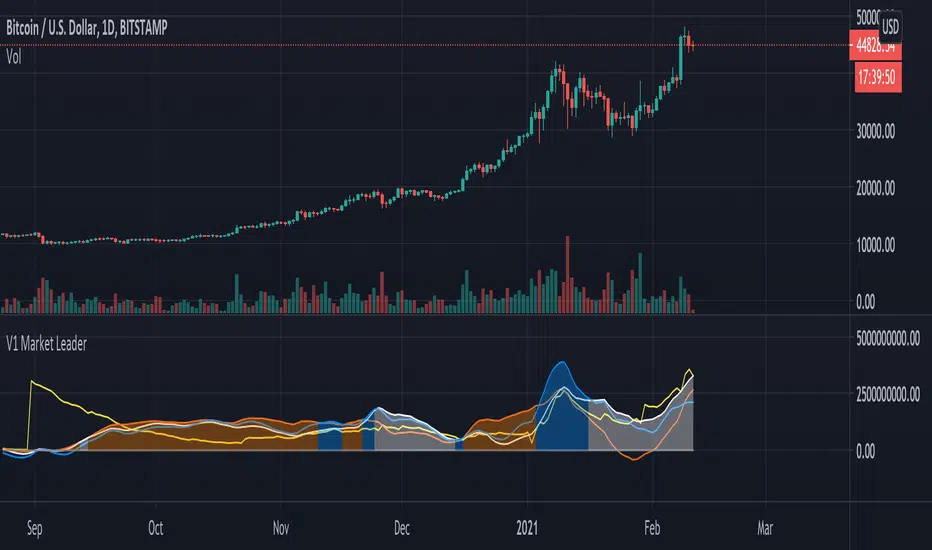
V1 Market Leader
This script aims to identify who the current market leader is between 3 participants, BTC , ETH and ALTS & ETH combined.
Colour coded so you can identify what is what in the settings - Default setting are: BTC = Orange, ETH = Blue and ALTS & ETH = White.
There is also a line to identify the market movement in relation to amount of Tether currently in circulation - Default setting is: Tether = Yellow.
This script can be used on any timeframe but I recommend 12H or greater.
Lines can be turned on and off in settings for cleaner look.
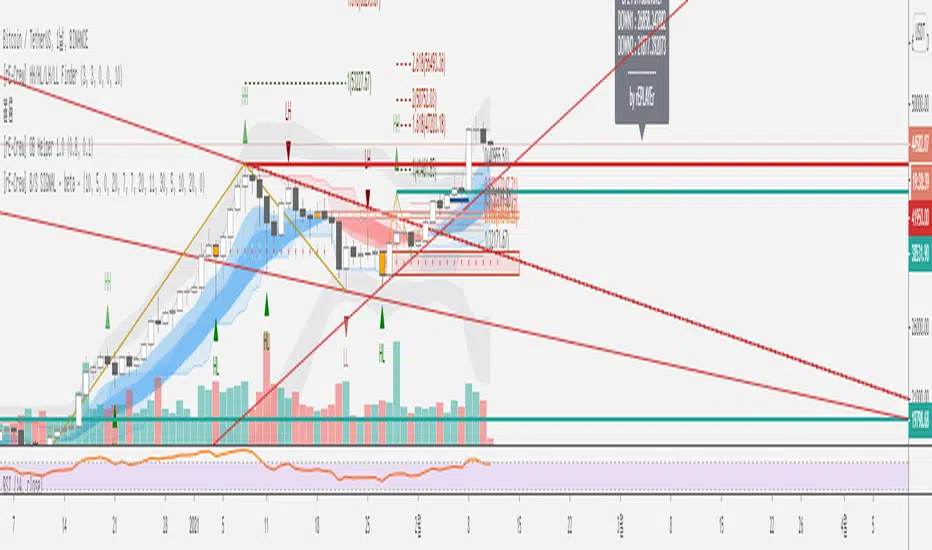
[rE-Crew] HH/HL/LH/LL Finder Open versionMy English is poor.
So I ask for your understanding.
You can find HH/HL/LH/LL using this indicator
HH : Higher High
HL : Higher Low
LH : Lower High
LL : Lower Low
This indicator is useful for Dow-Theory.
enjoy :)
이 지표는 HH/HL/LH/LL 을 찾아주는 지표입니다.
다우 이론에 유용하게 쓰여질 수 있습니다.
영어를 잘못하니 이해해주시면 감사하겠습니다 ^^;
DeLorean-V4 Long/ShortThis study aims to follow the trend of the asset, in longer times it is quite correct, but it can also be used in shorter time to be able to follow the trend of the asset.
Using the Bollinger Bands indicator, to get a better idea of volatility .
This indicator shows me the best trend in the cryptocurrency scenario, but it was very positive, also showing the trend in the "traditional" market.
Configured alerts for Long / Short.
Enjoy!
----------------PT-BR-----------
Este estudo visa acompanhar a tendência do ativo, em tempos maiores é bem assertivo, mas podendo também ser usado em menores tempo para poder acompanhar a tendência do ativo.
Usando o indicador Bollinger Bands , para ter uma ideia melhor da volatilidade.
Este indicador me mostra a tendência melhor no cenário de criptomoedas, mas foi bem assertivo também mostrando a tendência no mercado "tradicional".
Configurado alertas para Long/Short.
Enjoy!

PpSignal Ichimoku Kinko HyoWhat is the Ichimoku Kinko Hyo?
The Ichimoku Kinko Hyo, or Ichimoku for short, is a technical indicator that is used to gauge momentum along with future areas of support and resistance. The all-in-one technical indicator is comprised of five lines called the tenkan-sen, kijun-sen, senkou span A, senkou span B and chikou span.
Understanding Ichimoku Kinko Hyo
The Ichimoku Kinko Hyo indicator was originally developed by a Japanese newspaper writer to combine various technical strategies into a single indicator that could be easily implemented and interpreted. In Japanese, "ichimoku" translates to "one look," meaning traders only have to take one look at the chart to determine momentum, support, and resistance.
Ichimoku may look very complicated to novice traders that haven't seen it before, but the complexity quickly disappears with an understanding of what the various lines mean and why they are used.
The Ichimoku indicator is best used in conjunction with other forms of technical analysis despite its goal of being an all-in-one indicator.
Ichimoku Kinko Hyo Interpretation
There are five key components to the Ichimoku indicator:
Tenkan-sen: The tenkan-sen, or conversion line, is calculated by adding the highest high and the highest low over the past nine periods and then dividing the result by two. The resulting line represents a key support and resistance level, as well as a signal line for reversals.
Kijun-sen: The kijun-sen, or base line, is calculated by adding the highest high and the lowest low over the past 26 periods and dividing the result by two. The resulting line represents a key support and resistance level, a confirmation of a trend change, and can be used as a trailing stop-loss point.
Senkou Span A: The senkou span A, or leading span A, is calculated by adding the tenkan-sen and the kijun-sen, dividing the result by two, and then plotting the result 26 periods ahead. The resulting line forms one edge of the kumo - or cloud - that's used to identify future areas of support and resistance.
Senkou Span B: The senkou span B, or leading span B, is calculated by adding the highest high and the lowest low over the past 52 periods, dividing it by two, and then plotting the result 26 periods ahead. The resulting line forms the other edge of the kumo that's used to identify future areas of support and resistance.
Chikou Span: The chikou span, or lagging span, is the current period's closing price plotted 26 days back on the chart. This line is used to show possible areas of support and resistance.
Example of an Ichimoku Kinko Hyo Chart
The following is an example of an Ichimoku indicator plotted on a chart:
Indicator component
Alarm
Have alarm when price and Chicouspan cross Kumo cloud.
Have Alarm when tekn Sen 9 cross Kijusen 26.
Have Hiken ashi buy and sell alarm
Other tools
Mtf cloud.
X Exchange BTC Cash Flow Index (Multi-Exchange)Custom Cash flow Index (Similar to MFI) indicator based on BTC World Volume across all exchanges.
Volume Data based on "BTC WORLD VOLUME" by Phil Ledru
How it works:
Use this indicator like to see momentum changes in Price and Volume across all exchanges for Bitcoin.
When momentum is positive, indicator will turn Blue.
When momentum is slowing down and price is declining, indicator will turn Red.
Like your usual RSI, OB & OS levels are 80 & 20.
What to watch out for:
- Watch out for Bullish and bearish divergences in Volume
- Wedges, Head and shoulders and other formations.
Enjoy!

Statistical and Financial MetricsGood morning traders!
This time I want to share with you a little script that, thanks to the use of arrays, allows you to have interesting statistical and financial insights taken from the symbol on chart and compared to those of another symbol you desire (in this case the metrics taken from the perpetual future ETHUSDT are compared to those taken from the perpetual future BTCUSDT, used as a proxy for the direction of cryptocurrency market)
By enabling "prevent repainting", the data retrieved from the compared symbol won't be on real time but they will static since they will belong to the previous closed candle
Here are the metrics you can have by storing data from a variable period of candles (by default 51):
✓ Variance (of the symbol on chart in GREEN; of the compared symbol in WHITE)
✓ Standard Deviation (of the symbol on chart in OLIVE; of the compared symbol in SILVER)
✓ Yelds (of the symbol on chart in LIME; of the compared symbol in GRAY) → yelds are referred to the previous close, so they would be calculated as the the difference between the current close and the previous one all divided by the previous close
✓ Covariance of the two datasets (in BLUE)
✓ Correlation coefficient of the two datasets (in AQUA)
✓ β (in RED) → this insight is calculated in three alternative ways for educational purpose (don't worry, the output would be the same).
WHAT IS BETA (β)?
The BETA of an asset can be interpretated as the representation (in relative terms) of the systematic risk of an asset: in other terms, it allows you to understand how big is the risk (not eliminable with portfolio diversification) of an asset based on the volatilty of its yelds.
We say that this representation is made in relative terms since it is expressed according to the market portfolio: this portfolio is hypothetically the portfolio which maximizes the diversification effects in order to kill all the specific risk of that portfolio; in this way the standard deviation calculated from the yelds of this portfolio will represent just the not-eliminable risk (the systematic risk), without including the eliminable risk (the specific risk).
The BETA of an asset is calculated as the volatilty of this asset around the volatilty of the market portfolio: being more precise, it is the covariance between the yelds of the current asset and those of the market portfolio all divided by the variance of the yelds of market portfolio.
Covariance is calculated as the product between correlation coefficient, standard deviation of the first dataset and standard deviation of the second asset.
So, as the correlation coefficient and the standard deviation of the yelds of our asset increase (it means that the yelds of our asset are very similiar to those of th market portfolio in terms of sign and intensity and that the volatility of these yelds is quite high), the value of BETA increases as well
According to the Capital Asset Pricing Model (CAPM) promoted by William Sharpe (the guy of the "Sharpe Ratio") and Harry Markowitz, in efficient markets the yeld of an asset can be calculated as the sum between the risk-free interest rate and the risk premium. The risk premium of the specific asset would be the risk premium of the market portfolio multiplied with the value of beta. It is simple: if the volatility of the yelds of an asset around the yelds of market protfolio are particularly high, investors would ask for a higher risk premium that would be translated in a higher yeld.
In this way the expected yeld of an asset would be calculated from the linear expression of the "Security Market Line": r_i = r_f + β*(r_m-r_f)
where:
r_i = expected yeld of the asset
r_f = risk free interest rate
β = beta
r_m = yeld of market portfolio
I know that considering Bitcoin as a proxy of the market portfolio involved in the calculation of Beta would be an inaccuracy since it doesn't have the property of maximum diversification (since it is a single asset), but there's no doubt that it's tying the prices of altcoins (upward and downward) thanks to the relevance of its dominance in the capitalization of cryptocurrency market. So, in the lack of a good index of cryptocurrencies (as the FTSE MIB for the italian stock market), and as long the dominance of Bitcoin will persist with this intensity, we can use Bitcoin as a proxy of the market portfolio

Mayfair Crypto Strength IndexWorking on the basis of a currency strength index - expresses the index value of a currency. For economists, it is often calculated as purchasing power. while for financial traders, it can be described as an indicator, reflecting many factors related to the currency; for example, fundamental data, overall economic performance or in Crypto terms the strength of the company/asset itself.
In the base version;
BTC is the thicker Orange level.
ETH - the Green
XRP - Blue
The concept then is similar to a stochastic indicator or RSI - 20% oversold regio & 80% overbought. The zero line can be used as Bullush or Bearish.
We wanted to create something that shows the correlation between the top cryptocurrencies as we are often asked about breaking down one or the other.
This is not a buy me now or sell me then indicator - just there to assist and compare assets easily.
Please feel free to like and follow.
Disclaimer
This idea does not constitute as financial advice. It is for educational purposes only, our principle trader has over 20 years’ experience in stocks, ETF’s, and Forex. Hence each trade setup might have different hold times, entry or exit conditions, and will vary from the post/idea shared here. You can use the information from this post to make your own trading plan for the instrument discussed. Trading carries a risk; a high percentage of retail traders lose money. Please keep this in mind when entering any trade. Stay safe.

Betelgeuse-Good entry/exit zoneHello everyone and welcome!
This is the my first indicator and also the first version of Betelgeuse script,I hope you will like it.
The indicator was designed to be used on cryptocurrencies
The idea is to be able to identify good entry and exit points in the market, traders often try to identify the minimum or maximum points and this is why Betelgeuse was born.
Betelgeuse should be combined with your analysis and other indicators to find good entry and exit zones and not a precise point.Obviously the more the indicator will be used
over long time frames the more accurate the signals will be.
You can decide to wait for a good signal from the RSI or from the MACD and add up
the Betelegeuse confirmation for a good entry or exit from the market.
The MA based indicator will give you an idea of the direction of the medium term trend.
Direct message me for acces.
Bitcoin Bulls and Bears by @dbtrBitcoin 🔥 Bulls & Bears 🔥
v1.0
This free-of-charge BTC market analysis indicator helps you better understand what's going with Bitcoin from a high-level perspective. At a glance, it will give you an immediate understanding of Bitcoin’s historic price channel dating back to 2011, past and current market cycles, as well as current key support levels.
Usage
Use this indicator with any BTCUSD pairs , ideally with a long price history (such as BNC:BLX )
We recommend to use this indicator in log mode, combined with Weekly or Monthly timeframe.
Features
🕵🏻♂️ Historic price channel curve since 2011
🚨 Bull & bear market cycles (dynamic)
🔥 All-time highs (dynamic)
🌟 Weekly support (dynamic, based on 20 SMA )
💪 Long-term support (channel bottom)
🔝 Potential future price targets (dynamic)
❎ Overbought RSI coloring
📏 Log/non-log support
🌚 Dark mode support
Remarks
With exception of the price channel curve, anything in this indicator is calculated dynamically , including bull/bear market cycles (based on a tweaked 20SMA), ATHs, and so on. As a result, historic market cycles may not be 100% accurately reflected and may also differ slightly in between various time-frames (closest result: Monthly). The indicator may even consider periods of heavy ups/downs as their own market cycles, even though they weren’t. Due to its dynamic nature, this indicator can however adapt to the future and helps you quickly identify potential changes in market structure, even if the indicator is no longer updated.
On top of that bullmarket cycles (colored in green) feature an ingrained RSI: the darker the green color, the more the RSI is overbought and close to a correction (darkest color in the chart = 90 Weekly RSI). In comparison with past bull cycles, it helps you easily spot potential reversal zones.
Thanks
Thanks to @quantadelic and @mabonyi which both have worked on the BTC "growth zones" indicator including the price channel, of which I have used parts of the code as well as the actual price channel data.
Follow me
Follow me here on TradingView to be notified as soon as new free and premium indicators and trading strategies are published. Inquire me for any other requests.
Enjoy & happy trading!

OH2B Trading Indicator Ver2.0OH2B TRADING INDICATOR
The OH2B Trading Indicator is an indicator built for beginners.
It gives you entry points for BUY and SELL based on Trend Channel and Ema-Crossover.
It also gives you EXIT POINTS for taking profits based on the Average Directional Index and Relative Strength Index.
TRADING WITH OH2B INDICATOR
The OH2B Trading Indicator gives you entry points for BUY or SELL .
When the ema1 crosses above ema2, the trend channel will be painted GREEN in color, and a BUY signal will appear. = BUY
When the ema1 crosses below ema2, the trend channel will be painted RED in color, and a SELL signal will appear. = SELL
When a BUY or SELL signal appears on the chart, don't rush into any trade.
Please allow a few hours for confirmation of signals .
After confirmation, it is suggested to enter 50% first and another 50% near the Trendlines .
After entering a trade, please remember to set a stop-loss alert of an opposite signal.
To TAKE PROFIT , please follow the Triangles indicated on the chart
RED Triangles are the Take-Profit targets for the BUY (long) signal
GREEN Triangles are the Take-Profit targets for the SELL (short) signal
*After taking profit, please set a Stoploss to at least break-even level to protect your profits.
Often the price goes to the Trendlines after the signal, so keep some funds to increase the position or even open all position near the Trendlines , or use it for re-enter with SL after you closed position on TPs.
Setting alerts for Trade
Remember to set an alert so that you won't miss any opportunity.
TradingView will notify you immediately when a new signal pops up on the chart.
Tips for the beginners:
Recommended using the indicator at 1H - 2H Timeframe .
Recommended using the indicator for Spot Trading at both Crypto and Stock Market.
Do not use leverage above 5x.
No more than 5% of the deposit in one trade.
Do not rush into any trade when a new signal pops up, please allow a few hours for confirmation of signals.

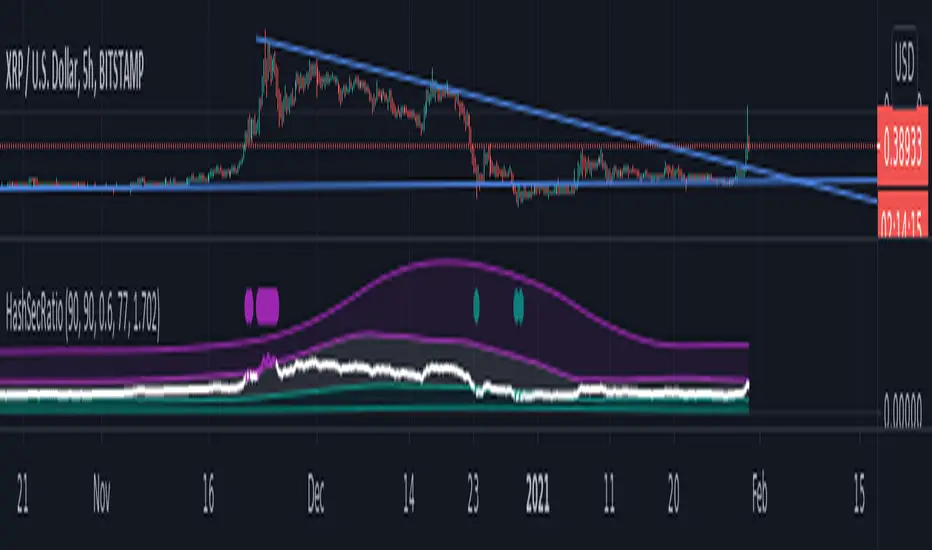
Hashrate to Securities RatioTMcV
HashSecRatio Original
January,30,2021
The Hashrate to securities ratio is a study to get a view on data flowing through the blockchain and can be applied to any asset available in Tradingview.
This indicator illustrates asset performance vs the moving average of BTC hash rate and accurately highlights price trend tops and bottoms allowing for excellent entry points in long and short trades highlighting overbought and oversold conditions in custom timeframes.
I will allow protected access for a short period of time to gather public opinion after that access will be limited to paid only.
For now if you would like to use this script please leave a comment and add to your favorite scripts.