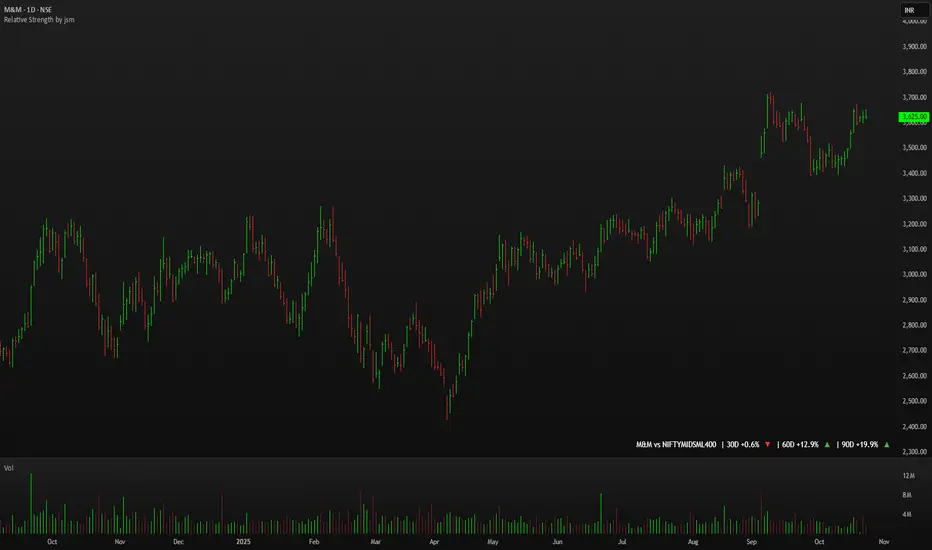
Relative Strength by jsm
1) Compare any stock against an Indian sector/index quickly and clearly.
2) Quickly gauge if your stock is outperforming or lagging its sector.
3) Instant relative strength tracker for Indian stocks & indices.
4) See 30D / 60D / 90D returns vs NIFTY, BANKNIFTY & more.
5) Smart visual tool to spot sector outperformance at a glance.
What it shows
A compact one-line readout (top-right by default):
TICKER vs INDEX | 30D +x.x% ▲ | 60D +y.y% ▼ | 90D +z.z% ▲
- +x.x% → stock return over the past 30 trading days (always uses daily bars).
- Arrow indicates relative performance vs the selected index: green ▲ = stock outperformed, red ▼ = stock underperformed, - = neutral (within tolerance).
- Percent values are shown with one decimal and a leading + for positives (e.g. +3.4%, -1.2%).
How it works
Apply the indicator to the stock chart (bottom chart in a dual-chart layout).
Choose the sector/index to compare from the “Compare with any Indian Index / Sector” dropdown. The indicator immediately calculates:
- Stock % change over 30 / 60 / 90 daily bars
- Index % change over the same periods
- Displays an arrow that reflects stock% − index% (colored only on the arrow to keep the numbers readable).
Inputs
- Pick Sector : preset list of Indian indices/sectors (no free-text by default).
- Box placement : Top/Bottom × Left/Right.
- Box Size : Tiny / Small / Normal / Large / Huge (controls font size).
- Dark Mode : toggles text color for dark/light charts.
- Show 30D / Show 60D / Show 90D : enable/disable individual periods.
- Equality tolerance (%) : small tolerance window to treat values as “equal” (shows neutral symbol).
Behavior & design choices
- Uses daily series for lookbacks (so 30D/60D/90D = 30/60/90 trading days) — works correctly on intraday charts too.
- Arrow only is colored (green/red/gray) for quick visual scanning; numbers remain neutral for readability.
- No intrusive background box by default — flat overlay that blends with your chart.
- Defaults: Bottom-right placement, Normal size, Light mode = off (so dark charts show white text).
Limitations / notes
- Not financial advice — use as a quick comparative visual, not a trade signal.
- The indicator calculates using the preset index symbols; if your broker/data feed lacks a symbol, the cell shows n/a.
- Due to TradingView table rendering, a tiny pixel gap may appear between a percent and its colored arrow (kept minimal on purpose).
Example
On SMSPHARMA chart with NSE:NIFTY selected:
SMSPHARMA vs NIFTY | 30D +13.0% ▲ | 60D +18.5% ▲ | 90D +13.5% ▲
— stock has outperformed NIFTY in all periods.
BSE
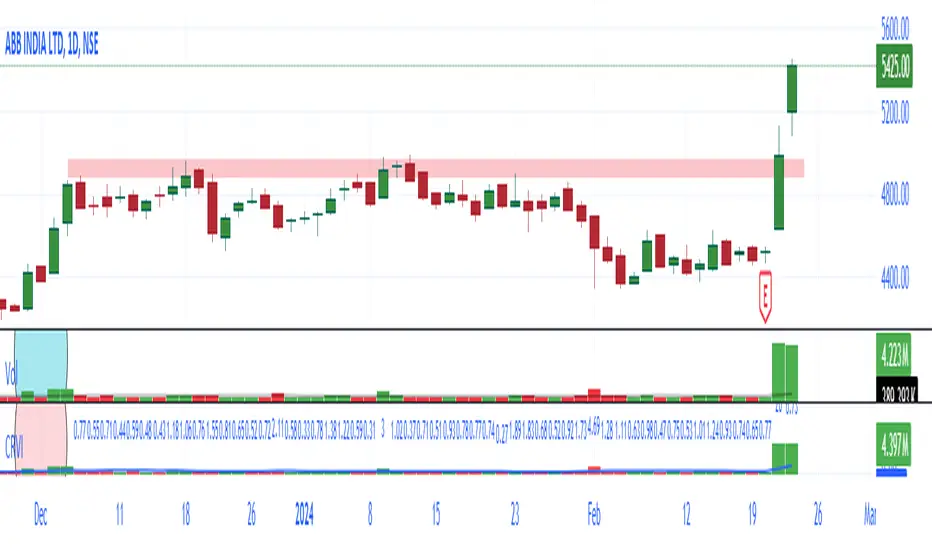
NSE + BSE Volume with Relative Volume Multiplier By AfnanIntroducing the Combined NSE + BSE Volume Indicator with Relative Volume indicator (CRVI).
The Combined NSE + BSE Volume Indicator with Relative Volume Multiplier (CRVI) is an essential tool for Indian traders who are engaged in volume breakout analysis, particularly breakout traders.
Key Features of CRVI:
Combining NSE and BSE Volume: The CRVI consolidates volume data from both the National Stock Exchange (NSE) and the Bombay Stock Exchange (BSE) into a single chart, ensuring that traders do not miss out on vital volume data from either exchange.
Understanding Operator Activity: This indicator gives traders the advantage of identifying whether operators or smart investors are building positions in either exchange. For instance, while observing an NSE stock chart, traders can now identify if operators are building positions in BSE stocks as well.
Add-on to Relative Volume / Volume Breakout Multiplier (RVI) Indicator: The CRVI is an additional feature integrated into the Relative Volume / Volume Breakout Multiplier (RVI) indicator, providing an enhanced perspective on volume dynamics.
Usage of CRVI:
Quantifying Volume Breakouts: The indicator quantifies the degree of volume breakouts concerning the Simple Moving Average (SMA), facilitating a clearer understanding of the strength of volume breakouts.
Relative Volume Interpretation: By comparing the current volume with the volume SMA, the CRVI delivers a breakout number, such as 2.0 for double the volume SMA or 0.50 for half the volume SMA. This assists traders in gauging the momentum and potential trading opportunities more effectively.
Advantages for Traders:
Enhanced Volume Analysis: Breakout traders, in particular, will find the CRVI invaluable for identifying potential trading opportunities and assessing volume strength more accurately.
Essential Toolkit Inclusion: Traders focusing on volume breakout analysis can benefit significantly from incorporating this indicator into their trading toolkit.
Embracing Continuous Improvement:
Every tool and analysis utilized contributes to the ongoing process of becoming more adept traders. Embracing continuous learning and improvement is the foundation of successful trading. As we move forward, armed with the right tools and mindset, we eliminate the doubts of today and pave the way for a more confident tomorrow.
Gratitude :
Your support, likes, and comments are deeply appreciated. If you have any questions, do not hesitate to reach out. Let's work together to make trading an enriching experience!
Indian Market Sessions for BacktestingThis indicator is designed to increase the quality of your backtesting in the Indian Market.
NSE & BSE run from 9:15 am IST to 3:30 pm IST.
Naturally different times have different kinds of volatility.
On your chart you will find premarked -
Saffron - 9:15 am to 10:30 am - Opening Session - High Volatility Observed Historically
White - 10:35 am to 2:25 pm - Middle Session - Lower Volatility Observed Historically
Green - 2:30 pm to 3:30 pm - Closing Session - Medium to High Volatility Observed Historically
You will also find the start of each session marked with an arrow.
Feel free to change the times from the input settings and the color and visibility from the style settings.
_______________
Usage:
When you backtest any strategies, say moving average crossovers, also mark the sessions in your sheet which will help you further increase accuracy.
Feel free to drop your doubts in the comments.

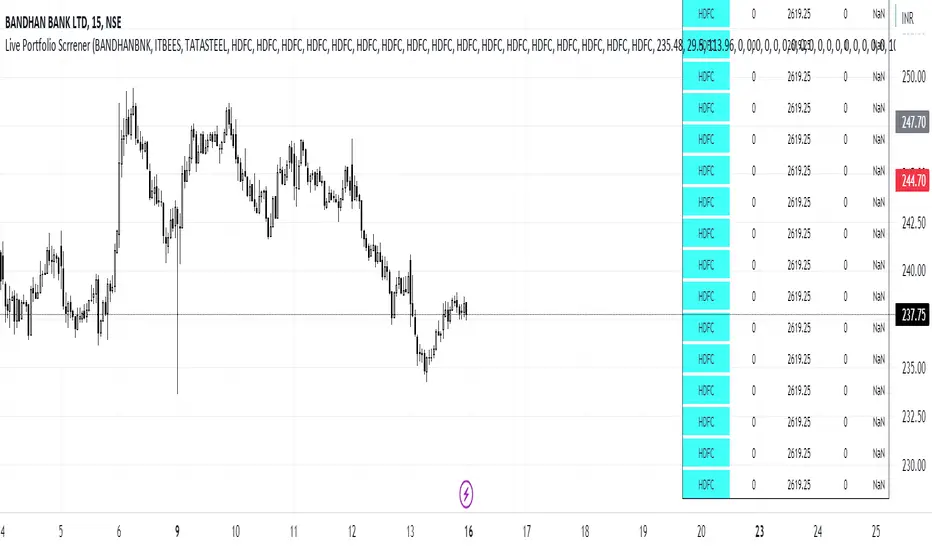
Live Portfolio ScreenerThe live portfolio screener indicator is a tool that help users to track the performance of their investments in real-time. The indicator provides a detailed breakdown of the user's portfolio, including the current profit and loss (P&L) for each stock that is invested in. This allows users to quickly and easily see how their portfolio is performing and make informed decisions about their investments on charts. Overall, this tool is an essential tool for anyone looking to stay on top of their investments and make data-driven decisions.
This indicator can load any symbol globally usable.
How to use this indicator ?
in this indicator firstly
you have add script name. (For example if you want to add symbol you have add in 's01 ' means the first symbol)
after that
you have to add price for each (For example if you want to add buy price for the first symbol then add the buy price in ' Bp01 ')
then the quantity comes in picture which is below price list and named here as Bq01 which means 'Buy quantity for first symbol'
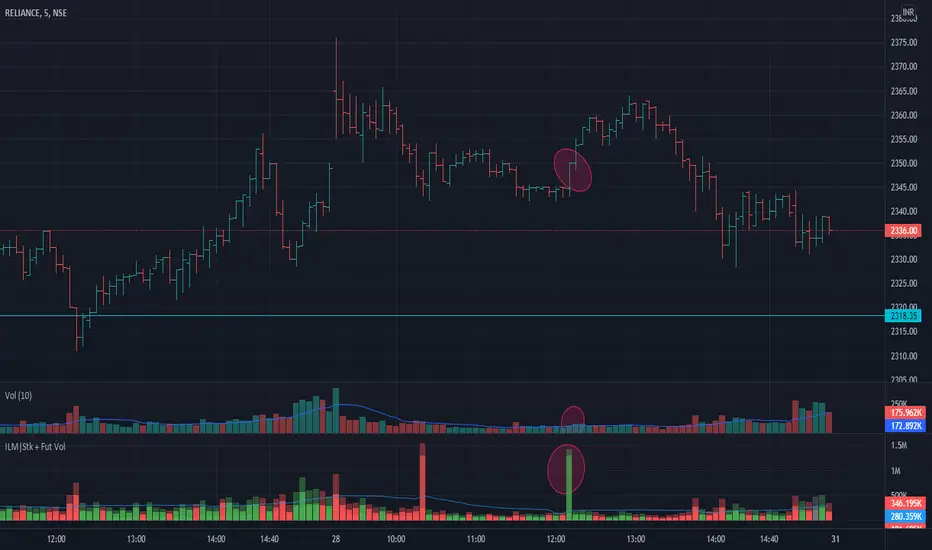
Volume Indicator NSE + BSE + Future Current & Next MonthThis indicator combines all the volumes from both the NSE & BSE exchanges as well as Future volumes ( Current Month & Next Month) if the symbol is available in FnO
Indicator shows 3 volumes
Total Volume = NSE + BSE + Current Month + Next Month
Stock Volume = NSE + BSE
Future volume = Current Month + Next Month
Benefits
As shown in the chart above, price shot up as the volume appeared in BSE but not NSE. These conditions can be caught easily and right decisions can be made
Since Future volumes are also combined, it gives an accurate picture of volumes on any given instrument during last of week of monthly expiries when contract rollovers happen
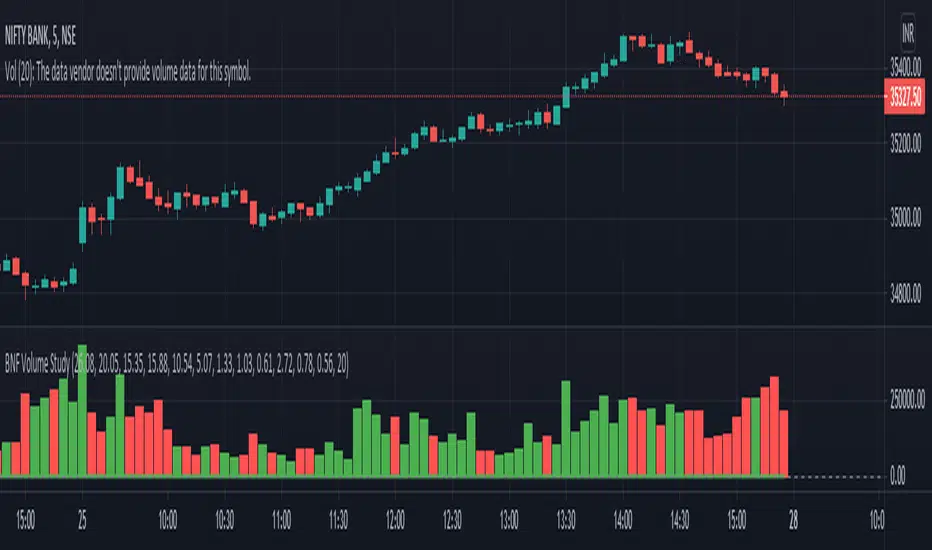
Trade Vertex - Bank Nifty Volume IndicatorNSE:BANKNIFTY
We all know that the value of an Bank Nifty is derived from top banking sector underlying stocks.
The value of Bank Nifty is calculated from free float market capitalization.
Using the same formula, I made an indicator on the bases of weighted volume of each stock.
This indicator will help you to plot Volume on Bank Nifty.
IPB_AOPM_BOThis is an intraday trading strategy.
Concept :
Underlying concept is that Amateurs open the market and Professionals close the market. Hence this system tries to capture the breakout in the afternoon session. After One PM Breakout (AOPM breakout). This essentially means that one has to go long once the high of the market till 1 pm is broken out and similarly go short once the low of the market till 1 pm is broken down.
Position sizing:
This strategy assumes taking 10 lots of Indian Market Index which approximately requires a margin of around INR 25,00,000. Hence capital is chosen as INR 25,00,000. Currency is assumed to be INR , however the system shows USD as currency as there is no INR option available. Commissions assumed to be at INR 50 per order as against the INR 20 per charged by retail brokers in India in real world market.
Disclaimer:
Past performance is not representative of future performance. Hence the author is not responsible for any trading loss arising out of implementing this strategy. Hence please implement at your own risk. Trading can result in loss of entire capital.

Aditya Signal-1.1 for Nifty and Bank NiftyThis is non-repainting indicator which can be used for Index, Stocks, Commodities and Bitcoin or any other securities depending upon the various parameter setting of the indicator. This particular strategy is for Nifty-50 Index which is traded on NSE(India).
The detailed description about the indicator is as follows:
Long Period: Period for calculating Primary Signal Line (Yellow).
Long Period Input Source: Input for calculating Primary Signal Line.
Short Period: Period for smoothing the Primary Signal Line.
Short Period MA: Method for smoothing the Primary Signal Line.
No. of ATR Bars: No. of ATR bars for calculating Primary Signal Line.
ATR Multiplier: ATR multiplier for ATR calculation.
Trade Trigger: Value above or below of Primary Signal Line for Long or Short signal. The dotted lines in Green and Red color represents the same.
Bar Crossover Input Source: Current bar input for additional signal confirmation above Primary Signal Line.
Bars Above Signal High: No. of bars closing above Secondary Signal Line (Blue)
Bars Below Signal Low: No. of bars closing above Secondary Signal Line (Purple)
No. of bars crossover method uses certain no. of bars for closing above High or Low of the crossover of closing price and the Primary Signal Line in combination with Trade Trigger. The idea behind this design is to avoid fake signal due sudden spike in price. Also, this ensures that price consolidates above High in case of Long signal confirmation and vice-versa. By increasing no. of such bars, we can anticipate, how much time it takes for short-term and long-term trend reversal.
Depending upon the time-frame, just by observing the High and Low of previous crossover of closing price and Primary Signal Line, we will have better understanding of undercurrent of market.
By using different combination of Trade Tigger value and no. of bars above and below, we can anticipate better trend confirmation.
The various combinations of price source of Long Period Input Source and Bar Crossover Input Source, the Short Period MA method shows promising results. Kindly PM me for these optimum settings for other financial instruments.
It always better to book partial profit after getting into the trade which increases the odds. The default trade quantity is 2. We book 1 quantity after our partial profit target is reached and let the remaining quantity be in the trade until the reversal of trend. By enabling or disabling the same we can determine the profit or loss from historical trade from when the trade quantity is 1. Just remember to change the default quantity to 1 in Order Size from properties when you disable the Take Partial Profit option.
Take Partial Profit: Whether to book partial or not as explained above.
Partial Profit Points: It always better to book partial profit after trend getting into the trade. The default trade quantity is 2. We book 1 quantity after our partial profit target is hit and let the remaining quantity in the trade until the reversal of trend.
Instrument Type: We can select the which instrument for analysis. By adjusting the Take Partial Profit value by selecting Other Option, you can analyze instrument of your choice other than mentioned in the list for Partial Profit depending upon stock tick value and lot quantity or you can PM me. I have adjusted value for Crude Oil and Silver for MCX(India) future contract values.
This is a premium indicator so send me a private message for 15 days free trial.
"Use the link below to obtain access to this indicator."
Disclaimer: This script/strategy is for educational purpose and individual use only. The author of this script/strategy will not accept any liability for loss or damage as a result of reliance on the information contained in the charts. Please be fully informed regarding the risks and costs associated with trading the financial markets.

TCS Trading Strategy -1This Trading Strategy is for TATA Consultancy Services (TCS) which is traded on National Stock Exchange (India).
The strategy works best on 5 min timeframe. The results may very different depending upon time-frame and date range of your choice.
The default trading quantity is 2. I have added functionality for part profit booking which increase profit and always keeps you in trade.
It is non-repainting indicator and uses @version=4.
For free trial, send me a private message in order to access this script as this Invite Only script.
Thanks © allanster for Date Range functionality script.
Disclaimer: This script/strategy is for educational and information purpose only. The author of this script/strategy will not accept any liability for loss or damage as a result of reliance on the information contained in the charts and buy/sell signals. Please be fully informed regarding the risks and costs associated with trading the financial markets.

IndusInd Bank Trading Tool-1Thanks for the tremendous response I got for the Nifty-50 trading tool.
It is non-repainting indicator and uses @version=4.
This is trading tool for IndusInd Bank which is traded on National Stock Exchange (India).
The results will be very different depending upon time-frame and date range of your choice.
The strategy works best on 10 minutes timeframe. The default trading quantity is 2. I have added functionality for part profit booking.
The aim of this indicator is not to predict the market, but ride the market with its ebbs and flows. Because predicting the market is always futile. This indicator maximizes the probability of trades depending on historical prices. i.e. all the technical indicator does the same.
This is a premium indicator so send me a private message in order to access this script.
Thanks © allanster for script "How To Set Backtest Range" for Date Range functionality and ©TheYangGuizi.
Disclaimer: This script/strategy is for educational and information purpose only. The author of this script/strategy will not accept any liability for loss or damage as a result of reliance on the information contained in the charts and buy/sell signals. Please be fully informed regarding the risks and costs associated with trading the financial markets.

VWAP_OSC_MANOJVWAP OSCILLATOR is the difference between VWAPs of two time frames plotted as an histogram. It is relatively less lagging than other conventional oscillators like MACD, etc. In fact in some cases it moves alongwith the price and hence decision making is more effective.

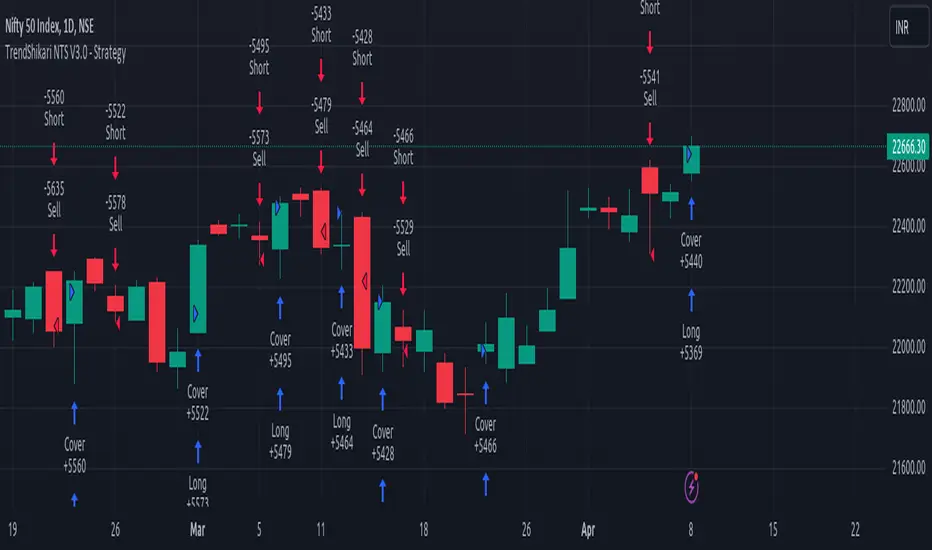
TrendShikari NTS - StrategyTrendShikari NTS is a Nifty Index, Swing trading system with great profitability. This is the STRATEGY file for you to see backtest performance along with the feature to see the next day trading levels in advance. For getting Email / SMA alerts (based on your TV subscription plan) and to see better graphic level marking use the STUDY file from the indicator library. Access to this system will be limited. See my profile status field to see how you can gain access.
Salient Features
1. Daily Bar System. System analyzes a Daily chart of NIFTY to give signals with average holding period of 5 days.
2. Automatic Long and Short signal generation. No need to draw waves / lines and other fancy stuff on your charts to analyze NIFTY any more.
3. Backtester Results Available - Thanks to TradingView, backtest results for previous years (from 1990) are available right in the charting platform for NIFTY.
Having a good trading system is one thing and trading it to make money is a whole different ball game. One thing you must always do if you want to mimic the backtest results in live trading is to follow the rules mentioned below as if your life depends on it.
Trading Rules
1. Each day the system gives you a Long and Short trading level. You go Long on NIFTY when the Daily Long level is breached and you go Short on NIFTY when the Daily Short Level is breached.
2. Trade using Nifty Options, In the Money calls, one strike below the nearest strike price for going Long using Call Option or one strike above the nearest strike price for going Short using Put Option.
3. Preset exit and entry orders of appropriate option contracts every day at market open. To set the levels see the difference in Nifty spot price and the trading levels given by system and then multiply it with 0.8 to give an approximate order trigger price in both directions for the corresponding option contracts.
4. Book profit when Nifty moves significantly along signal direction. Every time NIFTY moves 100 points in your direction you exit the current option contract and enter a trade in the next strike price in the same direction.
5. Rollover before expiry. Its important that you rollover (ideally one day before the expiry day) your Option contact positions by exiting the current month contract and take a new position in the next month contract of the same type and strike price of the current month contract.
6. Trade only Nifty using this system. Also Daily chart has to be used for trading. System parameters have been tested and optimized for Nifty Index Daily patterns only and hence is likely to give stated results with Nifty Daily chart only.
7. Trade all signals. Don't pick and choose or add your own or someone else's analysis to filter the signals. Take confidence from the objective backtest results and not any subjective interpretations.
8. Trade with only that amount of money you can afford to loose. Initial capital that you need to have to trade one lot of NIFTY Option using this system should be at least INR 150000. You need only INR 7500 - 15000 to open a position and the rest is the margin of safety you need to have in your trading account to account for drawdowns in trading. You can add the capital in a staggered need to basis to your trading account. But make sure you have the initial capital mentioned above at your disposal, if need be.
As always your thoughts and inputs are welcome. Happy Trading !!!
TrendShikari NTS - StudyTrendShikari NTS is a Nifty Index, Swing trading system with great profitability. This is the STUDY file for you to generate E-mail / SMS signal alerts (based on your TV plan) and to see crisp and clear graphical Daily trade level plotting. For seeing backtest results and next day trading levels in advance use the STRATEGY file from indicator library. Access to this system will be limited. See my profile status field to see how you can gain access.
Salient Features
1. Daily Bar System. System analyzes a Daily chart of NIFTY to give signals with average holding period of 5 days.
2. Automatic Long and Short signal generation. No need to draw waves / lines and other fancy stuff on your charts to analyze NIFTY any more.
3. Backtester Results Available - Thanks to TradingView, backtest results for previous years (from 1990) are available right in the charting platform for NIFTY.
Having a good trading system is one thing and trading it to make money is a whole different ball game. One thing you must always do if you want to mimic the backtest results in live trading is to follow the rules mentioned below as if your life depends on it.
Trading Rules
1. Each day the system gives you a Long and Short trading level. You go Long on NIFTY when the Daily Long level is breached and you go Short on NIFTY when the Daily Short Level is breached.
2. Trade using Nifty Options, In the Money calls, one strike below the nearest strike price for going Long using Call Option or one strike above the nearest strike price for going Short using Put Option.
3. Preset exit and entry orders of appropriate option contracts every day at market open. To set the levels see the difference in Nifty spot price and the trading levels given by system and then multiply it with 0.8 to give an approximate order trigger price in both directions for the corresponding option contracts.
4. Book profit when Nifty moves significantly along signal direction. Every time NIFTY moves 100 points in your direction you exit the current option contract and enter a trade in the next strike price in the same direction.
5. Rollover before expiry. Its important that you rollover (ideally one day before the expiry day) your Option contact positions by exiting the current month contract and take a new position in the next month contract of the same type and strike price of the current month contract.
6. Trade only Nifty using this system. Also Daily chart has to be used for trading. System parameters have been tested and optimized for Nifty Index Daily patterns only and hence is likely to give stated results with Nifty Daily chart only.
7. Trade all signals. Don't pick and choose or add your own or someone else's analysis to filter the signals. Take confidence from the objective backtest results and not any subjective interpretations.
8. Trade with only that amount of money you can afford to loose. Initial capital that you need to have to trade one lot of NIFTY Option using this system should be at least INR 150000. You need only INR 7500 - 15000 to open a position and the rest is the margin of safety you need to have in your trading account to account for drawdowns in trading. You can add the capital in a staggered need to basis to your trading account. But make sure you have the initial capital mentioned above at your disposal, if need be.
As always your thoughts and inputs are welcome. Happy Trading !!!
