Market Internals Dashboard (Time-Based Adaptive)Market Internals Dashboard (Time-Based Adaptive)
⚠️ IMPORTANT DISCLAIMER
This indicator is for CONFIRMATION purposes only and should NEVER be used as a standalone trading signal.
✅ Always test thoroughly in paper trading first
✅ Use as ONE confluence factor within your complete trading model
✅ Combine with price action, support/resistance, and your strategy rules
✅ Never enter trades based solely on this indicator
❌ Past performance does not guarantee future results
You are responsible for your own trading decisions and risk management.
📊 WHAT THIS INDICATOR DOES
This comprehensive Market Internals Dashboard monitors real-time NYSE and NASDAQ market breadth indicators to help traders identify:
Market Bias - Is the overall market bullish, bearish, or neutral?
Market Strength - How strong is the current move?
Divergences - Are internals confirming price action or warning of reversal?
Chop Zones - When to avoid trading due to choppy conditions
Extreme Levels - Overbought/oversold conditions for potential fades
Sector Rotation - Is money flowing to Value (NYSE) or Tech (NASDAQ)?
Key Market Internals Tracked:
NYSE Internals:
USI:TICK - Net advancing vs declining stocks
USI:ADD - Advance/Decline Line
USI:VOLD - Volume difference (up vol - down vol)
Volume Ratio - Up volume / Down volume
Cumulative TICK - Session momentum
NASDAQ Internals:
USI:TICKQ - NASDAQ tick indicator
USI:ADDQ - NASDAQ Advance/Decline
USI:VOLDQ - NASDAQ volume difference
NASDAQ Volume Ratio
Cumulative TICKQ
Additional Features:
TVC:VIX - Volatility index for risk sentiment
Volume Pulse - Institutional volume detection
TICK Delta - Momentum acceleration/deceleration
Adaptive Extreme Levels - Dynamic overbought/oversold zones
Fade Detection - Mean reversion opportunities
🎯 HOW THIS HELPS YOUR TRADING
1. Confirmation of Bias
If you're looking for longs, check if NYSE/NASDAQ show bullish alignment
Strong confluence when both markets agree with your directional bias
Avoid counter-trend trades when internals strongly oppose your setup
2. Timing Entries
Wait for internals alignment before entering
Use extreme levels for fade opportunities (mean reversion)
TICK Delta shows acceleration - enter on momentum confirmation
3. Risk Management
CHOP DETECTION warns when conditions are unfavorable
Reduce position size or stay flat during "DANGER ZONE" readings
Exit trades early if internals flip against your position
4. Divergence Alerts
When VOLD rises but price falls = potential bullish reversal
When VOLD falls but price rises = potential bearish reversal
Early warning system before price confirms the reversal
5. Session Context
Cumulative TICK shows session-wide bias
"Strong Bull Session" = favor longs, be selective with shorts
"Strong Bear Session" = favor shorts, be selective with longs
⚙️ SETTINGS GUIDE
📊 Dashboard Display
Dashboard Position - Choose where the dashboard appears (Top Right recommended)
Text Size - Adjust for screen resolution (Normal recommended)
Compact Mode - Shows only Overall Status + Scores (useful for small screens)
Color Settings - Customize background colors for different states:
Bullish/Bearish - Clear directional signals
Neutral - No clear bias
Chop/Warning - Avoid trading
No Data - Outside trading hours
💎 Signal Label
Show Signal Label - Diamond marker on chart when important signals trigger
The label's tooltip shows:
Aligned Bullish/Bearish
Strong market moves
Divergences
Extreme levels
Fade opportunities
📈 Market Internals Sources
Data Timeframe - ⚠️ CRITICAL SETTING
'1' minute = MAXIMUM ACCURACY (recommended for live trading)
'5' minute = Lower accuracy, saves memory
'15' minute = Lowest accuracy
💡 For real-time trading, ALWAYS use '1' minute!
RTH Only (9:30-16:00 EST) - Filters data to Regular Trading Hours only
Recommended: ON (internals are only meaningful during RTH)
Show NYSE/NASDAQ Groups - Enable/disable entire sections
Individual Indicators - Toggle specific internals on/off:
USI:TICK - Most reactive, shows immediate sentiment
USI:ADD - Confirms breadth, slower than TICK
USI:VOLD - Shows institutional money flow
Vol Ratio - Relative volume strength
VOLD Trend - Compares VOLD direction vs price direction
Vol Ratio Trend - Compares Vol Ratio vs price
⚙️ Thresholds
TICK/ADD Thresholds - Standard levels for bullish/bearish signals
NYSE TICK: 500 (conservative), 300 (aggressive)
NYSE ADD: 500 (conservative), 300 (aggressive)
NASDAQ TICK: 400 (conservative), 250 (aggressive)
NASDAQ ADD: 400 (conservative), 250 (aggressive)
VOLD Thresholds - Only for display color coding, not scoring
⚙️ Adaptive Extreme Levels
Use Adaptive Extreme Levels - 🔥 KEY FEATURE
ON = Dynamic thresholds based on recent volatility (RECOMMENDED)
OFF = Fixed extreme levels
Range Lookback (minutes) - Time window for calculating extremes
⚠️ IMPORTANT: Effective lookback depends on chart timeframe!
1min chart: max ~40min effective
5min chart: max ~200min effective
15min+ chart: full range available ✅
Recommended:
60min = Quick adaptation to changing volatility
120min = Balanced
180min = Stable (requires 5min+ chart)
Early Session Period - First X minutes after open use reduced lookback
30min = recommended (first half hour)
Prevents false extremes when range is still building
Early Session Multiplier - Reduces lookback during early session
0.50 = 50% of normal lookback (recommended)
0.25 = Very conservative
Extreme % from High/Low - How far from range extremes to trigger
0.90 = 90% of range (conservative)
0.80 = 80% of range (aggressive)
⚙️ Volume Ratio
Vol Ratio Bullish Threshold - e.g., 1.5 = up volume is 1.5× down volume
1.5 = balanced (recommended)
2.0 = more selective
Vol Ratio Extreme Threshold - For extreme signals
2.5 = very strong imbalance (recommended)
⚙️ VOLD Trend
VOLD Trend Period - Bars back for trend comparison
3 = recent trend (recommended for scalping)
5 = broader trend (swing trading)
VOLD Trend Weight - Importance in scoring
1.0 = equal to other indicators (recommended)
⚙️ Vol Ratio Trend
Same as VOLD Trend but for Volume Ratio
📊 Volume Pulse
Volume Pulse Lookback - Rolling average window
30min = balanced (recommended)
15min = sensitive to volume spikes
60min = stable, longer-term context
Shows when volume is:
🔵 Institutional (2.0×+ average)
High Volume (1.3×+ average)
Normal (0.7-1.3× average)
⚠️ Low Volume (<0.7× average)
📊 Cumulative TICK
Tracks session-wide momentum by summing all TICK readings.
Strong Bullish/Bearish - Thresholds for session bias
+3000 / -3000 = strong session bias (recommended)
Cumulative TICK Trend - Lookback - Bars on YOUR chart timeframe
On 15min chart: 3 bars = 45min trend
On 5min chart: 3 bars = 15min trend
Threshold - Minimum change for trend detection
200 = balanced (recommended)
500 = only strong trends
🔄 Fade Logic
Enable Fade Detection - Mean reversion after extremes
When TICK hits extreme (e.g., +1200) then reverses by X points, signals potential fade.
Fade Reversal Amount - How much TICK must reverse
200 = moderate fade (recommended)
300 = stronger confirmation needed
Require ADD Confluence - Fade signal needs ADD confirmation
ON = safer (recommended)
OFF = more signals, less reliable
⚙️ Hysteresis
Use Hysteresis - Prevents signal flickering
ON = recommended (smoother signals)
Hysteresis % - How much value must change to flip state
10% = balanced (recommended)
⚠️ Chop Detection
Warns when market conditions are unfavorable for trading.
TICK Range for Chop - If TICK stays within ±X for lookback period
400 = identifies tight consolidation (recommended)
ADD Threshold for Chop - If ADD is weak
300 = balanced (recommended)
Lookback Period - Bars to analyze
30 = recent conditions (recommended)
Max Score Difference for Chop - If bull/bear scores are similar
40% = identifies indecision (recommended)
Lunch Time Warning - 11:00-13:30 EST
ON = recommended (lunch chop is real!)
Chop Score Interpretation:
0-40% = 🟢 Tradeable
40-70% = 🟡 Choppy (be careful)
70-100% = 🔴 DANGER (avoid trading)
🎯 Scoring
Weights - Importance of each indicator in final score:
TICK Weight: 1.5 (most reactive)
ADD Weight: 1.5 (breadth confirmation)
Vol Ratio Weight: 1.0 (volume strength)
VOLD Trend Weight: 1.0 (trend confirmation)
Vol Ratio Trend Weight: 1.0 (trend confirmation)
Cumulative TICK Trend Weight: 1.5 (session momentum - very important!)
Strong Signal Threshold - Minimum % for "strong" signal
70% = recommended
80% = more selective
🔄 Alignment & Divergence
Min Score Difference for BIAS - How clear the bias must be
30% = recommended
50% = very clear bias required
Threshold for ROTATION Warning - When one market opposes the other
40% = balanced (recommended)
Rotation Types:
ROTATION TO VALUE = NYSE↑ NASDAQ↓ (buy financials/industrials)
ROTATION TO TECH = NASDAQ↑ NYSE↓ (buy tech stocks)
🔔 Alerts
Configure alerts for various conditions:
Aligned Bullish/Bearish (both markets agree)
Rotation Detected (sector rotation)
Strong Signals (70%+ score)
Chop/Danger (avoid trading)
Extreme Levels (overbought/oversold)
Divergences (early reversal warnings)
Fade Signals (mean reversion)
🎓 USAGE EXAMPLES
Example 1: Scalping ES during RTH
Setup:
Data Timeframe: 1 minute (max accuracy)
Chart: 5-minute ES
Looking for long scalp
Check Dashboard:
✅ Overall Status = "ALIGNED BULL"
✅ NYSE Score = 🟢 75%
✅ NASDAQ Score = 🟢 72%
✅ Market Quality = 🟢 OK (chop score <40%)
✅ Volume Pulse = High Volume or Institutional
Action: Enter long on your strategy signal with high confidence
Example 2: Avoiding Bad Trades
Setup:
Your strategy gives long signal
Price looks good
Check Dashboard:
❌ Overall Status = "🔴 AVOID - Both Choppy"
❌ NYSE Chop = 🔴 DANGER (75%)
❌ NASDAQ Chop = 🔴 DANGER (72%)
❌ TICK Range = narrow consolidation
Action: SKIP THE TRADE - Internals warn conditions are unfavorable
Example 3: Fade Opportunity
Setup:
Market pushed to extreme
Looking for reversal
Check Dashboard:
🔻 NYSE FADE SHORT signal appears
⚡ TICK was +1200 (extreme)
📉 Now reversed to +950
✅ ADD confirmed (turning negative)
Action: Consider short entry (with your reversal setup)
Example 4: Divergence Warning
Setup:
ES making new highs
You're in a long position
Check Dashboard:
⚠️ NYSE BEAR DIVERGENCE
📊 VOLD falling while price rising
🟡 Overall Status changing to "MIXED"
Action: Tighten stops or take profits - internals warn momentum fading
💡 BEST PRACTICES
DO:
✅ Test extensively before live trading
✅ Use on 5min or 15min charts for swing trades
✅ Use on 1min or 3min charts for scalping
✅ Combine with your proven strategy
✅ Respect CHOP DETECTION warnings
✅ Use Data Timeframe = 1 for accuracy
✅ Monitor Volume Pulse for institutional activity
✅ Watch for divergences as early warnings
DON'T:
❌ Trade based on internals alone
❌ Ignore chop warnings ("I'll be careful")
❌ Use Data Timeframe >5 for live trading
❌ Trade against aligned strong signals
❌ Overtrade - wait for quality setups
❌ Ignore session context (Cumulative TICK)
🔧 RECOMMENDED SETTINGS
For Day Trading (Scalping):
Data Timeframe: 1
Adaptive Extremes: ON
Range Lookback: 60 minutes
VOLD Trend Period: 3
Cumulative TICK Weight: 1.5 (important!)
Chop Detection: ON
For Swing Trading:
Data Timeframe: 5
Range Lookback: 120 minutes
VOLD Trend Period: 5
Strong Threshold: 75%
📝 NOTES
Market internals are most reliable during regular trading hours (9:30-16:00 EST)
Lunch period (11:00-13:30 EST) often shows choppy behavior
First 30 minutes after open can be erratic - use early session adjustments
Power hours (9:30-10:30 and 15:00-16:00) tend to have cleaner trends
Volume Pulse helps identify when "smart money" is active
🤝 SUPPORT
If you find this indicator helpful, please consider:
⭐ Leaving a positive review
💬 Sharing your trading experience
📈 Supporting my work with a TradingView subscription (any tier helps!)
Creating and maintaining free, high-quality indicators takes significant time and effort. Your support enables me to continue developing tools for the trading community and keep them updated. Thank you! 🙏
Remember: This is a tool, not a system. Your trading success depends on YOUR complete strategy, risk management, and discipline.
Good luck and trade safe! 🚀
Breath

Advance/Decline Line [IQ]Advance/Decline Line is a Market Breath indicator.
A/D line calculates a ratio between total number stocks advancing and total number of stocks in one day, providing another way to grasp the market breath at any moment.
We think the indicator covers the whole market, as we use data from the three main exchanges: NYSE, NASDAQ and AMEX.
The New York Stock Exchange (NYSE), nicknamed "The Big Board") is by far the world's largest stock exchange by market capitalization of its listed companies.
The Nasdaq Stock Market (NASDAQ) is ranked second on the list of stock exchanges by market capitalization of shares traded, behind the New York Stock Exchange.
The American Stock Exchange (AMEX) is the third largest stock exchange in the U.S. after the NYSE and the NASDAQ, and handles approximately 10% of all American trades.
How to interpret it:
Green columns mean more than 50% of NASDAQ stocks are advancing, red columns mean more than 50% of NASDAQ stocks are declining.
Green values above the top band mean correlation to the upside, red values bellow the low band mean correlation to the downside.
Correlation means rising probability of capitulation (to the upside or to the downside) and is market by a white bar (as signal).
Important:
For a better interpretation, the Advance/Decline Line indicator should be used in conjunction with other indicators (volatility, volume, etc.).

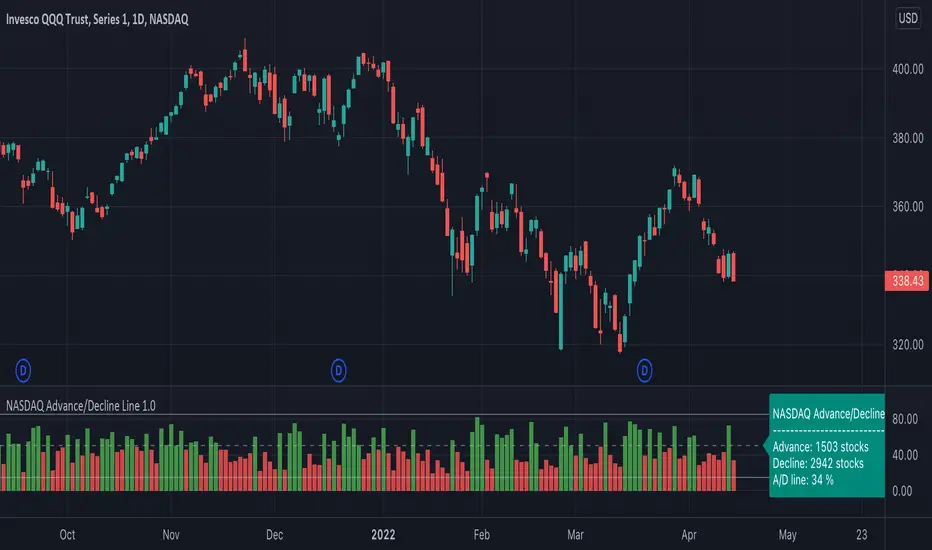
NASDAQ Advance/Decline Line 1.0NASDAQ Advance/Decline Line is a Market Breath indicator.
Brought to you by IQ-trading (Andrei Bogdan) via Trading View Pine script. If you find this helpful in anyway, please leave a like!
A/D line calculates a ratio between total number of NASDAQ stocks advancing and total number of NASDAQ stocks in one day, providing another way to grasp the market breath at any moment.A
Green columns mean more than 50% of NASDAQ stocks are advancing, red columns mean more than 50% of NASDAQ stocks are declining.
Green values above the top band mean correlation to the upside, red values bellow the low band mean correlation to the downside.
Correlation means rising probability of capitulation (to the upside or to the downside).
For a better interpretation, NASDAQ Advance/Decline Line should be used in conjunction with other indicators (volatility, volume, etc.).
--------------------
NASDAQ here refers to the totality of assets listed on the NASDAQ exchange, not to the Nasdaq Composite index or the Nasdaq100 index.
NASDAQ is the second-largest stock exchange on earth, and operates the two major stock indexes based on companies that trade on its exchange: the Nasdaq Composite and the Nasdaq 100.
The Nasdaq Composite tracks the performance of more than 3,000 stocks listed on the Nasdaq while the Nasdaq 100 captures the performance of the exchange’s largest non-financial companies.
McClellan Oscillator for nifty 50This is a indicator which indicates breath of the market.
If found relevant do let me know!!
Only handpicked relevant 20 stocks (20 +ve indicator+ 20 -ve indicator) from different sector .
As there is the limit of 40 script allowed only.
Further modifications might be there if the limit is increased to 100 (50 +50 indicator) .
