TrendSphere (Zeiierman)█ Overview
TrendSphere is designed to capture and visualize market trends and volatility effectively. It combines various volatility measures and trend analysis techniques, producing dynamic bands and a central trend line on the price chart. Its essence is to offer a real-time, reliable estimate of the underlying linear trend in the price.
█ How It Works
Real-Time Trend Estimation
At its core, TrendSphere is designed to offer instantaneous and accurate insights into the inherent linear trend of asset prices. By continually updating its estimations, it ensures traders are equipped with the most current data. This allows the construction of support and resistance bands around the estimated trend, providing trading opportunities.
Dynamic Bands and Trend Line
TrendSphere plots a central trend line and dynamic bands around it on the price chart. Influenced by volatility, the distance between these elements offers a clear view of market conditions and the strength or weakness of trends. These bands not only depict potential turning points but also offer traders valuable opportunities to trade within the confines of the overarching trend.
Volatility Measures
Traders can select their preferred volatility measure and adjust settings to best fit their analysis needs. The bands and trend line dynamically respond to these selections, offering a tailored view of market conditions.
ATR (Average True Range): Reflects market volatility by evaluating the range between high and low prices.
Historical Volatility: Computes price variability using the standard deviation of log returns.
Bollinger Band Width: Measures the distance between Bollinger Bands, providing another angle on market volatility.
Eliminating Common Complications
One of the standout features of TrendSphere is its ability to determine linear price trends without falling prey to challenges like backpainting or repainting. In layman's terms, this means traders get a more trustworthy and unaltered view of price movements, leading to enhanced decision-making in line with the genuine trajectory of price trends.
█ How to Use
Trend Analysis
Observe the central trend line; its direction indicates the prevailing trend. When the price is above the trend line, it suggests an upward trend, and when it's below, it indicates a downward trend.
Volatility Analysis
Wider bands imply higher market volatility, suggesting larger price swings, while narrower bands indicate lower volatility. Traders can use the bands to identify potential reversal points and overbought/oversold conditions.
Potential Trading Signals (Using Bollinger bandwidth as volatility measure)
Consider buying when the price is above the trend line with narrowing bands, suggesting a strong upward trend.
Consider selling when the price is below the trend line with narrowing bands, indicating a strong downward trend.
█ Settings
Select Volatility Measure
Choose the desired volatility measure: ATR, Historical Volatility, or Bollinger Band Width.
Volatility Scaling Factor
Adjusts the scale of the volatility measure, influencing the width of the bands.
Volatility Strength
Modifies the influence of volatility on the bands, adjusting their responsiveness to volatility changes.
Length
Defines the number of periods used in calculating the selected volatility measure, impacting the stability and responsiveness of the bands.
Trend Sensitivity
Adjusts the sensitivity of the trend component, affecting how quickly it reacts to price changes.
█ Related scripts with the same calculation philosophy
TrendCylinder
Predictive Trend and Structure
-----------------
Disclaimer
The information contained in my Scripts/Indicators/Ideas/Algos/Systems does not constitute financial advice or a solicitation to buy or sell any securities of any type. I will not accept liability for any loss or damage, including without limitation any loss of profit, which may arise directly or indirectly from the use of or reliance on such information.
All investments involve risk, and the past performance of a security, industry, sector, market, financial product, trading strategy, backtest, or individual's trading does not guarantee future results or returns. Investors are fully responsible for any investment decisions they make. Such decisions should be based solely on an evaluation of their financial circumstances, investment objectives, risk tolerance, and liquidity needs.
My Scripts/Indicators/Ideas/Algos/Systems are only for educational purposes!
Breakouttrading

The Opening Range / First Bar By Market Mindset - Zero To EndlesThe script shows the opening range of the instrument based on different resolutions and timeframes.
Inputs :
1. Resolution
It decides the calculation frequency of the script.
In Auto resolution, Standard values have been used.
2. Timeframe
It decides the timeframe for the OHLC values.
By default, it will use the chart timeframe and so chart OHLC values.
3. Lookback
It decides the no. of ranges shown on the chart.
Middle Line can be hidden from the settings.
The script can be used for any instrument and on any timeframe.
If price is above the opening range or the middle line, a trader should look for long opportunities.
If price is below the opening range or the middle line, a trader should look for short opportunities.
A sideways or choppy move is exoected if Middle line is crossed again and again.
For trading, wait for atleast 1st bar to close. and let the opening range build up first.
Happy Trading

TrendCylinder (Expo)█ Overview
The TrendCylinder is a dynamic trading indicator designed to capture trends and volatility in an asset's price. It provides a visualization of the current trend direction and upper and lower bands that adapt to volatility changes. By using this indicator, traders can identify potential breakouts or support and resistance levels. While also gauging the volatility to generate trading ranges. The indicator is a comprehensive tool for traders navigating various market conditions by providing a sophisticated blend of trend-following and volatility-based metrics.
█ How It Works
Trend Line: The trend line is constructed using the closing prices with the influence of volatility metrics. The trend line reacts to sudden price changes based on the trend factor and step settings.
Upper & Lower Bands: These bands are not static; they are dynamically adjusted with the calculated standard deviation and Average True Range (ATR) metrics to offer a more flexible, real-world representation of potential price movements, offering an idea of the market's likely trading range.
█ How to Use
Identifying Trends
The trend line can be used to identify the current market trend. If the price is above the trend line, it indicates a bullish trend. Conversely, if the price is below the trend line, it indicates a bearish trend.
Dynamic Support and Resistance
The upper and lower bands (including the trend line) dynamically change with market volatility, acting as moving targets of support and resistance. This helps set up stop-loss or take-profit levels with a higher degree of accuracy.
Breakout vs. Reversion Strategies
Price movements beyond the bands could signify strong trends, making it ideal for breakout strategies.
Fakeouts
If the price touches one of the bands and reverses direction, it could be a fakeout. Traders may choose to trade against the breakout in such scenarios.
█ Settings
Volatility Period: Defines the look-back period for calculating volatility. Higher values adapt the bands more slowly, whereas lower values adapt them more quickly.
Trend Factor: Adjusts the sensitivity of the trend line. Higher values produce a smoother line, while lower values make it more reactive to price changes.
Trend Step: Controls the pace at which the trend line adjusts to sudden price movements. Higher values lead to a slower adjustment and a smoother line, while lower values result in quicker adjustments.
-----------------
Disclaimer
The information contained in my Scripts/Indicators/Ideas/Algos/Systems does not constitute financial advice or a solicitation to buy or sell any securities of any type. I will not accept liability for any loss or damage, including without limitation any loss of profit, which may arise directly or indirectly from the use of or reliance on such information.
All investments involve risk, and the past performance of a security, industry, sector, market, financial product, trading strategy, backtest, or individual's trading does not guarantee future results or returns. Investors are fully responsible for any investment decisions they make. Such decisions should be based solely on an evaluation of their financial circumstances, investment objectives, risk tolerance, and liquidity needs.
My Scripts/Indicators/Ideas/Algos/Systems are only for educational purposes!

Support & Resistance PROHi Traders!
The Support & Resistance PRO
A simple and effective indicator that helped me a bunch!
This indicator will chart simple support and resistance zones on 2 time frames of your choice.
It uses a 30 day lookback period and will find the last high and low.
Each zone is built from the highest/lowest closure, and the highest/lowest wick, creating a liquid zone between the 2.
It is perfect for people trading support and resistance, watching key areas, scalping zones and much more!
*You can change the time frames you are looking at and the lookback period.
*The example in the picture is looking at the Daily and Weekly zones on BTC.

EMA Screener with Day BreakoutsThe present script is aimed at screening number of stocks as per user input with respect to Daily Exponential Moving Average. Default is set at 200 DEMA, it can be changed by the user from settings menu as per user's preference.
The EMA cell illuminates to Green if Day's Open < EMA
The EMA cell illuminates to Purple if Day's Open > EMA
EMU cell shows the price as, EMA * EMA Price Multiplier (i.e. range below EMA, customizable from settings by user)
EMU cell illuminates to light Green when Price > EMU (i.e. the price is in range of EMA, For example suppose EMA value is 1000 and EMA Price Multiplier is 0.95 then the EMU cell value will be 950 as soon as the price crosses above 950 the EMU cell will get illuminated)
EMD cell shows the price as, EMA * EMA Price Multiplier (i.e. range above EMA, customizable from settings by user)
EMD cell illuminates to red when Price < EMD (i.e. the price is in range of EMA, For example suppose EMA value is 1000 and EMA Price Multiplier is 1.05 then the EMD cell value will be 1050 as soon as the price crosses below 1050 the EMD cell will get illuminated)
The DBO (Day Break Out) cell illuminates to Blue when the current price is near Day's high.
--Dr. Vats
Disclaimer: Only for studying price movement ideas, trading is not advised.

Main Market Opener Breakout [RH]Based on my observations while analyzing the crypto and forex charts, particularly BTCUSDT and EURUSD, I have noticed that the prices exhibit significant movements during most stock market sessions, particularly during New York main market session.
With the aim of capturing these moves, I embarked on extensive research. Through this research, I discovered that by considering the very first "15m" or "30m" candle of the main market trading session and marking that first candle's high and low points, we can create potential trigger points.
A break above the high point indicates a bullish signal, while a break below the low point suggests a bearish signal. To further refine our analysis and filter out some noise, we can incorporate the Average True Range (ATR) value of that candle.
Candle time is very important here. We will mark the candle when the actual trading begins in New York stock exchange. The trading hours for the New York Stock Exchange (NYSE) typically begin at 9:30 AM and end at 4:00 PM Eastern Time (ET), Monday through Friday. This is known as the "NYSE Regular Trading Session." However, it's important to note that there are also pre-market and after-hours trading sessions that occur outside of these core hours. We will not consider these pre and after-hours.
Example:
First break-above and break-below is marked automatically and alerts are also available for first breaks.
Example:
I have also added the option to add the, London Stock Exchange Main Market and Tokyo Stock Exchange Regular Trading Session. You can add those sessions also and test with different symbols.
Stocks symbols from different stock exchanges just mark the very first candle of the day(main market trading session).
Alerts are available.

BANKNIFTY position screenerThe script takes present day's price range of the stocks (stocks of the Index being tracked included in this screener) into account, to hint strength or weakness in the underlying Index (for example: BANKNIFTY here). The day's price range of a stock is gauged on a scale of 0-100, where 0 is Day's price low and 100 is day's price high.
If a stock is in 90-100 price range section the cell with title "90" illuminates hinting the stock is trading near day's high.
Likewise, if a stock is in 0-10 price range section the cell with title "10" illuminates hinting that the stock is trading near day's low.
The price range of 10-25 is represented in the cell titled "25"
The price range of 75-90 is represented in the cell titled "75"
Only one cell from the day's range illuminates at a time for a stock, signaling the present position of that stock in the Day's range at that instant.
The script works best above 10 second time frame.
Idea: If majority of the heavy weight stocks of the Index being tracked are trading near Day's high the underlying Index must be going strong at that very instant and Vice versa.
Disclaimer: Only for studying Index movement ideas intraday, trading is not advised.

Day's First Candle High & Low and + or - 10 pointThis code is an indicator that calculates and plots the high and low of the first candle of the day, along with parallel lines. The purpose of the indicator is to help traders identify potential support and resistance levels for the day.
The code checks if a new day has started and, if so, calculates the high and low of the first candle of the day. It then plots the high and low as well as parallel lines that are 200 ticks (10 points) above and below the first candle's high and low, respectively.
The resulting plot shows the first candle's high and low, as well as the upper and lower boundaries that may act as support and resistance levels throughout the trading day.

TradeEasy - KintroThe TradingView script provided is a custom indicator named "TradeEasy - Kintro". It is created by the author Kintro and is designed to help traders identify potential buy and sell signals in the market. The indicator is based on the Exponential Moving Average (EMA) and uses two different EMAs, one with a period of 20 and the other with a period of 50.
The indicator is meant to be used on the 5-minute timeframe and it is recommended to use TradingView in Dark Mode for better appearance. The author also reminds users that no strategy works 100% accurately and backtesting should be done before trading with a real account. The author is not responsible for any losses incurred by traders.
The indicator uses a simple set of rules to generate trading signals. The thick line on the chart represents the 50 EMA while the thin line represents the 20 EMA. When the thin line crosses upwards over the thick line, it indicates a bullish signal. After the crossover, traders are advised to wait for the price to pullback between the two lines. A range should then be created while the price moves through the thin line.
On the break of the range, an entry signal is generated, and the stop loss should be set below the range. The author advises traders to exit their profits according to their own analysis or price action and not to re-enter on the next pullback of the same trend. The same rules apply when the thin line crosses downwards over the thick line.
The author emphasizes that range creation is mandatory on crossing and that traders should not try to go against the trend. If the price is above both lines, traders should only go for buy orders, and vice versa.
If there is no range created while crossing, traders are advised not to enter the market. Traders should wait for the opportunity and not force a trade.
The indicator also includes a plot of the 34 EMA, and a range is created above and below the price action using the "up" and "down" variables. The author uses the "fill" function to color the background of the chart to highlight the range. The "dummy" variable is used to plot circles above or below the price action, depending on the trend.
In summary, the "TradeEasy - Kintro" indicator is a custom indicator designed to help traders identify potential buy and sell signals based on the crossing of two EMAs. The author provides a set of rules to generate trading signals and advises traders to wait for the opportunity and not force a trade. The indicator also includes a visual representation of the range created on the chart. As always, traders are advised to conduct their own research and analysis before entering any trades.

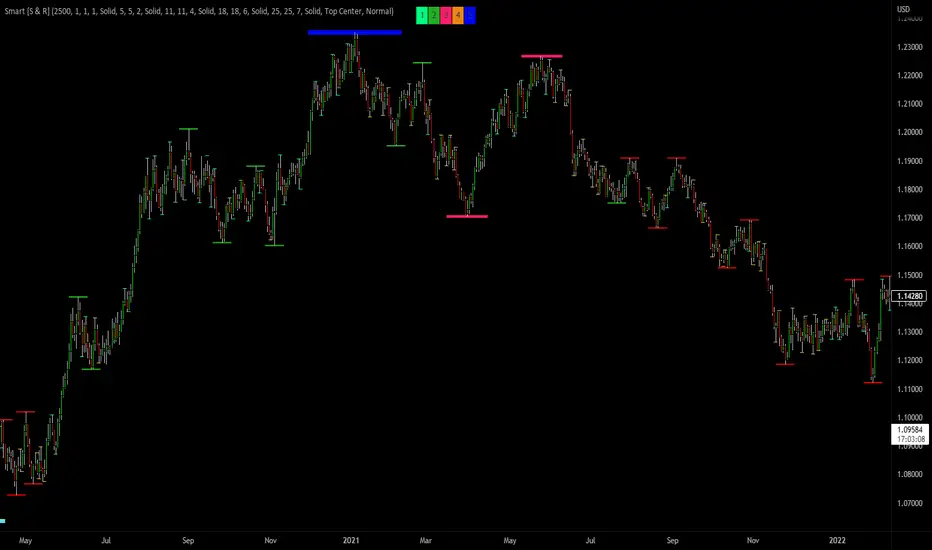
Smart Support & Resistance(My goal creating this indicator): Provide a way to categorize and label key structures on multiple different levels so I can create a plan based on those observable facts.
The Underlying Concept / What is Momentum?
Momentum indicates transaction pressure. If the algorithm detects price is going up, that would be considered positive momentum. If the algorithm detects price is going down negative momentum would be detected.
The Momentum shown is derived from a price action pattern. Unlike my previous Support & Resistance indicator that used Super Trend, this indicator uses a unique pattern I created. On the first bar bearish momentum is detected a resistance Level is made at the highest point of the previous bullish condition. On the first bar bullish momentum is detected a support Level is made at the lowest point of the previous bearish condition. This happens on 5 different Momentum Levels, (short-term to long-term). I currently use this pattern to trade so the source code is protected.
What is Severity?
Severity is How we differentiate the importance of different Highs and Lows. If Momentum is detected on a higher level the Supply or Demand Level is updated. The Color and Size representing that Level will be shown. Demand and Supply Levels made by higher levels are more SEVERE than a demand level made by a lower level.
Technical Inputs
- to ensure the correct calculation of Support and Resistance levels change BAR_INDEX. BAR_INDEX creates a buffer at the start of the chart. For example: If you set BAR_INDEX to 300. The script will wait for 300 bars to elapse on the current chart before running. This allows the script more time to gather data. Which is needed in order for our dynamic lookback length to never return an error (Dynamic lookback length can't be negative or zero). The lower the timeframe the greater the number of bars need. For Example, if I open up a 1min chart I would enter 5000 as my BAR_INDEX since that will provide enough data to ensure the correct calculation of Support and Resistance levels. If I was on a daily chart, I would enter a lower number such as 800. Don't be afraid to play around with this.
- Toggle options (Close) or (High & Low) creates Support and Resistance Levels using the Lowest close and Highest close or using the Lowest low and Highest high.
Level Inputs
- The indicator has 5 Different Levels indicating SEVEREITY of a Supply and Demand Levels. The higher the Level the more SEVERE the Level.
Display Inputs
- You have the option to customize the Length, Width, Line Style, and Colors of all 5 different
- This indicator includes a Trend Chart. To Easily verify the current trend of any displayed by this indicator toggle on Chart On/Off. You also get the option to change the Chart Position and the size of the Trend Chart
How Trend Is being Determined?
(Close > Current Supply Level) if this statement is true technically price made a HH, so the trend is bullish.
(Close < Current Demand Level) if this statement is true technically price made a LL, so the trend is bearish.
- Fully customize how you display Market Structure on different levels. Line Length, Line Width, Line Style, and Line color can all be customized.
How it can be used?
(Examples of Different ways you can use this indicator): Easily categorize the severity of each and every Supply or Demand Level in the market (The higher Level the stronger the level)
: Quickly Determine the trend of any Level.
: Get a consistent view of a market and how different Levels are behaving but just use one chart.
: Take the discretion from hand drawing support and resistance lines out of your trading.
: Find and categorize strong levels for potential breakouts.
: Trend Analysis, use Levels to create a narrative based on observable facts from these Levels.
: Different Targets to take money off the table.
: Use Severity to differentiate between different trend line setups.
: Find Great places to move your stop loss too.
Traffic Light Signal - POSTraffic Light Signal (TLS) is simple and most easy setup to trade.
How The Traffic Light Signal Works ?
First You have to find a Green and red candle pair or red and green candle pair then mark there highest high and lowest low with the help of line tool. if High breaks go for Buy and when low breaks go Sell. Avoid Doji candle Pair to get better result.
Additonal Indicator Used :
Relative Strength Index : To find Overbought and Oversold Zones
How to Take trade with The help of TLS indicator :
The Indicator detects the Pair candle and detect whether the pair bar high or low cross over or cross under and display the signal over the chart.
if Triangle UP Shape Appears on chart , Once the high of the signal candle breaks take entry for buy side StopLoss will be low of the signal candle.
if Triangle Down Shape Appears on chart, once the low of the signal candle breaks take entry for Short side StopLoss will be low of the signal Candle.
Always Try to take profit 1:2 or as per your risk rewards.
Note :
if you are scalping then avoid first and Last Bar of day in 1 min and 3 min timeframe only
if you are Intraday Trader Use 5 Min and 15 Min max for this strategy.
if your are positional Trader use 1hr or 1 day Timeframe to trade.
No more than 3 trades to trade on this indicator.
Use Additional Indicator for Accuracy
Indicator works on Crypto , Equity , Futures , Options.
Hope you like this if any issue with this indicator ask below or message me.
Thanks and Regards,
TradingTail

VWAP Bollinger Band Crossover Breakout with ResistanceCredit to © Jesus_Salvatierra for VWAP script
This script help you find a trend in momentum stock that is about to breakout and shows resistance point. This script utilizes Bollinger bands VWAP and is good for intra day charts.
VWAP, or Volume Weighted Average Price, is a technical analysis tool used to measure the average price a security trades at during a given time period, weighted by the trading volume for each price level. It is commonly used by traders and investors to identify the true average price of a security and to assess whether they are buying or selling at a fair price.
A Bollinger Band is a technical analysis tool that uses standard deviation to measure the volatility of a security. The Bollinger Band is typically composed of three lines: the upper band, the lower band, and the middle band. The middle band is a simple moving average of the security's price, while the upper and lower bands are calculated based on the standard deviation of the security's price.
A Bollinger Band crossover occurs when the price of a security crosses above or below one of the bands. When the price crosses above the upper band, it is considered overbought, while when it crosses below the lower band, it is considered oversold. Traders often use Bollinger Band crossovers as a signal to enter or exit a position, depending on their trading strategy.
The VWAP and Bollinger Band crossover are two separate technical analysis tools that can be used in conjunction with each other. When a security's price crosses above or below the Bollinger Band, traders may look to the VWAP to confirm whether the security is trading at a fair price. If the security is trading above the VWAP, it may be overvalued, while if it is trading below the VWAP, it may be undervalued. Similarly, traders may use the Bollinger Band crossover as a signal to enter or exit a position, while also taking into account the VWAP to assess whether the price is fair.

Opening Range & Daily and Weekly PivotsThis script is for a combination of two indicators: an Opening Range Breakout (ORB) indicator and a daily/weekly high/low pivot indicator. The ORB indicator displays the opening range (the high and low of the first X minutes of the trading day, where X is a user-defined parameter) as two lines on the chart. If the price closes above the ORB high, the script triggers an alert with the message "Price has broken above the opening range." Similarly, if the price closes below the ORB low, the script triggers an alert with the message "Price has broken below the opening range."
The daily/weekly high/low pivot indicator plots the previous day's high and low as well as the previous week's high and low. If the current price closes above yesterday's high or last week's high, the script triggers an alert with the messages "We are now trading higher than the previous daily high" and "We are now trading higher than the last week high", respectively. If the current price closes below yesterday's low or last week's low, the script triggers an alert with the messages "We are now trading lower than the previous daily low" and "We are now trading lower than the last week low", respectively.
In addition to the visual representation on the chart, the script also triggers alerts when the price crosses any of these levels. These alerts are intended to help traders make decisions about entering or exiting trades based on the price action relative to key levels of support and resistance.

Opening Range Breakout (and price targets)This Opening Range Breakout indicator stands apart from others for several reasons. Apart from displaying the opening range high and low on a chart, the script also plots customized potential price targets ( different from any other on TradingView! ) for breakouts and breakdowns in price action. These customized targets can be toggled on and off in the input section of the indicator's settings.
With regard to the indicator itself, it has two other key inputs, the "ORB total time (minutes)" and "ORB Timeframe". The first input sets the maximum number of minutes to be used in the calculation of the opening range, and the second input sets the specific time frame when the opening range is calculated. The script plots the opening range high and low on the chart as two separate lines with the high in blue and the low in white, and these lines dynamically change color of the high to green and the low to red if the current price is above or below the opening range, respectively.
The script starts by calculating whether or not the current bar falls within the specified time frame. It then sets the initial values of the opening range high and low, and continuously updates these values if the current bar's high or low is higher or lower than the previous values, respectively. The updated values are then plotted on the chart with the specified style and color.
Traders may use the ORB Indicator to trade breakouts and breakdowns of the opening range. If the price breaks above the opening range high, traders may look to enter long positions, and if the price breaks below the opening range low, traders may look to enter short positions. The customized price targets may be consulted for potential areas to take profit. The color change of the high and low lines can provide additional confirmation of a potential breakout or breakdown, adding to the strength of the trade setup. It is important to note that the ORB Indicator does not guarantee success, and traders should always consider other technical and fundamental factors before entering a trade.
Users can also create alerts for when price breaks above or below the opening range. This will provide up-to-date live alerts for traders who cannot be staring at their screens all day long.

BE - Pr_DayLowHigh_BreakoutScreener AlgoHerewith presenting the Screener based indicator which supports Algo trade on the NSE stocks. The idea behind this indicator is when the Current day stock breaks out of Yesterday's high or Low with promising volumes (Using MA's and POC of Volume Profile) along with formation of candle Pattern. Initiates the Trade entries.
Note: Indicator is designed to take an entry even before the candle is closed as soon as the entry level is crossed and it shall exit the trade as soon as the SL is hit even before candle is close.
How to Work with this Indicator.
You can map up to 15 Scripts in this indicator. However you may decide if you wish to load all 15 are few of them. if you wish to load only 10, below settings should help you ignore the rest 10 symbols from screening it for setups
Updating Symbol Script.
This is an important part is used for Algo trades. Read the tooltip for better understanding of the format. Acceptable format is Broker Name followed with : and space with Symbol mapping Name followed with / and Instrument token provided by broker if no token alloted for the script then you may keep 0 against symbol name followed with / and Qty in terms of absolute value or in terms of percentage.
Trade and Scan Settings
Symbol List Mapping
For Improvements in Results - Use Events and keep a track of it / use Nudges etc.

Fibonacci Breakout Target LevelsFibonacci Extension
Fibonacci Extension is a powerful technical analysis tool that traders use to predict where the market might find support and resistance. It is based on the Fibonacci sequence and uses levels that are found by extending the 23.6%, 38.2%, 50%, 61.8%, and 100% Fibonacci ratios from a swing high or low. These levels can be used to find possible areas of support and resistance, and traders often use them to figure out when to get into or get out of a trade.
What does this indicator do?
This indicator gets five levels of the Fibonacci Extension and uses it for both the low and the high. The default lookback period is 10 days, and it checks for the highest and lowest price in that period. Then it calculates the extension levels and plots them, and it also adds a line that shows you the current breakout target levels.
How to use?
The primary use intended for this indicator is to be used to determine possible breakout target levels. Let's say you are trading a range and a breakout happens. You can use this indicator to determine possible take-profit zones and possible support and resistance zones.
Features:
Change the lookback period for the Fibonacci Extension levels.
Disable the Fibonacci Bands if you just want to see the FIB levels.
You can also change the 5 levels and add different Fibonacci numbers.
In this image, you can see how you can use this indicator to determine take-profit levels. The Fibonacci Extensions will determine potential support and resistance levels, which could be good places to exit your long or short positions.

Donchian Cloud Score w/ TableThis indicator contains a set of 5 Donchian channels (upper, lower, and basis plotted) defaulted to lengths of 25, 50, 100, 150, and 200. A set of conditions associated with the channels aims to determine ranging versus trending markets. Weights are given to these conditions accordingly, then tallied up to determine the "cloud score", ranging between -25 and 25. For the purposes of this indicator, a ranging market is determined by a cloud score between -10 and 10, while a positive trending market has a score higher than 10 and a negative trending market has a score lower than -10. This score is accompanied by altered bar color to reflect the score - gray for ranging markets, green for positive trending markets, and red for negative trending markets. Breaking of upper or lower Donchian bands is typically a good indication of a potential breakout. Having a weighted system for these conditions will provide more insight and layers of confirmation into a Donchian breakout trading strategy. The table will reflect these values through positive, negative, and neutral coloration.
The list of conditions and their associated weights for this indicator are as follows:
- Broke the 25-length DC (DC(25)) upper band in the previous 3 bars - +1 if true, 0 if false
- Broke the DC(50) upper band in the previous 3 bars - +2 if true, 0 if false
- Broke the DC(100) upper band in the previous 3 bars - +3 if true, 0 if false
- Broke the DC(150) upper band in the previous 3 bars - +4 if true, 0 if false
- Broke the DC(200) upper band in the previous 3 bars - +5 if true, 0 if false
- Broke the DC(25) lower band in the previous 3 bars - -1 if true, 0 if false
- Broke the DC(50) lower band in the previous 3 bars - -2 if true, 0 if false
- Broke the DC(100) lower band in the previous 3 bars - -3 if true, 0 if false
- Broke the DC(150) lower band in the previous 3 bars - -4 if true, 0 if false
- Broke the DC(200) lower band in the previous 3 bars - -5 if true, 0 if false
- DC(25) basis line above the DC(50) basis line - +1 if true, -1 if false
- DC(25) basis line above the DC(100) basis line - +1 if true, -1 if false
- DC(25)basis line above the DC(150) basis line - +1 if true, -1 if false
- DC(25) basis line above the DC(200) basis line - +1 if true, -1 if false
- DC(50) basis line above the DC(100) basis line - +1 if true, -1 if false
- DC(50) basis line above the DC(150) basis line - +1 if true, -1 if false
- DC(50) basis line above the DC(200) basis line - +1 if true, -1 if false
- DC(100) basis line above the DC(150) basis line - +1 if true, -1 if false
- DC(100) basis line above the DC(200) basis line - +1 if true, -1 if false
- DC(150) basis line above the DC(200) basis line - +1 if true, -1 if false

BE- InsideOut Explosion - Trade the Benefit Of DoubtDear Traders,
Here with presenting the new Indicator which is primarily built based on the the concept Contraction & Explosion.
Idea behind this Indicator: I am sure every trader would have heard about consolidation and Expansion. When we we look deep inside the consolidation zone it leaves a mark
on the direction most of the time and just explode breaking the consolidation zone. What if the explosion is to trap the retailers like me!!. That's why I call this as Benefit of doubt. If the direction of is right I just sail with the trade right inside the consolidation zone. If I am on the wrong side ! No worries My Money management rules and Protection Legs kicks in and saves my capital.
This Indicator Analyses the Volume, and Chart Patterns inside the Zones and if the price breaks the patterns, initiate the trades. You can trade with Dhan HQ or Algoji.
What this indicator is providing:
Based on the chart patterns and using the inputs provided for RISK and Money Management options, Indicator continuously scans for trading opportunities and provides alerts for possible trades. I have tried to capture some analytical inputs for one to think and take control over the Reward, Risk and Money management parameters to tweak the indicator accordingly.
Note: Indicated PNL is calculated on the Futures Chart with 2 Lots taken per trade.
If you are a Options Traders:
1. Auto Strike is inbuilt and can be traded only if you are trading via AlgoJi.
You will constantly be informed about trade summary, PNL and SL updates as per your preferred choice.
Enjoy!
DISCLAIMER: No sharing, copying, reselling, modifying, or any other forms of use are authorized for our documents, script / strategy, and the information published with them. This informational planning script / strategy is strictly for individual use and educational purposes only. This is not financial or investment advice. Investments are always made at your own risk and are based on your personal judgement. I am not responsible for any losses you may incur. Please invest wisely.
Happy to receive suggestions and feedback in order to improve the performance of the indicator better.

Boom Hunter XBoom Hunter X is built to target breakouts and explosive moves. The strength of this indicator is in slower timeframes like daily, weekly and monthly but it also works great on 4 hour timeframes. It is a modified version of Boom Hunter XL designed to be simple and easy to use. There are minimal settings available, aside from being able to choose the length of the oscillator there are 3 presets available. Preset 1 is the fastest and is great for targeting entries. Preset 3 is the slowest and is perfect for highlighting trends and setting up big moves. Preset 2 is somewhere in the middle and works great for entries and trend. To get a full picture of price action it is recommended to use all three indicators on your chart. The indicator will automatically adjust lengths when using weekly and monthly charts. If using faster timeframes try adjust the length to 6 or 9.
To get best results use Preset 3 to identify the trend of price action. When Preset 3 is in teal look for long entries on Presets 1 and 2. Likewise, when in red look for shorts. The best entries come from the first pullbacks. Below is an example of entering with the trend.
Using slow charts like weekly and monthly makes it easy to see what is happening with the markets. Below is an example of how easy it is to stay ahead of the curve and identify booms.
First pullbacks are signalled with outlined triangles: ▵▿
These signals are only available on preset 2 and 3. First pullbacks are picked up after price action breaks its median or dynamic median also known as OSC3 (OSC3 is hidden and works in the background), The strongest long pullbacks are when the oscillator is above the median and in the teal. Likewise the strongest short entries are when the oscillator is below the median and in the red. First pullback signals often signal the start of a new trend. Below is an example on a daily chart.
Breaks in support and resistance are signalled with white arrows: ˰˅
Preset 3 highlights the biggest breakouts while preset 1 will show the breaks within the breaks. Preset 2 provides a nice blend between the both and works great for targeting breakouts. It is not recommended to enter on the break as price action will come back to test. The first pullback after the break is typically the best and safest entry for breakouts. Below is an example of the break signal using preset 2 on weekly chart.
Breakout entries are signalled with teal and red triangles. Breakout signals filter price action for safe confirmed pullback entries. The slower the timeframe the bigger the breakout. Presets 2 and 3 are best for finding these entries.
Booms are signalled with this explosive icon: 💥
Simply put booms are polarity flips within the ticker signal. They are fast and explosive moves that can be detected using several different methods. Some of these boom signals are picked up using pure chart mechanics while others use filtering and signal processing to pinpoint the exact moment before an explosion. To make big moves the charts have to set it up first. Below is an example on a daily chart.
Boom Hunter X comes with the following alerts:
Overbought - Reversal attempt
Oversold - Reversal attempt
Long First Pullback - Only available on Preset 2 and 3
Short First Pullback - Only available on Preset 2 and 3
Pivot Up - Oscillator crosses over trigger
Pivot Down - Oscillator crosses under trigger
Long Breakout - Entry point for breakout
Short Breakout - Entry point for breakout
Break Support - Price action breaks its support
Break Resistance - Price action breaks its resistance
Boom! - Alerts for all the booms
Crossing Over Median - Price action enters top half of channel
Crossing Under Median - Price action enters bottom half of channel

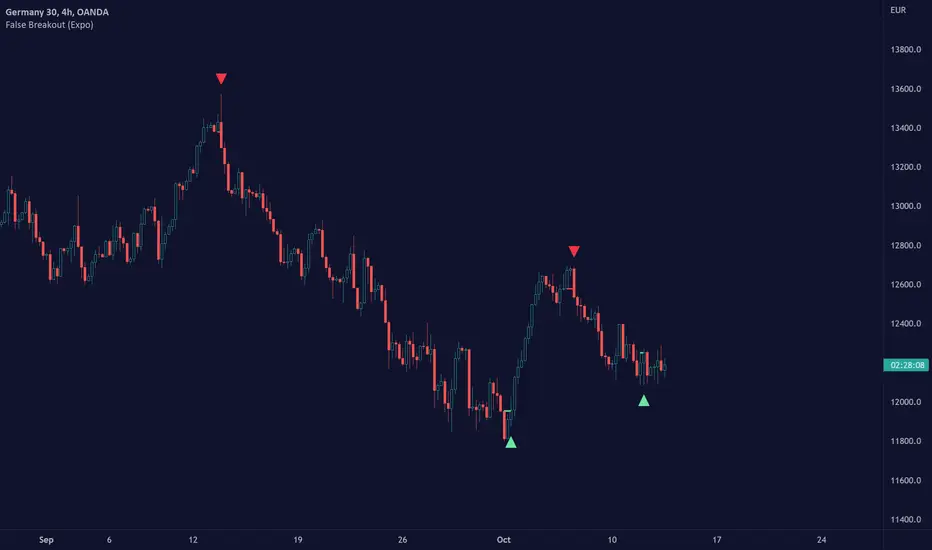
False Breakout (Expo)█ Overview
False Breakout (Expo) is an indicator that detects false breakouts in real-time. A false breakout occurs when the price moves through a certain level but doesn't continue to accelerate in that direction. This is because the price does not have enough momentum and the buying interest at this level is not high enough to keep pushing the price in that direction. Instead, the market reverses! All breakout traders are now forced to close their positions at a loss. However, contrarian traders that have identified this false breakout do get a perfect entry for a great reversal trade!
False Breakout is one of the most important price action trading patterns to learn because it can help traders understand whether a breakout is valid or false.
█ How to use
Identify False Breakouts
Identify Reversal trades
-----------------
Disclaimer
The information contained in my Scripts/Indicators/Ideas/Algos/Systems does not constitute financial advice or a solicitation to buy or sell any securities of any type. I will not accept liability for any loss or damage, including without limitation any loss of profit, which may arise directly or indirectly from the use of or reliance on such information.
All investments involve risk, and the past performance of a security, industry, sector, market, financial product, trading strategy, backtest, or individual's trading does not guarantee future results or returns. Investors are fully responsible for any investment decisions they make. Such decisions should be based solely on an evaluation of their financial circumstances, investment objectives, risk tolerance, and liquidity needs.
My Scripts/Indicators/Ideas/Algos/Systems are only for educational purposes!
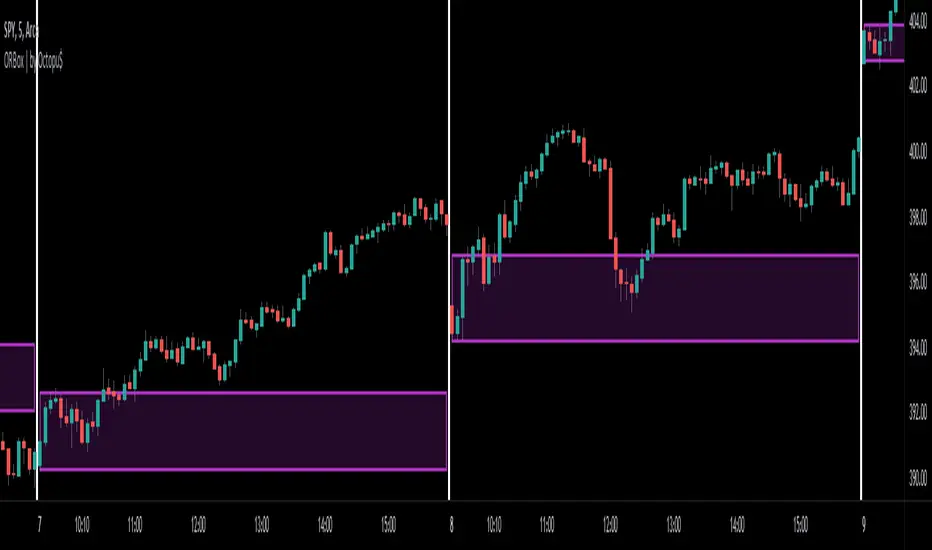
ORBox | by Octopu$📈 ORBox | by Octopu$
ORBox is a Box for the Opening Range Breakout
The Box is added automatically according to the User preferences through GUI
This Indicator includes a Dropdown selection for which Range for the Breakout you want to use
ORBox has built-in Alerts for when the Breakout happens according to your preferences
Works in any Timeframe with any Ticker
(Using SPY 5m just as an example:)
www.tradingview.com
SPY
Features:
• Opening Breakout Range (ORB)
• Dropdown menu selection to choose which TF to watch
• Built-in Alerts for Momentum Awareness
Options:
• Customization for Box Colors and Sizes
• Display ORB for Current Day or Previous
Notes:
v1.0
ORBox Indicator release
Changes and updates can come in the future for additional functionalities or per requests.
Did you like it? Shoot me a message! I'd appreciate if you dropped by to say thanks.
- Octopu$
🐙
SBS AlgoHello traders, I am here again with a new and improved indicator.
This indicator is based on a pivot breakout algorithm which gives buy and sell signals according to the breakout of trendline. This is an advanced version of another script. It also takes price action into consideration along with some basic indicators like MACD and ADX to give good entry signals.
NOTE: This indicator is not designed to take entries completely based on signals it gives. Please use it along with your trading strategy to add more confluence to your trading system and maximize your profits.
I hope you guys will like this one too .Enjoy 👍
In case you find any bug, please do report in comment section .Thank you.

Pre Market \ Opening Range High LowGreen vertical lines are showing pre market open and then the opening range as the first hour of market NYSE market open
Pre market high and low are blue lines | intraday opening range high low are in white
Trades are taken in the current direction above | below range breaks with the direction of price action using the moving averages
Price breaking through moving averages and a range is the optimal trade to enter - exit at next range for target - stop loss below the lower | higher moving average depending on short or long
A break above or below the intraday high or low and pre market high or low can give massive profits trailing your stop loss as price runs
Using MA 5 and 12 to filter out entries and exits above or below the ranges short or long is also another strategy to implement
BEST TIME FRAME TO USE IS 5 MINUTE
