Nirvana True Duel전략 이름
열반의 진검승부 (영문: Nirvana True Duel)
컨셉과 철학
“열반의 진검승부”는 시장 소음은 무시하고, 확실할 때만 진입하는 전략입니다.
EMA 리본으로 추세 방향을 확인하고, 볼린저 밴드 수축/확장으로 변동성 돌파를 포착하며, OBV로 거래량 확인을 통해 가짜 돌파를 필터링합니다.
전략 로직
매수 조건 (롱)
20EMA > 50EMA (상승 추세)
밴드폭 수축 후 확장 시작
종가가 상단 밴드 돌파
OBV 상승 흐름 유지
매도 조건 (숏)
20EMA < 50EMA (하락 추세)
밴드폭 수축 후 확장 시작
종가가 하단 밴드 이탈
OBV 하락 흐름 유지
진입·청산
손절: ATR × 1.5 배수
익절: 손절폭의 1.5~2배에서 부분 청산
시간 청산: 설정한 최대 보유 봉수 초과 시 강제 청산
장점
✅ 추세·변동성·거래량 3중 필터 → 노이즈 최소화
✅ 백테스트·알람 지원 → 기계적 매매 가능
✅ 5분/15분 차트에 적합 → 단타/스윙 트레이딩 활용 가능
주의점
⚠ 횡보장에서는 신호가 적거나 실패 가능
⚠ 수수료·슬리피지 고려 필요
📜 Nirvana True Duel — Strategy Description (English)
Name:
Nirvana True Duel (a.k.a. Nirvana Cross)
Concept & Philosophy
The “Nirvana True Duel” strategy focuses on trading only meaningful breakouts and avoiding unnecessary noise.
Nirvana: A calm, patient state — waiting for the right opportunity without emotional trading.
True Duel: When the signal appears, enter decisively and let the market reveal the outcome.
In short: “Ignore market noise, trade only high-probability breakouts.”
🧩 Strategy Components
Trend Filter (EMA Ribbon): Stay aligned with the main market trend.
Volatility Squeeze (Bollinger Band): Detect volatility contraction & expansion to catch explosive moves early.
Volume Confirmation (OBV): Filter out false breakouts by confirming with volume flow.
⚔️ Entry & Exit Conditions
Long Setup:
20 EMA > 50 EMA (uptrend)
BB width breaks out from recent squeeze
Close > Upper Bollinger Band
OBV shows positive flow
Short Setup:
20 EMA < 50 EMA (downtrend)
BB width breaks out from recent squeeze
Close < Lower Bollinger Band
OBV shows negative flow
Risk Management:
Stop Loss: ATR × 1.5 below/above entry
Take Profit: 1.5–2× stop distance, partial take-profit allowed
Time Stop: Automatically closes after max bars held (e.g. 8h on 5m chart)
✅ Strengths
Triple Filtering: Trend + Volatility + Volume → fewer false signals
Mechanical & Backtestable: Ideal for objective trading & performance validation
Adaptable: Works well on Bitcoin, Nasdaq futures, and other high-volatility markets (5m/15m)
⚠️ Things to Note
Low signal frequency or higher failure rate in sideways/range markets
Commission & slippage should be factored in, especially on lower timeframes
ATR multiplier and R:R ratio should be optimized per asset
Breakout!

Volume Profile Auto POC📌 Overview
Volume Profile Auto POC is a trend-following strategy that uses the automatically calculated Point of Control (POC) from the volume profile, combined with ATR zones, to capture reversals and breakouts.
By basing decisions on volume concentration, it dynamically visualizes the price levels most watched by market participants.
⚠️ This strategy is provided for educational and research purposes only.
Past performance does not guarantee future results.
🎯 Strategy Objectives
Automatically detect the volume concentration area (POC) to improve entry accuracy
Optimize risk management through ATR-based volatility adjustment
Provide early and consistent signals when trends emerge
✨ Key Features
Automatic POC Detection : Updates the volume profile over a defined lookback window in real time
ATR Zone Integration : Defines a POC ± 0.5 ATR zone to clarify potential reversals/breakouts
Visual Support : Plots the POC line and zones on the chart for intuitive decision-making
📊 Trading Rules
Long Entry:
Price breaks above the POC + 0.5 ATR zone
Volume is above average to support the breakout
Short Entry:
Price breaks below the POC - 0.5 ATR zone
Volume is above average to support the downside move
Exit (or Reverse Position):
Price returns to the POC area
Or touches the ATR band
⚙️ Trading Parameters & Considerations
Indicator Name: Volume Profile Auto POC
Parameters:
Lookback Bars: 50
Bins for Volume Profile: 24
ATR Length: 14
ATR Multiplier: 2.0
🖼 Visual Support
POC line plotted in red
POC ± 0.5 ATR zone displayed as a semi-transparent box
ATR bands plotted in blue for confirmation
🔧 Strategy Improvements & Uniqueness
This strategy is inspired by traditional Volume Profile + ATR analysis,
while adding the improvement of a sliding-window mechanism for automatic POC updates.
Compared with conventional trend-following approaches,
its strength lies in combining both price and volume perspectives for decision-making.
✅ Summary
Volume Profile Auto POC automatically extracts key market levels (POC) and combines them with ATR-based zones,
providing a responsive trend-following method.
It balances clarity with practicality, aiming for both usability and reproducibility.
⚠️ This strategy is based on historical data and does not guarantee future profits.
Always use proper risk management when applying it.

Tristan's Box: Pre-Market Range Breakout + RetestMarket Context:
This is designed for U.S. stocks, focusing on pre-market price action (4:00–9:30 AM ET) to identify key support/resistance levels before the regular session opens.
Built for 1 min and 5 min timelines, and is intended for day trading / scalping.
Core Idea:
Pre-market range (high/low) often acts as a magnet for price during regular hours.
The first breakout outside this range signals potential strong momentum in that direction.
Retest of the breakout level confirms whether the breakout is valid, avoiding false moves.
Step-by-Step Logic:
Pre-Market Range Identification:
Track high and low from 4:00–9:30 AM ET.
Draw a box spanning this range for visual reference and calculation.
Breakout Detection:
When the first candle closes above the pre-market high → long breakout.
When the first candle closes below the pre-market low → short breakout.
The first breakout candle is highlighted with a “YOLO” label for visual confirmation.
Retest Confirmation:
Identify the first candle whose wick touches the pre-market box (high touches top for short, low touches bottom for long).
Wait for the next candle: if it closes outside the box, it confirms the breakout.
Entry Execution:
Long entry: on the confirming candle after a wick-touch above the pre-market high.
Short entry: on the confirming candle after a wick-touch below the pre-market low.
Only the first valid entry per direction per day is taken.
Visuals & Alerts:
Box represents pre-market high/low.
Top/bottom box border lines show the pre-market high / low levels cleanly.
BUY/SELL markers are pinned to the confirming candle.
Added a "YOLO" marker on breakout candle.
Alert conditions trigger when a breakout is confirmed by the retest.
Strategy Type:
Momentum breakout strategy with confirmation retest.
Combines pre-market structure and risk-managed entries.
Designed to filter false breakouts by requiring confirmation on the candle after the wick-touch.
In short, it’s a pre-market breakout momentum strategy: it uses the pre-market high/low as reference, waits for a breakout, and then enters only after a confirmation retest, reducing the chance of entering on a false spike.
Always use good risk management.

Advanced Range Analyzer ProAdvanced Range Analyzer Pro – Adaptive Range Detection & Breakout Forecasting
Overview
Advanced Range Analyzer Pro is a comprehensive trading tool designed to help traders identify consolidations, evaluate their strength, and forecast potential breakout direction. By combining volatility-adjusted thresholds, volume distribution analysis, and historical breakout behavior, the indicator builds an adaptive framework for navigating sideways price action. Instead of treating ranges as noise, this system transforms them into opportunities for mean reversion or breakout trading.
How It Works
The indicator continuously scans price action to identify active range environments. Ranges are defined by volatility compression, repeated boundary interactions, and clustering of volume near equilibrium. Once detected, the indicator assigns a strength score (0–100), which quantifies how well-defined and compressed the consolidation is.
Breakout probabilities are then calculated by factoring in:
Relative time spent near the upper vs. lower range boundaries
Historical breakout tendencies for similar structures
Volume distribution inside the range
Momentum alignment using auxiliary filters (RSI/MACD)
This creates a live probability forecast that updates as price evolves. The tool also supports range memory, allowing traders to analyze the last completed range after a breakout has occurred. A dynamic strength meter is displayed directly above each consolidation range, providing real-time insight into range compression and breakout potential.
Signals and Breakouts
Advanced Range Analyzer Pro includes a structured set of visual tools to highlight actionable conditions:
Range Zones – Gradient-filled boxes highlight active consolidations.
Strength Meter – A live score displayed in the dashboard quantifies compression.
Breakout Labels – Probability percentages show bias toward bullish or bearish continuation.
Breakout Highlights – When a breakout occurs, the range is marked with directional confirmation.
Dashboard Table – Displays current status, strength, live/last range mode, and probabilities.
These elements update in real time, ensuring that traders always see the current state of consolidation and breakout risk.
Interpretation
Range Strength : High scores (70–100) indicate strong consolidations likely to resolve explosively, while low scores suggest weak or choppy ranges prone to false signals.
Breakout Probability : Directional bias greater than 60% suggests meaningful breakout pressure. Equal probabilities indicate balanced compression, favoring mean-reversion strategies.
Market Context : Ranges aligned with higher timeframe trends often resolve in the dominant direction, while counter-trend ranges may lead to reversals or liquidity sweeps.
Volatility Insight : Tight ranges with low ATR imply imminent expansion; wide ranges signal extended consolidation or distribution phases.
Strategy Integration
Advanced Range Analyzer Pro can be applied across multiple trading styles:
Breakout Trading : Enter on probability shifts above 60% with confirmation of volume or momentum.
Mean Reversion : Trade inside ranges with high strength scores by fading boundaries and targeting equilibrium.
Trend Continuation : Focus on ranges that form mid-trend, anticipating continuation after consolidation.
Liquidity Sweeps : Use failed breakouts at boundaries to capture reversals.
Multi-Timeframe : Apply on higher timeframes to frame market context, then execute on lower timeframes.
Advanced Techniques
Combine with volume profiles to identify areas of institutional positioning within ranges.
Track sequences of strong consolidations for trend development or exhaustion signals.
Use breakout probability shifts in conjunction with order flow or momentum indicators to refine entries.
Monitor expanding/contracting range widths to anticipate volatility cycles.
Custom parameters allow fine-tuning sensitivity for different assets (crypto, forex, equities) and trading styles (scalping, intraday, swing).
Inputs and Customization
Range Detection Sensitivity : Controls how strictly ranges are defined.
Strength Score Settings : Adjust weighting of compression, volume, and breakout memory.
Probability Forecasting : Enable/disable directional bias and thresholds.
Gradient & Fill Options : Customize range visualization colors and opacity.
Dashboard Display : Toggle live vs last range, info table size, and position.
Breakout Highlighting : Choose border/zone emphasis on breakout events.
Why Use Advanced Range Analyzer Pro
This indicator provides a data-driven approach to trading consolidation phases, one of the most common yet underutilized market states. By quantifying range strength, mapping probability forecasts, and visually presenting risk zones, it transforms uncertainty into clarity.
Whether you’re trading breakouts, fading ranges, or mapping higher timeframe context, Advanced Range Analyzer Pro delivers a structured, adaptive framework that integrates seamlessly into multiple strategies.

Anchorman - EMA Channel + EMA + MTF Status Table PRICE BREAKOUTUses a high/low EMA Channel to tell you when strong price breakouts are happening plus comes with a EMA to help follow the trend if you like. I designed it so it can alert you when a single TF touch happens or a breakout alignment on MTF happens (I recommend this) its up to you also its single alert so no need to do bullish or bearish signals just one signal will alert you when a breakout happens in EITHER direction.

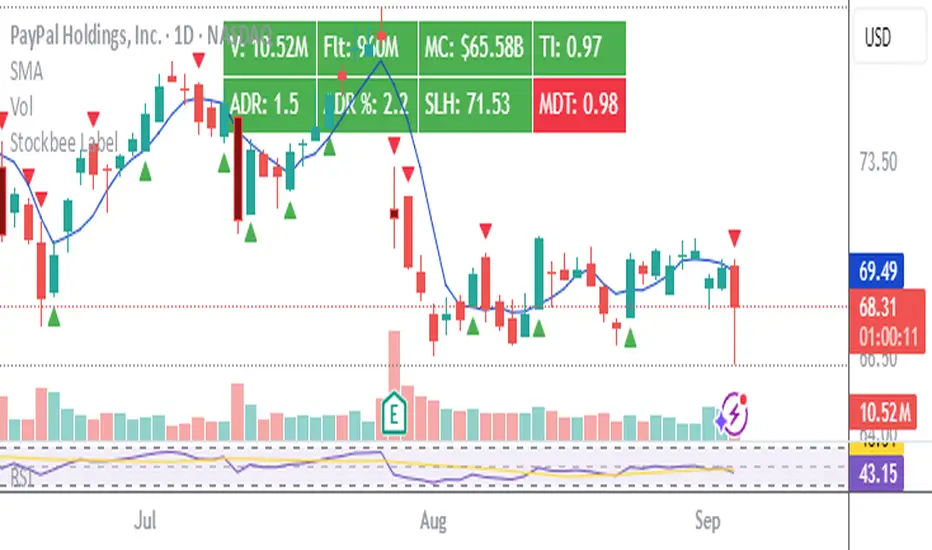
Stockbee LabelUnlock the full potential of your TradingView charts with this powerful indicator designed specifically for Stockbee methods. Instantly gain key market insights at a glance with a sleek, easy-to-read label displayed on your chart. This dynamic label provides critical data including Volume, Total Float, Market Capitalization, Trend Intensity, Average Daily Range (ADR), Half-Day Stop Loss level, and Modified Double Trouble (MDT) .
Elevate your trading strategy with real-time, essential metrics all in one place—streamlining your decision-making and boosting your confidence in the market.
Disclaimer: This indicator is inspired by and built upon the original concepts of Stockbee and EG.
Volumetric Support and Resistance [BackQuant]Volumetric Support and Resistance
What this is
This Overlay locates price levels where both structure and participation have been meaningful. It combines classical swing points with a volume filter, then manages those levels on the chart as price evolves. Each level carries:
• A reference price (support or resistance)
• An estimate of the volume that traded around that price
• A touch counter that updates when price retests it
• A visual box whose thickness is scaled by volatility
The result is a concise map of candidate support and resistance that is informed by both price location and how much trading occurred there.
How levels are built
Find structural pivots uses ta.pivothigh and ta.pivotlow with a user set sensitivity. Larger sensitivity looks for broader swings. Smaller sensitivity captures tighter turns.
Require meaningful volume computes an average volume over a lookback period and forms a volume ratio for the current bar. A pivot only becomes a level when the ratio is at least the volume significance multiplier.
Avoid clustering checks a minimum level distance (as a percent of price). If a candidate is too close to an existing level, it is skipped to keep the map readable.
Attach a volume strength to the level estimates volume strength by averaging the volume of recent bars whose high to low range spans that price. Levels with unusually high strength are flagged as high volume.
Store and draw levels are kept in an array with fields for price, type, volume, touches, creation bar, and a box handle. On the last bar, each level is drawn as a horizontal box centered at the price with a vertical thickness scaled by ATR. Borders are thicker when the level is marked high volume. Boxes can extend into the future.
How levels evolve over time
• Aging and pruning : levels are removed if they are too old relative to the lookback or if you exceed the maximum active levels.
• Break detection : a level can be removed when price closes through it by more than a break threshold set as a fraction of ATR. Toggle with Remove Broken Levels.
• Touches : when price approaches within the break threshold, the level’s touch counter increments.
Visual encoding
• Boxes : support boxes are green, resistance boxes are red. Box height uses an ATR based thickness so tolerance scales with volatility. Transparency is fixed in this version. Borders are thicker on high volume levels.
• Volume annotation : show the estimated volume inside the box or as a label at the right. If a level has more than one touch, a suffix like “(2x)” is appended.
• Extension : boxes can extend a fixed number of bars into the future and can be set to extend right.
• High volume bar tint : bars with volume above average × multiplier are tinted green if up and red if down.
Inputs at a glance
Core Settings
• Level Detection Sensitivity — pivot window for swing detection
• Volume Significance Multiplier — minimum volume ratio to accept a pivot
• Lookback Period — window for average volume and maintenance rules
Level Management
• Maximum Active Levels — cap on concurrently drawn levels
• Minimum Level Distance (%) — required spacing between level prices
Visual Settings
• Remove Broken Levels — drop a level once price closes decisively through it
• Show Volume Information on Levels — annotate volume and touches
• Extend Levels to Right — carry boxes forward
Enhanced Visual Settings
• Show Volume Text Inside Box — text placement option
• Volume Based Transparency and Volume Based Border Thickness — helper logic provided; current draw block fixes transparency and increases border width on high volume levels
Colors
• Separate colors for support, resistance, and their high volume variants
How it can be used
• Trade planning : use the most recent support and resistance as reference zones for entries, profit taking, or stop placement. ATR scaled thickness provides a practical buffer.
• Context for patterns : combine with breakouts, pullbacks, or candle patterns. A breakout through a high volume resistance carries more informational weight than one through a thin level.
• Prioritization : when multiple levels are nearby, prefer high volume or higher touch counts.
• Regime adaptation : widen sensitivity and increase minimum distance in fast regimes to avoid clutter. Tighten them in calm regimes to capture more granularity.
Why volume support and resistance is used in trading
Support and resistance relate to willingness to transact at certain prices. Volume measures participation. When many contracts change hands near a price:
• More market players hold inventory there, often creating responsive behavior on retests
• Order flow can concentrate again to defend or to exit
• Breaks can be cleaner as trapped inventory rebalances
Conditioning level detection on above average activity focuses attention on prices that mattered to more participants.
Alerts
• New Support Level Created
• New Resistance Level Created
• Level Touch Alert
• Level Break Alert
Strengths
• Dual filter of structure and participation, reducing trivial swing points
• Self cleaning map that retires old or invalid levels
• Volatility aware presentation using ATR based thickness
• Touch counting for persistence assessment
• Tunable inputs for instrument and timeframe
Limitations and caveats
• Volume strength is an approximation based on bars spanning the price, not true per price volume
• Pivots confirm after the sensitivity window completes, so new levels appear with a delay
• Narrow ranges can still cluster levels unless minimum distance is increased
• Large gaps may jump past levels and immediately trigger break conditions
Practical tuning guide
• If the chart is crowded: increase sensitivity, increase minimum level distance, or reduce maximum active levels
• If useful levels are missed: reduce volume multiplier or sensitivity
• If you want stricter break removal: increase the ATR based break threshold in code
• For instruments with session patterns: tailor the lookback period to a representative window
Interpreting touches and breaks
• First touch after creation is a validation test
• Multiple shallow touches suggest absorption; a later break may then travel farther
• Breaks on high current volume merit extra attention
Multi timeframe usage
Levels are computed on the active chart timeframe. A common workflow is to keep a higher timeframe instance for structure and a lower timeframe instance for execution. Align trades with higher timeframe levels where possible.
Final Thoughts
This indicator builds a lightweight, self updating map of support and resistance grounded in swings and participation. It is not a full market profile, but it captures much of the practical benefit with modest complexity. Treat levels as context and decision zones, not guarantees. Combine with your entry logic and risk controls.

Long Elite Squeeze (LES) — H.H 22 Lindsay (AI)LES (Long Elite Squeeze)
LES (Long Elite Squeeze) is a trading framework designed to capture the highest-probability long setups. It’s not just another signal script — it’s a structured system built to filter noise, manage risk, and keep you aligned with real momentum.
🔹 Core Logic
Breakout Confirmation – Ensures moves have structure, not just random spikes.
Relative Volume (RVOL) – Confirms participation and fuel behind the move.
RSI Alignment – Avoids overextended traps and fakeouts.
Squeeze Momentum – The backbone of LES. Signals fire only after a defined squeeze pattern shift (6+ dark green bars followed by a light green bar).
🔹 Trade Management Built In
Automated Sell Signals – Trigger on either:
2 consecutive dark green bars on Squeeze Momentum
WaveTrend cross down
(only valid after a Buy signal — no random shorts)
HUD Entry Checklist – Live conditions shown on chart.
Status Tracker HUD – Flips between “Waiting for Entry” and “In Trade” for clear context.
🔹 Flexibility
3 switchable squeeze versions (V1, V2, V3) for different market conditions.
Customizable EMA & ATR settings (with color options).
Session-aware logic — filter signals to prime trading hours.
🔹 Blueprint & Credits
LES is a fusion of proven concepts, standing on the shoulders of respected creators:
-Squeeze Momentum – LazyBear
-WaveTrend Oscillator – LazyBear
-Relative Volume – LonesomeTheBlue
Breakout/structural logic – refined from classic frameworks
Their work laid the foundation — LES expands and integrates them into a complete trading system.
⚡ Why LES Stands Out
LES wasn’t coded overnight. It’s the result of countless hours of live testing, rebuilding, and refining. Every feature earned its place by proving value in real trading, not theory.
LES is more than an indicator. It’s a disciplined framework — crafted to turn chaos into structure, randomness into probability, and noise into clarity.
⚠️ Disclaimer: This is a trading framework, not financial advice. Performance depends on trader discipline, risk management, and market conditions.

Open Range Breakout Strategy With Multi TakeProfitHello everyone,
For a while, I’ve been wanting to develop new scripts, but I couldn’t decide what to create. Eventually, I came up with the idea of coding traditional and well-known trading strategies—while adding modern features such as multi–take profit options. For the first strategy in this series, I chose the Open Range Strategy .
For those unfamiliar with it, the Open Range Strategy is a trading approach where you define a specific time period at the beginning of a trading session—such as the first 15 minutes, 30 minutes, or 1 hour—and mark the highest and lowest prices within that range. These levels then act as reference points for potential breakouts: if the price breaks above the range, it may signal a long entry; if it breaks below, it may indicate a short entry. This method is popular among day traders for capturing early momentum in the market.
Since this strategy is generally used as an intraday strategy , I added a Trade Session feature. This allows you to define the exact time window during which trades can be opened. Once the session ends, all positions are automatically closed, ensuring trades remain within your chosen intraday period.
Even though it’s a relatively simple concept, I’ve come across many different variations of it. That’s why I created a highly customizable project. Under the Session Settings, you can select the time window you want to define as your range. Whether it’s the first 15-minute candle or the entire first hour, the choice is entirely yours.
For stop-loss placement, there are two different options:
Middle of the Range – The stop loss is placed at the midpoint between the high and low of the defined range, offering a balanced buffer for both bullish and bearish setups.
Top/Bottom of the Range – The stop loss is placed just beyond the range’s high for short trades or just below the range’s low for long trades, providing a more conservative risk approach.
I’ve always been a big fan of the multi take-profit feature, so I added two different take-profit targets to this project. Take profits are calculated based on a Risk-to-Reward Ratio, which you can adjust in the settings. You can also set different position sizes for each target, allowing you to scale out of trades in a way that suits your strategy.
The result is a flexible, user-friendly strategy script that brings together a classic approach with modern risk management tools—ready to be tailored to your trading style

DTLLC Time & PriceDTLLC Time and Price with Signals
This indicator is built for traders who understand ICT concepts and want a structured, visual way to align time-based price action with key market levels. By combining customizable trading windows, breakout logic, and daily reference points, it helps you identify high-probability trade opportunities while filtering out market noise.
Key Features
1. Dual Custom Time Ranges (Kill Zones)
Set two independent time ranges per day (start/end hour and minute).
Each range identifies the highest high and lowest low within its window.
Built-in breakout detection generates buy/sell signals when price moves beyond these levels.
2. Volatility Filtering
Adjustable volatility threshold based on True Range relative to ATR.
Filters out low-quality signals during choppy, low-volatility conditions.
3. ATR-Based Stop Loss
Custom ATR length and stop-loss multiplier settings.
Automatically plots ATR-based stop levels for triggered trades.
4. Daily Key Levels
Plots Previous Day High, Previous Day Low, and Midnight Open continuously on the chart.
Useful for spotting breakout and reversal opportunities in line with ICT market structure concepts.
5. Liquidity & Engulfing Candle Highlights
Highlights potential liquidity grab zones (yellow candles) when significant highs/lows are set within your lookback period.
Detects bullish (green) and bearish (red) engulfing patterns for added confluence.
6. Visual & Signal Tools
Buy/Sell signals plotted directly on chart (separate colors for Range 1 and Range 2). Continuous plotting of reference levels to maintain market context throughout the session.
Example Use Case:
A common ICT-inspired reversal setup:
Wait for price to sweep the Previous Day’s High or Low during your chosen time range.
Look for a buy or sell signal with volatility confirmation.
Manage risk using the ATR-based stop-loss plot.
Disclaimer: This script is for educational purposes only and is not financial advice. Trade responsibly and always test strategies before applying them in live markets.

Recent Range DetectorOverview
The Recent Range Detector is a specialized indicator designed to identify when an asset is currently range-bound, providing traders with clear support and resistance levels for range trading strategies. Unlike traditional indicators that focus on trend detection, this tool specifically answers the question: "Is the price range-bound right now, and what are the exact trading levels?"
Key Features
✅ Smart Range Detection - Uses a multi-factor scoring system to identify legitimate ranges
✅ Dynamic Support/Resistance Levels - Automatically calculates and displays key trading levels
✅ Range Quality Scoring - Provides confidence levels (Strong/Moderate/Weak Range)
✅ Touch Validation - Counts actual price touches to confirm range reliability
✅ Breakout Detection - Alerts when price exits the established range
✅ Visual Clarity - Clean boxes, lines, and labels for easy interpretation
How It Works
The indicator analyses recent price action using three core metrics:
Touch Quality (40%) - How many times price has respected support/resistance levels
Containment Quality (40%) - What percentage of recent bars stayed within the range
Recent Respect (20%) - Whether the latest price action confirms the range
These combine into a Range Score (0-1) that determines range strength and reliability.
Settings & Parameters
Range Lookback Period (Default: 15)
Number of bars to analyse for range detection
Shorter periods = more responsive to recent ranges
Longer periods = more stable, fewer false signals
Range Tolerance (Default: 2.0%)
Tolerance for price touches around exact highs/lows
Lower values = stricter range requirements
Higher values = more flexible range detection
Minimum Touches (Default: 3)
Required number of support/resistance touches for valid range
Higher values = more confirmed ranges, fewer signals
Lower values = more sensitive, earlier detection
Visual Options
Show Range Box: Displays the range boundaries
Show Support/Resistance Lines: Extends levels into the future
Understanding the Output
Range Score (0.000 - 1.000)
0.7+ = Strong Range (Green) - High confidence range trading setup
0.5-0.7 = Moderate Range (Yellow) - Decent range with some caution
0.3-0.5 = Weak Range (Orange) - Low confidence, be careful
<0.3 = Not Ranging - Avoid range trading strategies
Range Status Classifications
Strong Range - Perfect for range trading strategies
Moderate Range - Good range with normal risk
Weak Range - Marginal range, use smaller positions
Not Ranging - Price is trending or too choppy for range trading
Key Metrics in Info Table
Range Size (%) - Size of the range relative to price level
5-15% = Ideal range size for most strategies
<5% = Tight range, lower profit potential
>15% = Wide range, higher profit potential but more risk
Support/Resistance Levels - Exact price levels for entries/exits
Use these as your key trading levels
Support = potential buy zone
Resistance = potential sell zone
Total Touches - Number of times price respected the levels
3-5 touches = Newly formed range
6-10 touches = Well-established range
10+ touches = Very strong, reliable range
Price Position (%) - Current location within the range
0-20% = Near support (potential long opportunity)
80-100% = Near resistance (potential short opportunity)
40-60% = Middle of range (wait for better entry)
Visual Elements
Range Box
Green Box = Strong Range (Score ≥ 0.7)
Yellow Box = Moderate Range (Score 0.5-0.7)
Orange Box = Weak Range (Score 0.3-0.5)
Support/Resistance Lines
- Horizontal lines showing exact trading levels
- Extend into the future for forward guidance
- Colour matches the range strength
Background Colouring
- Subtle background tint during range periods
- Helps quickly identify ranging vs trending markets
Breakout Signals
- 📈 RANGE BREAK UP - Price breaks above resistance
- 📉 RANGE BREAK DOWN - Price breaks below support
- Only appears for confirmed ranges (Score ≥ 0.5)
Trading Applications
Range Trading Strategy
1. Look for Range Score ≥ 0.5
2. Buy near support (Price Position 0-20%)
3. Sell near resistance (Price Position 80-100%)
4. Set stops just outside the range
5. Exit on breakout signals
Breakout Strategy
1. Identify strong ranges (Score ≥ 0.7)
2. Wait for volume-confirmed breakout
3. Enter in breakout direction
4. Use previous resistance as support (or vice versa)
Market Context
- Strong ranges often occur after trending moves
- Use higher timeframes to confirm overall market structure
- Combine with volume analysis for better entries/exits
Best Practices
What to Look For
✅ Range Score ≥ 0.5 for trading consideration
✅ Multiple touches (5+) for confirmation
✅ Clear price rejection at levels
✅ Reasonable range size (5-15% for most assets)
✅ Recent price respect of boundaries
What to Avoid
❌ Trading ranges with Score < 0.3
❌ Very tight ranges (<3% size) - low profit potential
❌ Ranges with only 1-2 touches - not confirmed
❌ Ignoring breakout signals
❌ Trading against the higher timeframe trend
Alerts Available
- Range Detected - New range formation
- Range Break Up - Upward breakout
- Range Break Down - Downward breakout
- Range Ended - Range condition ended
Timeframe Recommendations
- Daily Charts - Best for swing trading ranges
- 4H Charts - Good for intermediate-term ranges
- 1H Charts - Suitable for day trading ranges
- Lower Timeframes - May produce more noise
Conclusion
The Recent Range Detector eliminates guesswork in range identification by providing objective, quantified range analysis. It's particularly valuable for traders who prefer range-bound strategies or need to identify when trending strategies should be avoided.
Remember: No indicator is perfect. Always combine with proper risk management, volume analysis, and broader market context for best results.
Disclaimer
This indicator is for educational purposes only and should not be considered as financial advice. Trading involves risk, and past performance does not guarantee future results. Always conduct your own research and consider your risk tolerance before making any trading decisions.

CP Strat ORBnew york opening range breakout and retest allows you to enter a trade with a better clarity if the price comes back and retest the range

Zero Lag Liquidity [AlgoAlpha]🟠 OVERVIEW
This script plots liquidity zones with zero lag using lower-timeframe wick profiles and high-volume wicks to mark key price reactions. It’s called Zero Lag Liquidity because it captures significant liquidity imbalances in real time by processing lower-TF price-volume distributions directly inside the wick of abnormal candles. The tool builds a volume histogram inside long upper/lower wicks, then calculates a local Point of Control (POC) to mark the price where most volume occurred. These levels act as visual liquidity zones, which can trigger labels, break signals, and trend detection depending on price interaction.
🟠 CONCEPTS
The core concept relies on identifying high-volume candles with unusually long wicks—often a sign of opposing liquidity. When a large upper or lower wick appears with a strong volume spike, the script builds a histogram of lower-timeframe closes and volumes inside that wick. It bins the wick into segments, sums volume per bin, and finds the POC. This POC becomes the liquidity level. The script then dynamically tracks whether price breaks above or rejects off these levels, adjusts the active trend regime accordingly, and highlights bars to help users spot continuation or reversal behavior. The logic avoids repainting or subjective interpretation by using fixed thresholds and lower-TF price action.
🟠 FEATURES
Dynamic liquidity levels rendered at POC of significant wicks, colored by bullish/bearish direction.
Break detection that removes levels once price decisively crosses them twice in the same direction.
Rejection detection that plots ▲/▼ markers when price bounces off levels intrabar.
Volume labels for each level, shown either as raw volume or percentage of total level volume.
Candle coloring based on trend direction (break-dominant).
🟠 USAGE
Use this indicator to track where liquidity has most likely entered the market via abnormal wick events. When a long wick forms with high volume, the script looks inside it (using your chosen lower timeframe) and marks the most traded price within it. These levels can serve as expected reversal or breakout zones. Rejections are marked with small arrows, while breaks trigger trend shifts and remove the level. You can toggle trend coloring to see directional bias after a breakout. Use the wick multiplier to control how selective the detector is (higher = stricter). Alerts and label modes help customize the signal for different asset types and chart styles.

Moving Average Volume (20, 50)Shows two moving averages of volume, the 20 and 50 periods.
white bars in the background show volume, look for breaks of the target lines to confirm a breakout with volume
green shaded regions show how much higher the current volume is compared to historical volume
the greener the shade, the higher the multiple is (cap is 10x higher)
indicator is to be used with other breakout identifiers, or to help confirm the strength of a move out of an SAR level.

Squeeze Momentum Regression Clouds [SciQua]╭──────────────────────────────────────────────╮
☁️ Squeeze Momentum Regression Clouds
╰──────────────────────────────────────────────╯
🔍 Overview
The Squeeze Momentum Regression Clouds (SMRC) indicator is a powerful visual tool for identifying price compression , trend strength , and slope momentum using multiple layers of linear regression Clouds. Designed to extend the classic squeeze framework, this indicator captures the behavior of price through dynamic slope detection, percentile-based spread analytics, and an optional UI for trend inspection — across up to four customizable regression Clouds .
────────────────────────────────────────────────────────────
╭────────────────╮
⚙️ Core Features
╰────────────────╯
Up to 4 Regression Clouds – Each Cloud is created from a top and bottom linear regression line over a configurable lookback window.
Slope Detection Engine – Identifies whether each band is rising, falling, or flat based on slope-to-ATR thresholds.
Spread Compression Heatmap – Highlights compressed zones using yellow intensity, derived from historical spread analysis.
Composite Trend Scoring – Aggregates directional signals from each Cloud using your chosen weighting model.
Color-Coded Candles – Optional candle coloring reflects the real-time composite score.
UI Table – A toggleable info table shows slopes, compression levels, percentile ranks, and direction scores for each Cloud.
Gradient Cloud Styling – Apply gradient coloring from Cloud 1 to Cloud 4 for visual slope intensity.
Weight Aggregation Options – Use equal weighting, inverse-length weighting, or max pooling across Clouds to determine composite trend strength.
────────────────────────────────────────────────────────────
╭──────────────────────────────────────────╮
🧪 How to Use the Indicator
1. Understand Trend Bias with Cloud Colors
╰──────────────────────────────────────────╯
Each Cloud changes color based on its current slope:
Green indicates a rising trend.
Red indicates a falling trend.
Gray indicates a flat slope — often seen during chop or transitions.
Cloud 1 typically reflects short-term structure, while Cloud 4 represents long-term directional bias. Watch for multi-Cloud alignment — when all Clouds are green or red, the trend is strong. Divergence among Clouds often signals a potential shift.
────────────────────────────────────────────────────────────
╭───────────────────────────────────────────────╮
2. Use Compression Heat to Anticipate Breakouts
╰───────────────────────────────────────────────╯
The space between each Cloud’s top and bottom regression lines is measured, normalized, and analyzed over time. When this spread tightens relative to its history, the script highlights the band with a yellow compression glow .
This visual cue helps identify squeeze zones before volatility expands. If you see compression paired with a changing slope color (e.g., gray to green), this may indicate an impending breakout.
────────────────────────────────────────────────────────────
╭─────────────────────────────────╮
3. Leverage the Optional Table UI
╰─────────────────────────────────╯
The indicator includes a dynamic, floating table that displays real-time metrics per Cloud. These include:
Slope direction and value , with historical Min/Max reference.
Top and Bottom percentile ranks , showing how price sits within the Cloud range.
Current spread width , compared to its historical norms.
Composite score , which blends trend, slope, and compression for that Cloud.
You can customize the table’s position, theme, transparency, and whether to show a combined summary score in the header.
────────────────────────────────────────────────────────────
╭─────────────────────────────────────────────╮
4. Analyze Candle Color for Composite Signals
╰─────────────────────────────────────────────╯
When enabled, the indicator colors candles based on a weighted composite score. This score factors in:
The signed slope of each Cloud (up, down, or flat)
The percentile pressure from the top and bottom bands
The degree of spread compression
Expect green candles in bullish trend phases, red candles during bearish regimes, and gray candles in mixed or low-conviction zones.
Candle coloring provides a visual shorthand for market conditions , useful for intraday scanning or historical backtesting.
────────────────────────────────────────────────────────────
╭────────────────────────╮
🧰 Configuration Guidance
╰────────────────────────╯
To tailor the indicator to your strategy:
Use Cloud lengths like 21, 34, 55, and 89 for a balanced multi-timeframe view.
Adjust the slope threshold (default 0.05) to control how sensitive the trend coloring is.
Set the spread floor (e.g., 0.15) to tune when compression is detected and visualized.
Choose your weighting style : Inverse Length (favor faster bands), Equal, or Max Pooling (most aggressive).
Set composite weights to emphasize trend slope, percentile bias, or compression—depending on your market edge.
────────────────────────────────────────────────────────────
╭────────────────╮
✅ Best Practices
╰────────────────╯
Use aligned Cloud colors across all bands to confirm trend conviction.
Combine slope direction with compression glow for early breakout entry setups.
In choppy markets, watch for Clouds 1 and 2 turning flat while Clouds 3 and 4 remain directional — a sign of potential trend exhaustion or consolidation.
Keep the table enabled during backtesting to manually evaluate how each Cloud behaved during price turns and consolidations.
────────────────────────────────────────────────────────────
╭───────────────────────╮
📌 License & Usage Terms
╰───────────────────────╯
This script is provided under the Creative Commons Attribution-NonCommercial 4.0 International License .
✅ You are allowed to:
Use this script for personal or educational purposes
Study, learn, and adapt it for your own non-commercial strategies
❌ You are not allowed to:
Resell or redistribute the script without permission
Use it inside any paid product or service
Republish without giving clear attribution to the original author
For commercial licensing , private customization, or collaborations, please contact Joshua Danford directly.

Auto Channel [SciQua]Auto Channel
Purpose
Auto Channel finds the single best parallel price channel from recent price action and keeps it updated in real time. It uses ZigZag pivots to build candidate channels, scores each candidate for quality, then plots the winner. When price closes outside the channel, the script flags a breakout and can fire alerts.
How it works
1. ZigZag pivots
The script uses TradingView’s TradingView/ZigZag/7 library to generate a stream of swing highs and lows based on a percentage reversal threshold and a leg depth. These pivots are the only points the channel logic evaluates, which keeps the search fast and focused on structure rather than noise.
2. Channel candidates
From the most recent pivots, the script forms all combinations of two swing highs and two swing lows.
It computes a slope for the high line and a slope for the low line and requires that they be nearly parallel within a user-defined tolerance.
3. Quality scoring and selection
For every valid candidate, the script checks the recent pivot segments against the trial channel and computes:
Inside ratio: fraction of tested pivots that sit fully inside the channel after applying the tolerance buffer.
Violation sum: total magnitude of the breaches for any pivots outside the channel.
Current width: distance between upper and lower lines at the current bar.
The “best” channel is chosen by:
1. highest inside ratio
2. then widest current width
3. then smallest violation sum
4. Plot and projection
The upper and lower lines are anchored to the chosen pivot pairs and extend to the left. The script also projects each line to the current bar to compute the live upper and lower channel prices. Those levels drive the breakout checks and alerts.
5. Breakouts and alerts
A breakout is detected when the bar closes above the projected upper line or closes below the projected lower line, after applying the tolerance buffer. Triangle markers highlight fresh breakouts, and you can enable alert conditions to automate notification or strategy handoff.
Inputs:
ZigZag
Price deviation for reversals (%)
Default 0.2. Larger values produce fewer, larger swings. Smaller values produce more, smaller swings.
Pivot legs
Default 2. Controls the lookback depth ZigZag uses to confirm pivots.
ZigZag Color
Visual only.
Tip: If you are not seeing a stable channel, increase the ZigZag percentage to reduce minor swings.
Channel search
Number of recent pivots to consider
Default 12. Higher values search more history and try more channel combinations. Lower values make the search faster and more reactive.
Max slope difference for parallel
Default 0.0005. Maximum allowed difference between the upper and lower line slopes. Smaller values enforce stricter parallelism.
Max price tolerance outside channel
Default 0.0. A buffer added to the channel boundaries during validation and breakout checks. Use this to ignore tiny wicks that poke the lines.
Minimum inside to outside pivots ratio for valid channel (0.00–1.00)
Default 1.00. Require that at least this fraction of checked pivots lie inside the channel. For a more permissive fit, try 0.60 to 0.85.
Styling
Upper Line Color
Lower Line Color
Breakout Above Color
Breakout Below Color
Plots and visuals
Upper channel line
Lower channel line
Triangle markers on the bar that first confirms a close outside the channel, above or below.
Lines extend left from their pivot anchors. Projection to the current bar is used internally to test for breakouts and to set alerts.
Alerts
The script defines two alert conditions:
Close Above Channel
Triggers when the bar closes above the projected upper line plus tolerance.
Close Below Channel
Triggers when the bar closes below the projected lower line minus tolerance.
Practical usage
Trend channels
In a steady trend, a high inside ratio with a moderate width often highlights the dominant channel. Consider trend entries near the lower line in an uptrend or near the upper line in a downtrend, with exits or stops beyond the opposite boundary.
Breakout trades
Combine the channel breakout alert with volume or a separate momentum filter. The tolerance input helps avoid false triggers from small wicks.
Tuning for timeframe and symbol
• Faster markets or lower timeframes usually benefit from a larger ZigZag percentage and a smaller pivot count.
• Slower markets or higher timeframes can use more pivots and a tighter slope difference to enforce cleaner geometry.
Notes and limitations
Channels are derived from ZigZag pivots. If your ZigZag settings change, the detected channel will also change.
The script plots only the single best channel at any time to keep the chart clean.
Breakout markers appear on confirmed bars. For historical bars, markers appear only where a breakout would have been confirmed at that time.
Lines extend left from their anchors. The script projects the lines internally to the current bar for checks and alerts.
License and attribution
License
Creative Commons Attribution-NonCommercial 4.0 International (CC BY-NC 4.0).
Open source for educational and personal use only. Commercial use requires written permission.
Attribution
© 2025 SciQua — Joshua Danford
Libraries
Uses TradingView/ZigZag/7.
Changelog
v1.0
Initial release. Automatic parallel channel detection from ZigZag pivots, quality scoring, live plotting, and close-based breakout alerts.
FAQ
Why do I not see any channel sometimes?
There may not be a valid pair of highs and lows that pass the slope, inside ratio, and tolerance checks. Loosen the constraints by increasing Max slope difference, lowering Minimum inside ratio, or increasing the ZigZag percentage.
The channel looks too narrow or too wide?
Adjust Number of recent pivots and Minimum inside ratio. A higher inside ratio tends to favor cleaner, sometimes wider channels. A lower ratio may admit narrower, more reactive channels.
How can I reduce false breakout alerts?
Increase Max price tolerance outside channel to ignore small wicks. Add a volume or momentum confirmation in your personal alert workflow.
Thank you for using Auto Channel . Feedback and improvements are welcome.

Trend Range Detector (Zeiierman)█ Overview
Trend Range Detector (Zeiierman) is a market structure tool that identifies and tracks periods of price compression by forming adaptive range boxes based on volatility and price movement. When prices remain stable within a defined band, the script dynamically draws a range box; when prices break out of that structure, the box highlights the breakout in real-time.
By combining a volatility-based envelope with a custom weighted centerline, this tool filters out noise and isolates truly stable zones — providing a clean framework for traders who focus on accumulation, distribution, breakout anticipation, and reversion opportunities.
Whether you're range trading, spotting trend consolidations, or looking for volatility contractions before major moves, the Trend Range Detector gives you a mathematically adaptive, visually intuitive structure that maps the heartbeat of the market.
█ How It Works
⚪ Range Formation Engine
The core of this indicator revolves around two conditions:
Distance Filter: The maximum distance between all recent closes and a dynamic centerline must remain within a volatility envelope.
Volatility Envelope: Based on an ATR(2000) multiplied by a user-defined factor to account for broader market volatility trends.
If both conditions are satisfied over the most recent length bars, a range box is drawn to visually anchor the zone.
⚪ Dynamic Breakout Coloring
When price breaks out of the top or bottom of the active range box, the box color shifts in real-time:
Blue Boxes represent areas where price has remained within a defined volatility envelope over a sustained number of bars. These zones reflect stable, low-volatility periods, often associated with consolidation, equilibrium, or market indecision.
Green Boxes for bullish breakouts.
Red Boxes for bearish breakdowns.
This allows traders to visually spot transitions from consolidation to expansion phases without relying on lagging signals.
█ Why Use a Weighted Close Instead of SMA?
A standard Simple Moving Average (SMA) treats all past closes equally, which works well in theory, but not in dynamic, fast-shifting markets. In this script, we replace the traditional SMA with a speed-weighted average that reflects how aggressively the market has moved bar-to-bar.
⚪ Here's why it matters:
Bars with higher momentum (larger price differences between closes) are given more weight.
Slow, sideways candles (typical in noise or low volume) contribute less to the calculated centerline.
This method creates a more accurate snapshot of market behavior, especially during volatile phases. As a result, the indicator adapts to market conditions more effectively, helping traders identify real consolidation zones, not just average lines distorted by flat bars or noise.
█ How to Use
⚪ Range Detection
Boxes form only when price remains consistently close to the speed-weighted mean.
Helps identify sideways zones, consolidations, and low-volatility structures where price is “charging up.”
⚪ Breakout Confirmation
Once price exits the top or bottom boundary, the box immediately highlights the direction of the break.
Use this signal in conjunction with your own momentum, volume, or trend filters for higher-confidence trades.
█ Settings
Minimum Range Length: Number of candles required for a valid range to form.
Range Width Multiplier: Adjusts the envelope around the weighted average using ATR(2000).
Highlight Box Breaks: Enables real-time coloring of breakouts and breakdowns for immediate visual feedback.
-----------------
Disclaimer
The content provided in my scripts, indicators, ideas, algorithms, and systems is for educational and informational purposes only. It does not constitute financial advice, investment recommendations, or a solicitation to buy or sell any financial instruments. I will not accept liability for any loss or damage, including without limitation any loss of profit, which may arise directly or indirectly from the use of or reliance on such information.
All investments involve risk, and the past performance of a security, industry, sector, market, financial product, trading strategy, backtest, or individual's trading does not guarantee future results or returns. Investors are fully responsible for any investment decisions they make. Such decisions should be based solely on an evaluation of their financial circumstances, investment objectives, risk tolerance, and liquidity needs.

15-Min ORB Indicator with Breakout Targets **What this indicator does:**
The 15-Min ORB (Opening Range Breakout) Indicator helps traders spot breakout trades by automatically detecting the high and low of the first 15 minutes after a session opens. It then monitors for breakouts above or below this range and plots dynamic take-profit levels based on your chosen multipliers.
**How it works:**
You set the start time for your session (hour and minute) in the settings.
The indicator marks the high and low during the first 15 minutes after your chosen open time, drawing lines on the chart and, if enabled, labels for these levels.
If price breaks above the 15-min high, a potential long breakout is identified; if it breaks below the low, a potential short breakout is detected.
Upon a breakout, the script calculates the distance from the entry (breakout) to the opposite side of the 15-min range and uses your input multipliers to project two take-profit levels (TP1/TP2).
All lines and labels (for the range and targets) can be individually toggled on or off in the settings.
Both the 15-min range and the targets can be styled (color, line style, label position).
**How to use it:**
Add the indicator to your chart.
Set the session start hour and minute to match your instrument’s open (e.g., 9:30 for US stocks or futures).
Use the settings to customize which levels and labels are shown, their appearance, and the target expansion multiples.
When price breaks out above or below the opening range, the script will plot TP1 and TP2 lines at your chosen risk/reward multiples, and label them if desired.
You can use the visual levels for trade entries, profit taking, or alerts.
**What makes it unique and useful:** >
Unlike many basic ORB indicators, this script not only marks the opening range but also tracks breakouts, auto-plots your profit targets based on range expansion, and gives you full control over display (styles, toggles, and label positions).
The TP targets are dynamic and can be set to any multiples, adapting to your risk/reward plan and breakout style.
Everything is customizable for your own session times, instrument, or trading approach.
**Typical uses:**
Intraday traders looking for clear breakout setups around the session open.
Automated R-multiple target planning for both long and short trades.
Visualizing volatility and measuring early price expansion.

Bollinger Bands Entry/Exit ThresholdsBollinger Bands Entry/Exit Thresholds
Author of enhancements: chuckaschultz
Inspired and adapted from the original 'Bollinger Bands Breakout Oscillator' by LuxAlgo
Overview
Pairs nicely with Contrarian 100 MA
The Bollinger Bands Entry/Exit Thresholds is a powerful momentum-based indicator designed to help traders identify potential entry and exit points in trending or breakout markets. By leveraging Bollinger Bands, this indicator quantifies price deviations from the bands to generate bullish and bearish momentum signals, displayed as an oscillator. It includes customizable entry and exit signals based on user-defined thresholds, with visual cues plotted either on the oscillator panel or directly on the price chart.
This indicator is ideal for traders looking to capture breakout opportunities or confirm trend strength, with flexible settings to adapt to various markets and trading styles.
How It Works
The Bollinger Bands Entry/Exit Thresholds calculates two key metrics:
Bullish Momentum (Bull): Measures the extent to which the price exceeds the upper Bollinger Band, expressed as a percentage (0–100).
Bearish Momentum (Bear): Measures the extent to which the price falls below the lower Bollinger Band, also expressed as a percentage (0–100).
The indicator generates:
Long Entry Signals: Triggered when the bearish momentum (bear) crosses below a user-defined Long Threshold (default: 40). This suggests weakening bearish pressure, potentially indicating a reversal or breakout to the upside.
Exit Signals: Triggered when the bullish momentum (bull) crosses below a user-defined Sell Threshold (default: 80), indicating a potential reduction in bullish momentum and a signal to exit long positions.
Signals are visualized as tiny colored dots:
Long Entry: Blue dots, plotted either at the bottom of the oscillator or below the price bar (depending on user settings).
Exit Signal: White dots, plotted either at the top of the oscillator or above the price bar.
Calculation Methodology
Bollinger Bands:
A user-defined Length (default: 14) is used to calculate an Exponential Moving Average (EMA) of the source price (default: close).
Standard deviation is computed over the same length, multiplied by a user-defined Multiplier (default: 1.0).
Upper Band = EMA + (Standard Deviation × Multiplier)
Lower Band = EMA - (Standard Deviation × Multiplier)
Bull and Bear Momentum:
For each bar in the lookback period (length), the indicator calculates:
Bullish Momentum: The sum of positive deviations of the price above the upper band, normalized by the total absolute deviation from the upper band, scaled to a 0–100 range.
Bearish Momentum: The sum of positive deviations of the price below the lower band, normalized by the total absolute deviation from the lower band, scaled to a 0–100 range.
Formula:
bull = (sum of max(price - upper, 0) / sum of abs(price - upper)) * 100
bear = (sum of max(lower - price, 0) / sum of abs(lower - price)) * 100
Signal Generation:
Long Entry: Triggered when bear crosses below the Long Threshold.
Exit: Triggered when bull crosses below the Sell Threshold.
Settings
Length: Lookback period for EMA and standard deviation (default: 14).
Multiplier: Multiplier for standard deviation to adjust Bollinger Band width (default: 1.0).
Source: Input price data (default: close).
Long Threshold: Bearish momentum level below which a long entry signal is generated (default: 40).
Sell Threshold: Bullish momentum level below which an exit signal is generated (default: 80).
Plot Signals on Main Chart: Option to display entry/exit signals on the price chart instead of the oscillator panel (default: false).
Style:
Bullish Color: Color for bullish momentum plot (default: #f23645).
Bearish Color: Color for bearish momentum plot (default: #089981).
Visual Features
Bull and Bear Plots: Displayed as colored lines with gradient fills for visual clarity.
Midline: Horizontal line at 50 for reference.
Threshold Lines: Dashed green line for Long Threshold and dashed red line for Sell Threshold.
Signal Dots:
Long Entry: Tiny blue dots (below price bar or at oscillator bottom).
Exit: Tiny white dots (above price bar or at oscillator top).
How to Use
Add to Chart: Apply the indicator to your TradingView chart.
Adjust Settings: Customize the Length, Multiplier, Long Threshold, and Sell Threshold to suit your trading strategy.
Interpret Signals:
Enter a long position when a blue dot appears, indicating bearish momentum dropping below the Long Threshold.
Exit the long position when a white dot appears, indicating bullish momentum dropping below the Sell Threshold.
Toggle Plot Location: Enable Plot Signals on Main Chart to display signals on the price chart for easier integration with price action analysis.
Combine with Other Tools: Use alongside other indicators (e.g., trendlines, support/resistance) to confirm signals.
Notes
This indicator is inspired by LuxAlgo’s Bollinger Bands Breakout Oscillator but has been enhanced with customizable entry/exit thresholds and signal plotting options.
Best used in conjunction with other technical analysis tools to filter false signals, especially in choppy or range-bound markets.
Adjust the Multiplier to make the Bollinger Bands wider or narrower, affecting the sensitivity of the momentum calculations.
Disclaimer
This indicator is provided for educational and informational purposes only.

Heatmap Trailing Stop with Breakouts (Zeiierman)█ Overview
Heatmap Trailing Stop with Breakouts (Zeiierman) is a trend and breakout detection tool that combines dynamic trailing stop logic, Fibonacci-based levels, and a real-time market heatmap into a single, intuitive system.
This indicator is designed to help traders visualize pressure zones, manage stop placement, and identify breakout opportunities supported by contextual price–derived heat. Whether you're trailing trends, detecting reversals, or entering on explosive breakouts — this tool keeps you anchored in structure and sentiment.
It projects adaptive trailing stop levels and calculates Fibonacci extensions from swing-based extremes. These levels are then colored by a market heatmap engine that tracks price interaction intensity — showing where the market is "hot" and likely to respond.
On top of that, it includes breakout signals powered by HTF momentum conditions, trend direction, and heatmap validation — giving you signals only when the context is strong.
█ How It Works
⚪ Trailing Stop Engine
At its core, the script uses an ATR-based trailing stop with trend detection:
ATR Length – Defines volatility smoothing using EMA MA of true range.
Multiplier – Expands/retracts the trailing offset depending on market aggression.
Real-Time Extremum Tracking – Uses local highs/lows to define Fibonacci anchors.
⚪ Fibonacci Projection + Heatmap
With each trend shift, Fibonacci levels are projected from the new swing to the current trailing stop. These include:
Fib 61.8, 78.6, 88.6, and 100% (trailing stop) lines
Heatmap Coloring – Each level'slevel's color is determined by how frequently price has interacted with that level in the recent range (defined by ATR).
Strength Score (1–10) – The number of touches per level is normalized and averaged to create a heatmap ""score"" displayed as a colored bar on the chart.
⚪ Breakout Signal System
This engine detects high-confidence breakout signals using a higher timeframe candle structure:
Bullish Breakout – Strong bullish candle + momentum + trend confirmation + heatmap score threshold.
Bearish Breakout – Strong bearish candle + momentum + trend confirmation + heatmap score threshold.
Cooldown Logic – Prevents signals from clustering too frequently during volatile periods.
█ How to Use
⚪ Trend Following & Trail Stops
Use the Trailing Stop line to manage positions or time entries in line with trend direction. Trailing stop flips are highlighted with dot markers.
⚪ Fibonacci Heat Zones
The projected Fibonacci levels serve as price magnets or support/resistance zones. Watch how price reacts at Fib 61.8/78.6/88.6 levels — especially when they're glowing with high heatmap scores (more glow = more historical touches = stronger significance).
⚪ Breakout Signals
Enable breakout signals when you want to trade breakouts only under strong context. Use the "Heatmap Strength Threshold" to require a minimum score (1–10).
█ Settings
Stop Distance ATR Length – ATR period for volatility smoothing
Stop Distance Multiplier – Adjusts the trailing stop'sstop's distance from price
Heatmap Range ATR Length – Defines how far back the heatmap scans for touches
Number of Heat Levels – Total levels used in the heatmap (more = finer resolution)
Minimum Touches per Level – Defines what counts as a ""hot"" level
Heatmap Strength Threshold – Minimum average heat score (1–10) required for breakouts
Timeframe – HTF source used to evaluate breakout momentum structure
-----------------
Disclaimer
The content provided in my scripts, indicators, ideas, algorithms, and systems is for educational and informational purposes only. It does not constitute financial advice, investment recommendations, or a solicitation to buy or sell any financial instruments. I will not accept liability for any loss or damage, including without limitation any loss of profit, which may arise directly or indirectly from the use of or reliance on such information.
All investments involve risk, and the past performance of a security, industry, sector, market, financial product, trading strategy, backtest, or individual's trading does not guarantee future results or returns. Investors are fully responsible for any investment decisions they make. Such decisions should be based solely on an evaluation of their financial circumstances, investment objectives, risk tolerance, and liquidity needs.

CNN Statistical Trading System [PhenLabs]📌 DESCRIPTION
An advanced pattern recognition system utilizing Convolutional Neural Network (CNN) principles to identify statistically significant market patterns and generate high-probability trading signals.
CNN Statistical Trading System transforms traditional technical analysis by applying machine learning concepts directly to price action. Through six specialized convolution kernels, it detects momentum shifts, reversal patterns, consolidation phases, and breakout setups simultaneously. The system combines these pattern detections using adaptive weighting based on market volatility and trend strength, creating a sophisticated composite score that provides both directional bias and signal confidence on a normalized -1 to +1 scale.
🚀 CONCEPTS
• Built on Convolutional Neural Network pattern recognition methodology adapted for financial markets
• Six specialized kernels detect distinct price patterns: upward/downward momentum, peak/trough formations, consolidation, and breakout setups
• Activation functions create non-linear responses with tanh-like behavior, mimicking neural network layers
• Adaptive weighting system adjusts pattern importance based on current market regime (volatility < 2% and trend strength)
• Multi-confirmation signals require CNN threshold breach (±0.65), RSI boundaries, and volume confirmation above 120% of 20-period average
🔧 FEATURES
Six-Kernel Pattern Detection:
Simultaneous analysis of upward momentum, downward momentum, peak/resistance, trough/support, consolidation, and breakout patterns using mathematically optimized convolution kernels.
Adaptive Neural Architecture:
Dynamic weight adjustment based on market volatility (ATR/Price) and trend strength (EMA differential), ensuring optimal performance across different market conditions.
Professional Visual Themes:
Four sophisticated color palettes (Professional, Ocean, Sunset, Monochrome) with cohesive design language. Default Monochrome theme provides clean, distraction-free analysis.
Confidence Band System:
Upper and lower confidence zones at 150% of threshold values (±0.975) help identify high-probability signal areas and potential exhaustion zones.
Real-Time Information Panel:
Live display of CNN score, market state with emoji indicators, net momentum, confidence percentage, and RSI confirmation with dynamic color coding based on signal strength.
Individual Feature Analysis:
Optional display of all six kernel outputs with distinct visual styles (step lines, circles, crosses, area fills) for advanced pattern component analysis.
User Guide
• Monitor CNN Score crossing above +0.65 for long signals or below -0.65 for short signals with volume confirmation
• Use confidence bands to identify optimal entry zones - signals within confidence bands carry higher probability
• Background intensity reflects signal strength - darker backgrounds indicate stronger conviction
• Enter long positions when blue circles appear above oscillator with RSI < 75 and volume > 120% average
• Enter short positions when dark circles appear below oscillator with RSI > 25 and volume confirmation
• Information panel provides real-time confidence percentage and momentum direction for position sizing decisions
• Individual feature plots allow granular analysis of specific pattern components for strategy refinement
💡Conclusion
CNN Statistical Trading System represents the evolution of technical analysis, combining institutional-grade pattern recognition with retail accessibility. The six-kernel architecture provides comprehensive market pattern coverage while adaptive weighting ensures relevance across all market conditions. Whether you’re seeking systematic entry signals or advanced pattern confirmation, this indicator delivers mathematically rigorous analysis with intuitive visual presentation.

Support and Resistance Logistic Regression | Flux Charts💎 GENERAL OVERVIEW
Introducing our new Logistic Regression Support / Resistance indicator! This tool leverages advanced statistical modeling "Logistic Regressions" to identify and project key price levels where the market is likely to find support or resistance. For more information about the process, please check the "HOW DOES IT WORK ?" section.
Logistic Regression Support / Resistance Features :
Intelligent S/R Identification : The indicator uses a logistic regression model to intelligently identify and plot significant support and resistance levels.
Predictive Probability : Each identified level comes with a calculated probability, indicating how likely it is to act as a true support or resistance based on historical data.
Retest & Break Labels : The indicator clearly marks on your chart when a detected support or resistance level is retested (price touches and respects the level) or broken (price decisively crosses through the level).
Alerts : Real-time alerts for support retests, resistance retests, support breaks, and resistance breaks.
Customizable : You can change support & resistance line style, width and colors.
🚩 UNIQUENESS
What makes this indicator truly unique is its application of logistic regression to the concept of support and resistance. Instead of merely identifying historical highs and lows, our indicator uses a statistical model to predict the future efficacy of these levels. It analyzes underlying market conditions (like RSI and body size at pivot formation) to assign a probability to each potential S/R zone. This predictive insight, combined with dynamic, real-time labeling of retests and breaks, provides a more robust and adaptive understanding of market structure than traditional, purely historical methods.
📌HOW DOES IT WORK ?
The Logistic Regression Support / Resistance indicator operates in several key steps:
First, it identifies significant pivot highs and lows on the chart based on a user-defined "Pivot Length." These pivots are potential areas of support or resistance.
For each detected pivot, the indicator extracts relevant market data at that specific point, including the RSI (Relative Strength Index) and the Body Size (the absolute difference between the open and close price of the candle). These serve as input features for the model.
The core of the indicator lies in its logistic regression model. This model is continuously trained on past pivot data and their subsequent behavior (i.e., whether they were "respected" as support/resistance multiple times). It learns the relationship between the extracted features (RSI, Body Size) and the likelihood of a pivot becoming a significant S/R level.
When a new pivot is identified, the model uses its learned insights to calculate a prediction value—a probability (from 0 to 1) that this specific pivot will act as a strong support or resistance.
If the calculated probability exceeds a user-defined "Probability Threshold," the pivot is designated a "Regression Pivot" and drawn on the chart as a support or resistance line. The indicator then actively tracks how price interacts with these levels, displaying "R" labels for retests when the price bounces off the level and "B" labels for breaks when the price closes beyond it.
⚙️ SETTINGS
1. General Configuration
Pivot Length: This setting defines the number of bars used to determine a significant high or low for pivot detection.
Target Respects: This input specifies how many times a level must be "respected" by price action for it to be considered a strong support or resistance level by the underlying model.
Probability Threshold: This is the minimum probability output from the logistic regression model for a detected pivot to be considered a valid support or resistance level and be plotted on the chart.
2. Style
Show Prediction Labels: Enable or disable labels that display the calculated probability of a newly identified regression S/R level.
Show Retests: Toggle the visibility of "R" labels on the chart, which mark instances where price has retested a support or resistance level.
Show Breaks: Toggle the visibility of "B" labels on the chart, which mark instances where price has broken through a support or resistance level.

Candle Breakout Oscillator [LuxAlgo]The Candle Breakout Oscillator tool allows traders to identify the strength and weakness of the three main market states: bullish, bearish, and choppy.
Know who controls the market at any given moment with an oscillator display with values ranging from 0 to 100 for the three main plots and upper and lower thresholds of 80 and 20 by default.
🔶 USAGE
The Candle Breakout Oscillator represents the three main market states, with values ranging from 0 to 100. By default, the upper and lower thresholds are set at 80 and 20, and when a value exceeds these thresholds, a colored area is displayed for the trader's convenience.
This tool is based on pure price action breakouts. In this context, we understand a breakout as a close above the last candle's high or low, which is representative of market strength. All other close positions in relation to the last candle's limits are considered weakness.
So, when the bullish plot (in green) is at the top of the oscillator (values above 80), it means that the bullish breakouts (close below the last candle low) are at their maximum value over the calculation window, indicating an uptrend. The same interpretation can be made for the bearish plot (in red), indicating a downtrend when high.
On the other hand, weakness is indicated when values are below the lower threshold (20), indicating that breakouts are at their minimum over the last 100 candles. Below are some examples of the possible main interpretations:
There are three main things to look for in this oscillator:
Value reaches extreme
Value leaves extreme
Bullish/Bearish crossovers
As we can see on the chart, before the first crossover happens the bears come out of strength (top) and the bulls come out of weakness (bottom), then after the crossover the bulls reach strength (top) and the bears weakness (bottom), this process is repeated in reverse for the second crossover.
The other main feature of the oscillator is its ability to identify periods of sideways trends when the sideways values have upper readings above 80, and trending behavior when the sideways values have lower readings below 20. As we just saw in the case of bullish vs. bearish, sideways values signal a change in behavior when reaching or leaving the extremes of the oscillator.
🔶 DETAILS
🔹 Data Smoothing
The tool offers up to 10 different smoothing methods. In the chart above, we can see the raw data (smoothing: None) and the RMA, TEMA, or Hull moving averages.
🔹 Data Weighting
Users can add different weighting methods to the data. As we can see in the image above, users can choose between None, Volume, or Price (as in Price Delta for each breakout).
🔶 SETTINGS
Window: Execution window, 100 candles by default
🔹 Data
Smoothing Method: Choose between none or ten moving averages
Smoothing Length: Length for the moving average
Weighting Method: Choose between None, Volume, or Price
🔹 Thresholds
Top: 80 by default
Bottom: 20 by default
