Forexsebi - DAX Future Psychological Levels - TrendflowTrendflow is an advanced TradingView indicator combining psychological price levels with trend and multi-timeframe analysis.
The indicator automatically plots psychological levels in around the current price. Each level is visualized using horizontal lines and price zones (boxes) to clearly highlight potential support and resistance areas.
Psychological Levels – Trendflow ist ein fortschrittlicher TradingView-Indikator , der wichtige psychologische Preislevel mit einer klaren Trend- und Multi-Timeframe-Analyse kombiniert.
Trend Analysis with SMAs
SMA 50 & SMA 200 plotted directly on the chart
Individually toggleable
Clear color separation for fast trend recognition
Multi-Timeframe SMA Trend Table
Trend status (BULLISH / BEARISH / NEUTRAL) across:
5M, 15M, 1H, 4H, 1D
Logic: Price relative to SMA 50 & SMA 200
Color-coded, easy-to-read table
Info Box
Current Gold price
Nearest psychological level above and below price
Alert System
Alerts when price approaches a psychological level
User-defined alert distance
Indicadores de Banda

Forexsebi - NASDAQ Psychological Levels - TrendflowTrendflow is an advanced TradingView indicator combining psychological price levels with trend and multi-timeframe analysis.
The indicator automatically plots psychological levels in around the current price. Each level is visualized using horizontal lines and price zones (boxes) to clearly highlight potential support and resistance areas.
Psychological Levels – Trendflow ist ein fortschrittlicher TradingView-Indikator , der wichtige psychologische Preislevel mit einer klaren Trend- und Multi-Timeframe-Analyse kombiniert.
Trend Analysis with SMAs
SMA 50 & SMA 200 plotted directly on the chart
Individually toggleable
Clear color separation for fast trend recognition
Multi-Timeframe SMA Trend Table
Trend status (BULLISH / BEARISH / NEUTRAL) across:
5M, 15M, 1H, 4H, 1D
Logic: Price relative to SMA 50 & SMA 200
Color-coded, easy-to-read table
Info Box
Current Gold price
Nearest psychological level above and below price
Alert System
Alerts when price approaches a psychological level
User-defined alert distance

Forexsebi - GBPJPY Psychological Levels - TrendflowTrendflow is an advanced TradingView indicator combining psychological price levels with trend and multi-timeframe analysis.
The indicator automatically plots psychological levels in around the current price. Each level is visualized using horizontal lines and price zones (boxes) to clearly highlight potential support and resistance areas.
Psychological Levels – Trendflow ist ein fortschrittlicher TradingView-Indikator , der wichtige psychologische Preislevel mit einer klaren Trend- und Multi-Timeframe-Analyse kombiniert.
Trend Analysis with SMAs
SMA 50 & SMA 200 plotted directly on the chart
Individually toggleable
Clear color separation for fast trend recognition
Multi-Timeframe SMA Trend Table
Trend status (BULLISH / BEARISH / NEUTRAL) across:
5M, 15M, 1H, 4H, 1D
Logic: Price relative to SMA 50 & SMA 200
Color-coded, easy-to-read table
Info Box
Current Gold price
Nearest psychological level above and below price
Alert System
Alerts when price approaches a psychological level
User-defined alert distance

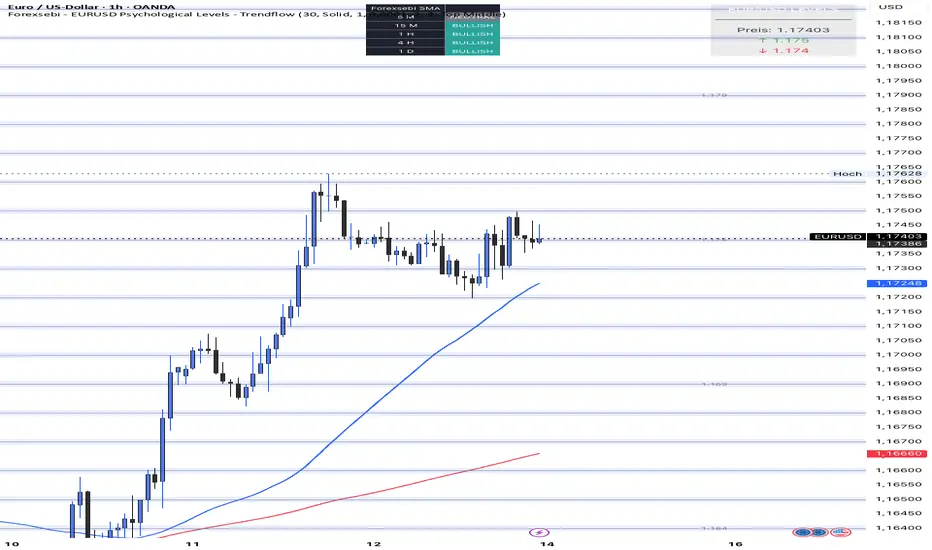
Forexsebi - EURUSD Psychological Levels - TrendflowTrendflow is an advanced TradingView indicator combining psychological price levels with trend and multi-timeframe analysis.
The indicator automatically plots psychological levels in around the current price. Each level is visualized using horizontal lines and price zones (boxes) to clearly highlight potential support and resistance areas.
Psychological Levels – Trendflow ist ein fortschrittlicher TradingView-Indikator , der wichtige psychologische Preislevel mit einer klaren Trend- und Multi-Timeframe-Analyse kombiniert.
Trend Analysis with SMAs
SMA 50 & SMA 200 plotted directly on the chart
Individually toggleable
Clear color separation for fast trend recognition
Multi-Timeframe SMA Trend Table
Trend status (BULLISH / BEARISH / NEUTRAL) across:
5M, 15M, 1H, 4H, 1D
Logic: Price relative to SMA 50 & SMA 200
Color-coded, easy-to-read table
Info Box
Current Gold price
Nearest psychological level above and below price
Alert System
Alerts when price approaches a psychological level
User-defined alert distance
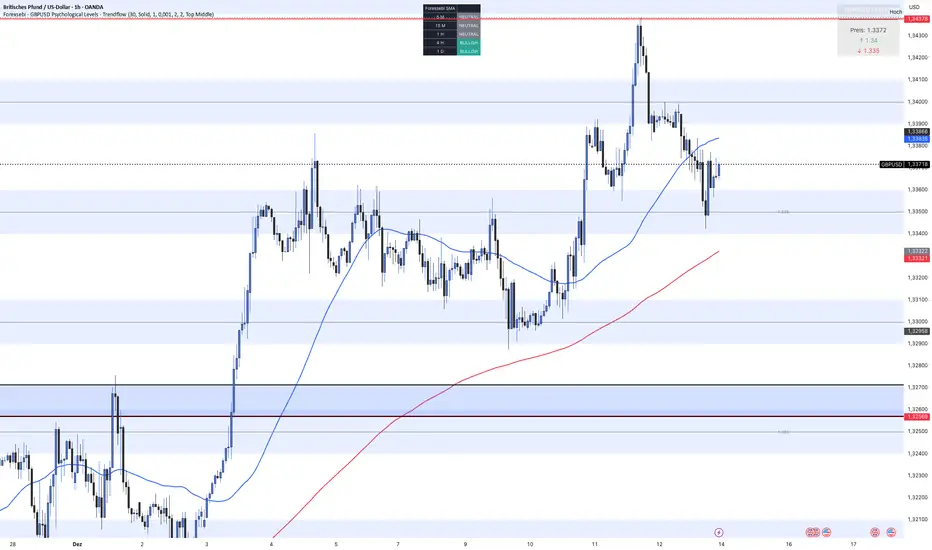
Forexsebi - GBPUSD Psychological Levels - TrendflowTrendflow is an advanced TradingView indicator combining psychological price levels with trend and multi-timeframe analysis.
The indicator automatically plots psychological levels in around the current price. Each level is visualized using horizontal lines and price zones (boxes) to clearly highlight potential support and resistance areas.
Psychological Levels – Trendflow ist ein fortschrittlicher TradingView-Indikator , der wichtige psychologische Preislevel mit einer klaren Trend- und Multi-Timeframe-Analyse kombiniert.
Trend Analysis with SMAs
SMA 50 & SMA 200 plotted directly on the chart
Individually toggleable
Clear color separation for fast trend recognition
Multi-Timeframe SMA Trend Table
Trend status (BULLISH / BEARISH / NEUTRAL) across:
5M, 15M, 1H, 4H, 1D
Logic: Price relative to SMA 50 & SMA 200
Color-coded, easy-to-read table
Info Box
Current Gold price
Nearest psychological level above and below price
Alert System
Alerts when price approaches a psychological level
User-defined alert distance
Forexsebi - GOLD Psychological Levels - TrendflowPsychological GOLD levels every $50 with clear zones, highlighted $100 & $500 levels, SMA 50 & 200, and a multi-timeframe trend table. Perfect for structure, trend, and rejection trading on XAUUSD.
Psychologische GOLD-Levels in 50-Dollar-Abständen mit klaren Zonen, 100- & 500-Dollar-Highlights, SMA 50 & 200 sowie einer Multi-Timeframe Trend-Tabelle. Ideal für Struktur-, Trend- und Rejection-Trading auf XAUUSD.
Key Features
Psychological Gold Levels
Automatic levels every $50
Adjustable number of levels above and below current price
Highlighted zones around each level for clearer reaction areas
Special Level Highlighting
$100 levels (xx00) highlighted for medium importance
$500 levels (x000 / x500) marked as major psychological levels
Different colors and stronger line thickness for key zones
Price Labels
Clean price labels displayed on the chart
Special symbols for 100 and 500 dollar levels
Trend Analysis with SMAs
SMA 50 & SMA 200 plotted directly on the chart
Individually toggleable
Clear color separation for fast trend recognition
Multi-Timeframe SMA Trend Table
Trend status (BULLISH / BEARISH / NEUTRAL) across:
5M, 15M, 1H, 4H, 1D
Logic: Price relative to SMA 50 & SMA 200
Color-coded, easy-to-read table
Displays the current trading session (Asia, Frankfurt, London, NY)
Info Box
Current Gold price
Nearest psychological level above and below price
Alert System
Alerts when price approaches a psychological level
User-defined alert distance
Distinction between normal, $100 and $500 levels

MNQ Quant Oscillator Lab v2.1MNQ Quant Oscillator Lab v2.1 — Clean Namespaces
Adaptive LinReg Oscillator + Auto Regime Switching + MTF Confirmation + MOEP Gate + Research Harness
MNQ Quant Oscillator Lab is a research-grade oscillator framework designed for MNQ/NQ (and other liquid futures/indices) on 1-minute and intraday timeframes. It combines a linear-regression-based detrended oscillator with quant-style normalization, adaptive parameterization, regime switching, multi-timeframe confirmation, and an optional MOEP (Minimum Optimal Entry Point) gate. The goal is to provide a customizable signal laboratory that is stable in real time, non-repainting by default, and suitable for systematic experimentation.
What this indicator does
1) Core oscillator (quant-normalized)
The indicator computes a linear regression (LinReg) detrended signal and expresses it as a z-scored oscillator for portability across volatility regimes and assets. You can switch the oscillator “transform family” via Oscillator type:
LinReg Residual / Residual Z: detrended residual (mean-reversion sensitive)
LinReg Slope Z: regression slope (trend-derivative sensitive)
LogReturn Z: log-return oscillator (momentum-style)
VolNorm Return Z: volatility-normalized returns (risk-scaled)
This yields a single oscillator that is comparable over time, not tied to raw point values.
2) Adaptive length (dynamic calibration)
When enabled, the regression length is automatically adapted using a volatility-regime proxy (ATR% z-scored → logistic mapping). High volatility typically shortens the effective lookback; low volatility allows longer lookbacks. This helps the oscillator remain responsive during expansions while staying stable in compressions.
Important: the adaptive logic is implemented with safe warmup behavior, so it will not throw NaN errors on early bars.
3) Adaptive thresholds (dynamic bands)
Instead of static overbought/oversold levels, the indicator can compute dynamic upper/lower bands from the oscillator’s own distribution (rolling mean + sigma). This creates thresholds that adjust automatically to regime changes.
4) Auto regime switching (Trend vs Mean Reversion)
With Auto regime switch enabled, the indicator selects whether to behave as a Trend system or a Mean Reversion system using an interpretable heuristic:
Trend regime when EMA-spread is strong relative to ATR and ATR is rising
Otherwise defaults to Mean Reversion
This prevents running mean-reversion logic in trend breakouts and reduces “mode mismatch.”
5) Multi-timeframe (MTF) confirmation (optional)
MTF confirmation can be enabled to require that the higher timeframe oscillator sign aligns with the direction of the signal. This is useful for reducing noise on MNQ 1m by requiring higher-timeframe structure agreement (e.g., 5m or 15m).
6) MOEP Gate (optional “institutional” filter)
The MOEP gate is a confluence score filter intended to reduce low-quality signals. It aggregates multiple components into a 0–100 score:
BB/KC squeeze condition
Expansion proxy
Trend proxy
Momentum proxy (RSI-based)
Volume catalyst (volume z-score)
Structure break (highest/lowest break)
You can set:
Score threshold (minimum score required)
Minimum components required (forces diversity of evidence)
When enabled, a signal must satisfy both oscillator logic and MOEP confluence conditions.
7) Research harness (NON-CAUSAL, OFF by default)
A built-in research mode evaluates signals using future bars to compute basic forward excursion statistics:
MFE (max favorable excursion)
MAE (max adverse excursion)
Simple win-rate proxy based on MFE vs MAE
This feature is strictly for offline analysis and tuning. It is disabled by default and should not be considered “live-safe” because it uses future information for evaluation.
Signals and interpretation
Mean Reversion regime
Long: oscillator is below the lower band and turns back upward across it
Short: oscillator is above the upper band and turns back downward across it
Trend regime
Long: oscillator crosses above zero (optionally requires structure break confirmation)
Short: oscillator crosses below zero (optionally requires structure break confirmation)
Hybrid
When Hybrid is selected (manual mode), the indicator allows both trend and mean-reversion triggers, but still respects the filters and gates you enable.
Recommended starting configuration (MNQ 1m)
If you want stable, high-quality signals first, then expand into research:
Use RTH only: ON
Auto regime switch: ON
Adaptive length: ON
Adaptive bands: ON
MTF confirmation: OFF initially (turn ON later with 5m)
MOEP Gate: OFF initially (turn ON after you confirm base behavior)
Research harness: OFF (only enable for tuning studies)
Practical notes / transparency
The indicator is designed to be stable on live bars (optional confirmed-bar behavior reduces flicker).
No repainting logic is used for signals.
Any “performance” numbers shown under Research harness are not tradable metrics; they are forward-looking evaluation outputs intended strictly for experimentation.
Disclaimer
This script is provided for educational and research purposes only and does not constitute financial advice. Futures trading involves substantial risk, including the possibility of loss exceeding initial investment.

AJ Super Blast SignalsPrice action trading script suited for all TF, it will work on all instruments NIFTY/ BANK NIFTY/COMMODITY/SENSEX/ MIDCAP NIIFTY AND CRYPTOCURRENCY....IT HELPS TO AVOID SIDEWAYS MARKET SIGNALS WHICH PREVIOUS SCRIPTS DOESNT DO

ORB Strategy + Backtesting (fixed timestamp) - Lines Adjusted⚡ ORB Strategy + Backtesting (Pine Script v5)
This script implements a complete Opening Range Breakout (ORB) strategy, featuring built-in backtesting, advanced TP/SL visualization, full style customization, and a performance dashboard. It is designed for traders who want to clearly evaluate breakout performance directly on the chart.
🕑 ORB Window Configuration
🔹 Session selection: choose between Market Timezone or Custom Session.
🔹 Timezone support: configurable from UTC-8 to UTC+12.
🔹 Daily limit: option to allow only one trade per day.
🔹 Risk/Reward (RR) settings:
Configurable TP1, TP2, and TP3 levels.
Stop Loss calculated dynamically from the ORB range.
📊 Backtesting Engine
🔹 Interactive dashboard showing trades, wins, losses, and win rate.
🔹 Adjustable partial exits for each TP (TP1, TP2, TP3).
🔹 Automatic calculation of percentage-based profit and loss.
🔹 Tracks total trades, total profit, and average profit per trade.
🎨 Visual Customization
🔹 Fully customizable colors:
ORB high/low lines and range fill.
Buy/Sell entry labels.
TP and SL lines with background zones.
🔹 Line style and thickness options (solid, dotted, dashed).
🔹 Visibility controls for each TP/SL level.
🔹 Clear profit and loss zones drawn directly on the chart.
🚀 Trading Logic
🔹 LONG entries: triggered when price breaks above the ORB high.
🔹 SHORT entries: triggered when price breaks below the ORB low.
🔹 Automatic calculation of Stop Loss and TP1, TP2, TP3 based on ORB range and RR.
🔹 Customizable BUY / SELL labels displayed at entry.
✅ TP / SL Detection
🔹 Real-time detection of TP1, TP2, TP3, and SL hits.
🔹 Prevents double counting of the same level.
🔹 Extended TP/SL lines with shaded zones for better clarity.
📈 Backtesting Dashboard
🔹 Displayed in the top-right corner of the chart.
🔹 Shows:
Total trades
Wins / Losses
Win rate (%)
Total profit (%)
Average profit per trade
🔹 Fully customizable panel color.
✨ Summary
This script combines:
Opening Range detection
Breakout trading logic with advanced risk management
Professional-grade visualizations
Integrated historical performance tracking
High customization for sessions, styles, and colors
💡 Ideal for traders who want to trade ORB setups with clarity, structure, and measurable results.

JAM ORB Algo⚡ ORB Strategy + Backtesting (Pine Script v5)
This script implements a complete Opening Range Breakout (ORB) strategy, featuring built-in backtesting, advanced TP/SL visualization, full style customization, and a performance dashboard. It is designed for traders who want to clearly evaluate breakout performance directly on the chart.
🕑 ORB Window Configuration
🔹 Session selection: choose between Market Timezone or Custom Session.
🔹 Timezone support: configurable from UTC-8 to UTC+12.
🔹 Daily limit: option to allow only one trade per day.
🔹 Risk/Reward (RR) settings:
Configurable TP1, TP2, and TP3 levels.
Stop Loss calculated dynamically from the ORB range.
📊 Backtesting Engine
🔹 Interactive dashboard showing trades, wins, losses, and win rate.
🔹 Adjustable partial exits for each TP (TP1, TP2, TP3).
🔹 Automatic calculation of percentage-based profit and loss.
🔹 Tracks total trades, total profit, and average profit per trade.
🎨 Visual Customization
🔹 Fully customizable colors:
ORB high/low lines and range fill.
Buy/Sell entry labels.
TP and SL lines with background zones.
🔹 Line style and thickness options (solid, dotted, dashed).
🔹 Visibility controls for each TP/SL level.
🔹 Clear profit and loss zones drawn directly on the chart.
🚀 Trading Logic
🔹 LONG entries: triggered when price breaks above the ORB high.
🔹 SHORT entries: triggered when price breaks below the ORB low.
🔹 Automatic calculation of Stop Loss and TP1, TP2, TP3 based on ORB range and RR.
🔹 Customizable BUY / SELL labels displayed at entry.
✅ TP / SL Detection
🔹 Real-time detection of TP1, TP2, TP3, and SL hits.
🔹 Prevents double counting of the same level.
🔹 Extended TP/SL lines with shaded zones for better clarity.
📈 Backtesting Dashboard
🔹 Displayed in the top-right corner of the chart.
🔹 Shows:
Total trades
Wins / Losses
Win rate (%)
Total profit (%)
Average profit per trade
🔹 Fully customizable panel color.
✨ Summary
This script combines:
Opening Range detection
Breakout trading logic with advanced risk management
Professional-grade visualizations
Integrated historical performance tracking
High customization for sessions, styles, and colors
💡 Ideal for traders who want to trade ORB setups with clarity, structure, and measurable results.

Trading Dashboard + Daily SMAsThis indicator is an all-in-one workspace overlay designed for futures and intraday traders. It consolidates critical market internals, session statistics, and daily technical levels into a single, highly customizable dashboard.
The goal of this script is to reduce chart clutter by placing essential data into a clean table while overlaying key Daily Moving Averages onto your intraday timeframe.
Key Features:
1. Comprehensive Market Internals Dashboard Monitor the health of the broad market directly from your chart. The dashboard includes real-time data for:
VIX: Volatility Index.
TICK & TRIN: Sentiment and volume flow indicators.
Breadth Data: ADD, ADV, and DECL (Advance/Decline lines and volume).
Multi-Ticker Watch: Monitor 3 additional assets (Defaults: NQ, RTY, YM) with real-time price and % change.
2. Session Statistics & Probabilities Automated calculation of intraday statistics based on a user-defined lookback period (default 100 days):
RTH Data: Tracks Regular Trading Hours Open, Close, and Range.
Contextual ATR: Compares current RTH range to the 14-day ATR.
Probabilities: Displays historical probabilities for "Gap Fill," "Break of Yesterday's High," and "Break of Yesterday's Low."
3. Daily SMAs on Intraday Charts Plot key Daily Simple Moving Averages (21, 50, 200) directly on your lower timeframe charts (1m, 5m, etc.) without switching views.
Fully Customizable: Toggle each SMA on/off individually.
Color Control: Users can change the color of every SMA line to fit their theme.
4. "Dark Mode" Optimized The dashboard features a specific "Very Dark Grey" (#121212) background by default, designed to reduce eye strain and blend seamlessly with dark-themed trading setups.
Settings & Customization:
Session Times: Define your specific RTH start and end times.
Symbols: All ticker symbols (VIX, ADD, NQ, etc.) can be customized in the settings menu to match your data provider.
Visibility: Every element in the table and every SMA line has a toggle switch. You only see what you need.
Visuals: Change table position, text size, and line colors.
Author's Instructions: Configuration Guide
This script relies on specific ticker symbols to pull data for Market Internals (TICK, TRIN, ADD) and the Watchlist. Depending on your data subscription plan (CME, CBOE, etc.), you may need to adjust the default symbols to match what you have access to.
1. How to Change Symbols
Add the indicator to your chart.
Hover over the indicator name in the top-left corner and click the Settings (Gear Icon).
Scroll to the "Symbols" section.
Click inside the text box for the symbol you want to change.
2. Common Symbol Formats If the default symbols show "N/A" or "Error," try these alternatives based on your data feed:
TICK (NYSE Tick)
Default: USI:TICK (Requires specific data)
Alternative: TVC:TICK (General TradingView feed)
Alternative: TICK (Generic)
TRIN (Arms Index)
Default: USI:TRIN
Alternative: TVC:TRIN
Alternative: TRIN
Breadth (ADD/ADV/DECL)
ADD (Advance-Decline Line): Try USI:ADD, TVC:ADD, or ADD
ADV (Advancing Volume): Try USI:ADV, TVC:ADV, or UVOL (Up Volume)
DECL (Declining Volume): Try USI:DECL, TVC:DECL, or DVOL (Down Volume)
VIX
Standard: CBOE:VIX or TVC:VIX
3. Setting Up the Ticker Watchlist (Ticker 1, 2, 3) The script defaults to "Continuous Contracts" (indicated by the 1!), which automatically rolls to the front month.
Nasdaq: CME_MINI:NQ1!
S&P 500: CME_MINI:ES1!
Russell 2000: CME_MINI:RTY1!
Dow Jones: CBOT_MINI:YM1!
Note: If you want to watch a specific contract month (e.g., December 2025), enter the specific code like NQZ2025.
4. Troubleshooting "N/A" Data If a cell in the table is empty or says "N/A":
Verify you are not viewing the chart on a timeframe that excludes the data (though dynamic_requests=true usually handles this).
Ensure you have the correct data permission for that specific symbol.
Market Closed: Some internal data points only populate during the active NYSE session (09:30 - 16:00 ET).
Disclaimer: This tool is for informational purposes only and does not constitute financial advice. Past probabilities do not guarantee future results.

4-Week Return ColumnsWhat it does
This indicator calculates the cumulative return over each 4-week block (4 weekly bars) for a selected security and plots the result as a column chart on the 4th week of each block.
How it works
Runs on Weekly timeframe (indicator is fixed to W).
For every 4 weekly candles:
Start = Week 1 close
End = Week 4 close
Return = (End / Start - 1) × 100 (if % enabled)
By default, it plots only at the end of Week 4 to keep the chart clean.
Inputs
Use chart symbol: Use the current chart’s symbol (default).
Security (if not using chart): Select a different ticker to calculate returns for.
Show %: Toggle between percent and decimal return.
Rolling 4W return (every week): If enabled, plots the rolling 4-week return on every week instead of only the 4th week.
Notes / limitations
“4-week” means 4 weekly bars, not “the 4th calendar week of the month.”
Weekly bars follow the exchange session calendar, so holidays can slightly shift how weeks align.
Use cases
Compare 4-week momentum across symbols
Spot acceleration/slowdown in trend strength
Identify choppy vs trending phases at a glance
Disclaimer
For educational purposes only. Not financial advice.
Table/Checklist
Suggested default settings
Use chart symbol: ✅ ON
Show %: ✅ ON
Rolling: ❌ OFF (cleaner “block-end” columns)

RS vs Indexes By Shashi MishraRS vs Indexes giving details about strength of the sripts against the TIDE which is indexes that you can follow , for example small cap index 100 / 250

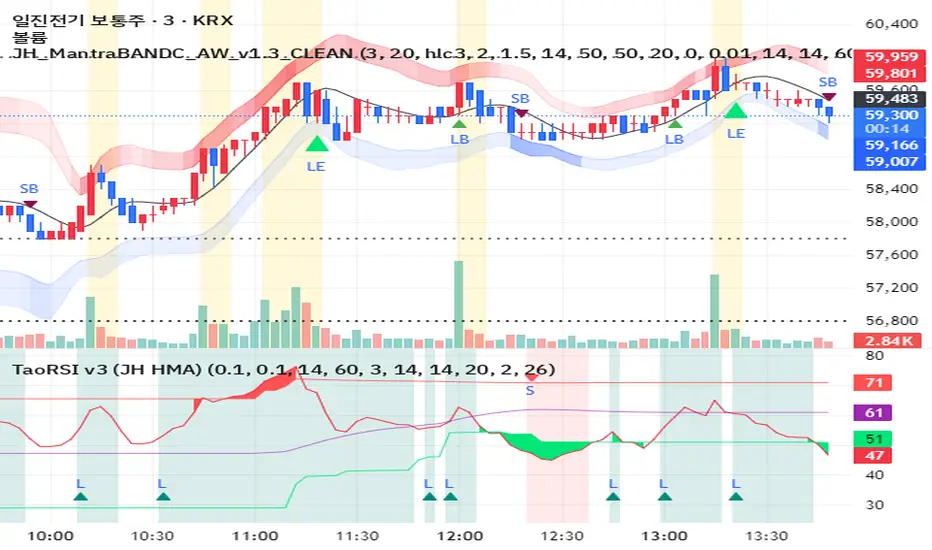
AlphaWave Band + Tao Trend Start/End (JH) v1.1AlphaWave Band + Tao Trend Start/End (JH)
이 지표는 **“추세구간만 먹는다”**는 철학으로 설계된 트렌드 시각화 & 트리거 도구입니다.
예측하지 않고,
횡보를 피하고,
이미 시작된 추세의 시작과 끝만 명확하게 표시하는 데 집중합니다.
🔹 핵심 개념
AlphaWave Band
→ 변동성 기반으로 기다려야 할 자리를 만들어 줍니다.
TAO RSI
→ 과열/과매도 구간에서 지금 반응해야 할 순간을 정확히 짚어줍니다.
🔹 신호 구조 (단순 · 명확)
START (▲ 아래 표시)
추세가 시작되는 구간
END (▼ 위 표시)
추세가 종료되는 구간
> 중간 매매는 각자의 전략 영역이며,
이 지표는 추세의 시작과 끝을 시각화하는 데 목적이 있습니다.
🔹 시각적 특징
20 HMA 추세선
상승 추세: 노란색
하락 추세: 녹색
횡보 구간: 중립 색상
기존 밴드와 세력 표시를 훼손하지 않고
추세 흐름만 직관적으로 강조
🔹 추천 사용 구간
3분 / 5분 (단타 · 스캘핑)
일봉 (중기 추세 확인)
> “예측하지 말고, 추세를 따라가라.”
---
📌 English Description (TradingView)
AlphaWave Band + Tao Trend Start/End (JH)
This indicator is designed with one clear philosophy:
“Trade only the trend.”
No prediction.
No noise.
No meaningless sideways signals.
It focuses purely on visualizing the START and END of trend phases.
🔹 Core Concept
AlphaWave Band
→ Defines where you should wait based on volatility.
TAO RSI
→ Pinpoints when price reaction actually matters near exhaustion zones.
🔹 Signal Logic (Clean & Minimal)
START (▲ below price)
Marks the beginning of a trend
END (▼ above price)
Marks the end of a trend
> Entries inside the trend are trader-dependent.
This tool is about structure, not over-signaling.
🔹 Visual Design
20 HMA Trend Line
Uptrend: Yellow
Downtrend: Green
Sideways: Neutral
Trend visualization without damaging existing bands or volume context
🔹 Recommended Timeframes
3m / 5m for scalping & intraday
Daily for higher timeframe trend structure
> “Don’t predict. Follow the trend.”

Adaptive 2-Pole Trend Bands [supfabio]Adaptive 2-Pole Trend Bands is a volatility-aware trend filtering indicator designed to identify the dominant market direction while providing dynamic reference zones around price.
Instead of relying on traditional moving averages, this indicator uses a two-pole digital filter to smooth price action while maintaining responsiveness. Around this central trend line, a multi-band structure based on ATR is applied to help traders evaluate pullbacks, extensions, and potential exhaustion areas within a trend.
Core Concept
The indicator is built around three key ideas:
Digital Trend Filtering
Volatility-Adjusted Bands
Trend Persistence Measurement
These components work together to separate meaningful price movement from noise and to provide context for how far price has moved relative to recent volatility.
Two-Pole Trend Filter
At its core, the indicator uses a two-pole smoothing filter, which produces a cleaner trend curve than common moving averages.
Compared to standard averages, this approach:
Reduces market noise
Produces smoother transitions
Responds faster to genuine trend changes
Avoids excessive lag in trending markets
The result is a trend line that represents the structural direction of price, rather than short-term fluctuations.
Adaptive Multi-Band System
Around the central trend filter, the indicator plots four independent volatility-based bands, each derived from the Average True Range (ATR).
Each band represents a different degree of price extension:
Band 1: Shallow pullbacks and minor reactions
Band 2: Moderate extensions within a trend
Band 3: Strong directional moves
Band 4: Extreme extensions relative to recent volatility
Because the bands are ATR-based, they automatically adapt to changing market conditions, expanding during high volatility and contracting during calmer periods.
This makes the indicator suitable for both slow and fast markets without manual recalibration.
Trend State Detection
The color of the central filter dynamically reflects trend persistence, not just direction:
Sustained upward movement highlights bullish conditions
Sustained downward movement highlights bearish conditions
Transitional phases are visually distinct, helping identify regime changes
This logic is based on how long price has maintained directional behavior, reducing sensitivity to isolated candles or short-lived spikes.
Practical Applications
This indicator can be used as:
A trend filter for discretionary or systematic strategies
A context tool to evaluate pullbacks versus overextension
A risk reference to avoid entries in extreme price zones
A confirmation layer when combined with price action or momentum tools
It performs consistently across different asset classes, including futures, cryptocurrencies, forex, indices, and equities.
Configuration
Key parameters such as filter length, damping factor, and band multipliers are fully configurable, allowing traders to adapt the indicator to different timeframes and trading styles.
Important Notes
This indicator does not predict future price movement
It does not generate guaranteed buy or sell signals
Best results are achieved when used in combination with sound risk management and additional confirmation tools
Past behavior does not imply future performance
Disclaimer
This indicator is provided for educational and analytical purposes only and should not be considered financial advice.
Se quiser, posso:
Criar uma versão resumida para a primeira linha da publicação
Ajustar o texto para um tom mais técnico ou mais comercial
Traduzir para português mantendo o inglês como idioma principal
Revisar o título para SEO dentro da Biblioteca Pública

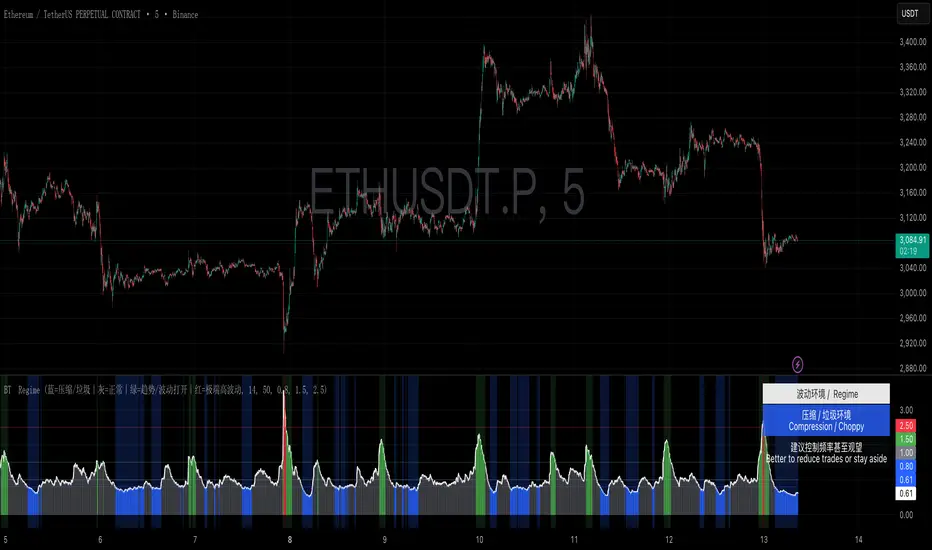
BullTrading Regime FilterBullTrading Regime Filter is an ATR-based volatility regime tool that turns market conditions into a simple color system: Compression/Choppy, Normal, Trend/Vol Open, and Extreme Volatility. It helps you trade when conditions are favorable and stay disciplined when they aren’t—trade less in compression, focus on trend setups, and reduce risk in extremes. Includes background coloring, a live regime label, and an on-chart legend—built for 3m/5m/15m intraday workflows.
BullTrading Regime Filter 是一款基于 ATR 波动比值的市场环境识别工具,用颜色一眼区分「压缩垃圾 / 正常 / 趋势打开 / 极端高波动」。它帮助你在该打的时候出手、在不该打的时候克制:压缩少做,趋势重点做,极端降杠杆控风险。支持背景着色、当前环境标签与固定颜色图例,适配 3m/5m/15m 日内节奏。
Adaptive Signal IndicatorAdaptive Signal Indicator
Overview
The Adaptive Signal Indicator is a multi-timeframe confirmation system designed to help traders and investors identify potential entry and exit points. It automatically adjusts its analysis timeframes based on your chart's timeframe, providing consistent signal logic whether you're viewing 15-minute or weekly charts.
How It Works
This indicator combines multiple technical components that must align before generating a signal. However, the signal has a heavier weighting on price action because real investors know that "Only Price Pays." Additionally, rather than relying on a single indicator, it requires confirmation across several dimensions:
Trend Analysis — Evaluates short-term price structure using dual exponential moving averages
Wave Detection — Monitors momentum shifts using smoothed momentum calculations
Flow Tracking — Analyzes volume dynamics to confirm price movements have participation
Pulse Filter — Ensures signals align with the current directional bias of oscillator momentum
Macro Alignment — Checks higher-timeframe trend agreement before triggering signals
Drift Gate — Requires short-term trend confirmation on the daily timeframe
Cross Detection — Identifies key moving average crossovers on the daily timeframe
Range Position — Uses volatility bands to filter signals at extreme price levels
Signal Logic
Buy signals require:
Multiple bullish confirmations across different analysis methods
Macro trend not in bearish alignment
Pulse filter confirming upward momentum
Drift gate showing bullish daily bias
Sell signals require:
Bearish momentum confirmation
Macro trend not in bullish alignment
Pulse filter confirming downward momentum
Dashboard
Two real-time tables display:
Status Panel (Top Right)
Current state of all 8 analysis components
Color-coded for quick visual assessment
Shows conditions count and last signal status with % change since signal
Statistics Panel (Bottom Right)
Total signals generated
Success rate with win/loss breakdown
Average return per signal
Average winning and losing trade percentages
Profit factor
Maximum win and loss percentages
Key Features
✓ Adaptive Timeframes — Automatically selects appropriate analysis timeframes based on your chart
✓ Multiple Confirmations — Reduces false signals by requiring agreement across different analysis methods
✓ Clear Signals — Distinct BUY/SELL markers with no ambiguity
✓ Built-in Statistics — Track historical performance directly on chart
✓ Works on Any Market — Stocks, crypto, forex, indices, commodities
✓ Clean Visual Design — Overlay design keeps your chart readable
Best Practices
Use this indicator as one component of your overall trading plan
Consider your own risk management rules for position sizing and stop losses
Backtest on your preferred markets and timeframes before live trading
Signals work best in trending market conditions (the indicator filters for trend strength)
Who This Is For
Traders who prefer a systematic approach with clearly defined entry conditions. Suitable for swing trading and position trading timeframes. The multi-confirmation requirement means fewer signals, but each signal has passed multiple filters.
Note: Past performance shown in the statistics panel is based on historical data and does not guarantee future results. This indicator provides analysis tools to support your trading decisions—it is not financial advice. Always use proper risk management

Session Range Control [PointAlgo]Session Range Control (SRC)
The Session Range Control (SRC) indicator provides a structured view of intraday price behavior by tracking where the current price sits within the session’s high–low range and how today’s volatility compares to the Average Daily Range (ADR). It combines range analytics, momentum context, volatility interpretation, and visual cues to help traders understand session strength and shifts in intraday conditions.
Core Concept
Every trading session forms a unique high and low. SRC continuously reads these values and calculates the Position in Range, expressed on a scale from 0% to 100%:
0% → Price at Day Low
100% → Price at Day High
50% → Mid-range equilibrium
By normalizing price into a percentage, traders can quickly interpret where market pressure is concentrated during the session.
Trend Zones and Market State
SRC divides the range into logical zones to show the likely sentiment of the session:
1. Strong Uptrend Zone (Above Threshold)
When price consistently holds above the user-defined upper threshold (e.g., 60%), the indicator marks a Strong Uptrend.
This typically reflects:
Persistent intraday buying pressure
Price acceptance near the upper part of the range
Reduced likelihood of deep pullbacks
2. Strong Downtrend Zone (Below Threshold)
When price remains below the lower threshold (e.g., 40%), SRC signals a Strong Downtrend, indicating:
Dominant intraday selling
Consistent pressure keeping price near session lows
3. Bullish / Bearish Zones
Between the midline and strong thresholds, SRC displays softer trend zones:
Above 50% = Bullish Zone
Below 50% = Bearish Zone
These zones help classify whether price is trending, balanced, or drifting.
4. Neutral Territory
When price hovers around the mid-level without conviction, the indicator treats it as a neutral or undecided phase.
Signal Logic :
SRC includes built-in momentum shift signals based on range transitions:
Long Signal
Triggered when price crosses upward through 50%, often showing:
A shift from intraday weakness to strength
Buyers gaining control of the session
Short Signal
Triggered when price crosses downward through 50%, suggesting:
Loss of intraday strength
Sellers taking control
These signals help highlight potential turning points inside the session.
Extreme Levels :
SRC highlights the top and bottom 10% of the range:
> 90% = Extreme High (Overbought intraday condition)
< 10% = Extreme Low (Oversold intraday condition)
These conditions can be useful for identifying overextended movements or potential reaction zones.
ADR Comparison and Volatility Context :
The indicator also measures how today’s price range compares to the Average Daily Range (ADR):
Range Expanding: Today’s range is significantly larger than the ADR
Indicates heightened volatility
Often associated with trending or breakout environments
Range Compressing: Today’s range is much smaller
Suggests low volatility
Common before breakout phases
Characteristic of consolidation or balanced markets
This volatility context helps traders assess whether the session is behaving within normal boundaries or deviating significantly.
Dashboard Overview :
When enabled, the dashboard summarizes key intraday metrics in a structured table:
Trend status (Strong Uptrend, Strong Downtrend, Bullish, Bearish, Neutral)
Range position (%)
Signal status (Long Cross, Short Cross, Extreme High/Low, or None)
Day range calculation
Range vs ADR (%)
Day High / Day Low
Current price level
Simplified action label based on current conditions
This provides a quick reference system to interpret both trend and volatility at a glance without analyzing the full chart visually.
Visual Elements
SRC includes:
Colored dynamic plot for easy trend recognition
Horizontal reference lines at key levels (0%, 50%, 100%, strong-trend thresholds)
Background shading during extreme zone conditions
A separate ADR comparison plot
These visuals ensure the indicator remains intuitive regardless of chart style or timeframe.
Alerts
The script includes alert conditions for:
Long cross
Short cross
Strong trend detection
Extreme high / extreme low
These allow users to automate notifications during key market events without manually monitoring the chart.
Customization Options
Users can configure:
ADR length
Strong trend thresholds
Dashboard visibility
Dashboard position on chart
This makes SRC adaptable to different trading instruments and intraday styles.
Usage Notes
Works best on intraday timeframes where session boundaries are clearly defined.
Designed for analytical interpretation—trend bias, volatility phase, and range structure.
Can complement other tools such as moving averages, volume, or market structure analysis.
Disclaimer :
This indicator is intended for chart analysis and educational purposes only.
It does not generate financial, investment, or trading advice.
Users should validate signals with additional research and apply proper risk management.

MAJOR PA Zones + Structure + Targets (Gray/Purple)This script highlights major price-action structure (HH/HL/LH/LL), marks BOS/CHOCH events, and draws key supply/demand zones to help visualize trend shifts and potential targets.

BALANCED Strategy: Intraday Pro + Smart DashboardWelcome to the BALANCED Strategy: Intraday Pro.
This all-in-one indicator is designed for Intraday traders looking to capture trend movements while effectively filtering out sideways market noise. It combines the power of Supertrend for direction, EMA 100 for the baseline trend, and rigorous validation via RSI and ADX.
The script also integrates a complete Risk Management system with targets based on the Golden Ratio (Fibonacci) and a real-time Dashboard.
⏳ Recommended Timeframes
This algorithm is optimized for Intraday volatility:
M5 (5 Minutes) ⭐️: Ideal for quick Scalping. The ADX filter is crucial here to avoid false signals.
M15 (15 Minutes) 🏆: The "Sweet Spot." It offers the best balance between signal frequency and trend reliability.
M30 / H1: For a "Swing Intraday" approach—calmer, fewer signals, but higher precision.
Not recommended for M1 (1 Minute) with default settings (too much noise).
🚀 How It Works
The algorithm follows a strict 3-step logic to generate high-quality signals:
1. Trend Identification (The Engine)
Supertrend: Determines the immediate direction.
EMA 100: Acts as a background trend filter. We only buy above and sell below the EMA.
2. Noise Filtering (Safety)
ADX (Average Directional Index): The signal is only validated if there is sufficient volatility (Configurable threshold, default 12) to avoid "chop markets" (flat markets).
RSI (Relative Strength Index): Strict momentum filter. Buy only if RSI > 50, Sell if RSI < 50.
3. Entry Confirmation (The Trigger)
The script doesn't just rely on a crossover. It waits for "Price Action" confirmation: the candle must close higher than the previous one (for Long) or lower (for Short) to validate the entry.
🛡️ Risk Management (Money Management)
This is the core strength of this tool. Upon signal validation, the script automatically calculates and plots:
Stop Loss (SL): Based on volatility (ATR). It places the stop at the recent Low/High with a safety padding.
Take Profit (TP): Two modes available:
Fibonacci Mode (Default): Targets the 1.618 extension (Golden Ratio) of the risk taken.
Fixed Ratio Mode: Targets a manual Risk/Reward ratio (e.g., 2.0).
📊 The Dashboard
Located at the bottom right, the smart dashboard provides vital info at a glance:
Signal Time: To check if the alert is fresh.
Type (LONG/SHORT): Color-coded (Green/Pink).
Tech Data: RSI and ADX values at the moment of the signal.
Exact Prices: Entry Level, Target (TP), and Stop Loss (SL).
⚙️ Configurable Settings
Sensitivity: Adjust the Supertrend factor (Default 2.0).
Filters: Toggle the RSI filter ON/OFF or adjust the ADX threshold.
Execution: Choose between Fibonacci Target (1.618) or a Manual Ratio.
⚠️ Disclaimer: This tool is a technical decision aid and does not constitute financial investment advice. Always use prudent risk management and backtest the indicator on your preferred assets before live use.

MACD ultimate with EMA overrideOverview
This Pine Script v5 indicator combines MACD zero-cross signals, SuperTrend trend validation, an EMA(50/200) trend filter and an EMA-crossover override to produce clean, session-constrained entry signals and robust exit logic. It draws labels and lines on the chart (entries, exits, SL lines) and supports alerts. Stop-losses use percentage-based sizing and are evaluated on bar close only to avoid intrabar noise.
Key features
Primary entry rule (MACD zero-cross):
Buy when MACD line crosses above zero (current bar MACD > 0 and previous bar MACD < 0).
Sell when MACD line crosses below zero (current bar MACD < 0 and previous bar MACD > 0).
Session-only entries: Entries are generated only inside a user-defined session (e.g., 09:30-11:30). Exits are evaluated at all times.
SuperTrend validation: Optional SuperTrend filter for entries and exits. Can be configured so exits require both MACD exit and SuperTrend flip (AND mode) or use OR mode.
EMA trend filter for entries: Optional EMA(50) vs EMA(200) filter — when enabled the indicator will only open buys in EMA-up trend and sells in EMA-down trend.
EMA crossover override (priority rule): If EMA fast crosses the slow:
EMA50 crosses above EMA200 → forced BUY override (bypasses session, SuperTrend, MACD). Exits any active short and opens long.
EMA50 crosses below EMA200 → forced SELL override (bypasses other validations). Exits any active long and opens short.
Overrides respect same-direction protection (won’t reopen an existing same-side position).
Opposite-entry immediate exit: When an opposite-direction raw entry (MACD zero-cross) occurs, any active opposite trade is exited immediately (then the script may open the opposite entry subject to entry validation). Same-direction repeated signals do not force an exit.
Stop-Loss (percentage): Parameterized SL (%) applied at entry; SL is checked and triggered only on bar close (e.g., long SL triggers if barstate.isconfirmed and close <= SL).
Labels & SL lines: Single-line, non-repainting labels for entries/exits; SL horizontal line drawn on open positions and greys out after closing.
Plots & visuals:
MACD panel (histogram, MACD, signal) optional.
SuperTrend plotted as a single color-coded line: green for bullish, red for bearish (no dots).
Optional EMA( fast / slow ) plots.
Entry markers (triangles) shown only for session-filtered entries.
Alerts: Entry and exit alerts are included and can be toggled on/off.
Inputs (high level)
MACD: fast, slow, signal lengths.
SL (%) and toggle to enable/disable SL.
SuperTrend: ATR length, multiplier; toggles: require for entry, allow/require for exit, show/hide.
EMA trend: enable/disable filter; fast/slow lengths; show/hide EMAs.
EMA override (built-in) — crossover detection triggers forced entry/exit.
Session: time range (HHMM-HHMM) — applies to entry generation only.
Misc: allow multiple entries flag, enable alerts, show/hide MACD panel.
Behavioral notes & caveats
The indicator is an overlay indicator (not a strategy()), so it draws visual signals and alerts but does not place real trades — use strategy() conversion to backtest trade P&L.
EMA override bypasses all validations by design — it forcibly exits the opposite side and opens the override side immediately (on the same bar). This is intentional to capture major trend flips.
SL is checked on bar close only. That reduces false SL triggers from intrabar spikes but means realized fills can differ in live trading depending on execution and slippage.
Opposite-entry exits are immediate (no SuperTrend/MACD requirement) except when a crossover override is the cause — the script guards so EMA overrides take precedence.
Pine Script runs on bar close for most accurate signals; intrabar behavior depends on your chart settings (realtime vs historical) — expect small differences between indicator labels and broker fills.
Plot/label density: many labels and SL lines can clutter the chart on lower timeframes. Consider hiding SL lines after N bars (optional enhancement) or use higher timeframe charts for less clutter.
Suggested default settings
MACD: 12, 26, 9
SL: 1.0 (%) with Use SL = on
SuperTrend: ATR 10, Multiplier 3.0, require for entry = true, require for exit = true (AND mode)
EMA trend filter: enabled (50/200)
Session: 0930-1130 (adjust to your exchange/timezone)
Alerts: on
How to use
Paste the full Pine v5 script into TradingView’s Pine Editor and add to chart.
Set the trade_session to the market hours you want entries in (chart timezone should match your intended exchange).
Toggle Use EMA trend / Require SuperTrend / Require ST for exit depending on how tight you want validation.
Use strategy() conversion before backtesting to verify the rules produce acceptable historical returns (indicator-only won’t generate P&L).
Recommended next steps
Convert to a strategy() script to backtest and measure win rate, drawdown, profit factor, and to validate the SL-on-close logic with realistic fills.
Add an input to auto-hide SL lines after N bars or compress labels to a compact trade status box.
Consider adding ATR- or volatility-based SL as an alternative to percentage SL.

JH MantraBAND-C + AlphaWave Signals v1.3 (Clean)AlphaWave는 추세 + 눌림 + 반전을 하나의 흐름으로 묶은 트레이딩 시그널입니다.
• 20 HMA 기반 추세 판단
• 변동성 밴드 구간(상·하단)에서의 눌림/되돌림 포착
• 과도한 신호를 줄이고 확률 높은 구간만 표시
권장 타임프레임:
- 3분 / 5분 (단타, 스캘핑)
- 일봉 (추세 확인용)
※ 이 지표는 신호 남발을 피하고,
‘기다렸다가 들어가는 매매’를 목표로 설계되었습니다.
AlphaWave is a trend-following indicator designed to capture pullbacks and reversals within volatility zones.
• 20 HMA based trend structure
• Upper / lower volatility bands for context
• Filtered signals to reduce noise
Best used on:
- 3m / 5m intraday charts
- Daily charts for trend confirmation
This indicator focuses on patience and high-probability setups.