Trend Volatility Tops and Bottoms
Big Picture:
Overall what this script try's to capture is bounces off of moving trend lines.
What you will see when using this script
one Green line, one red line, two gray lines and circles in colors blue, green, red, and purple.
RED AND GREEN LINES:
There are two trend lines, an upper and a lower line that are 1 to 2 standard deviations from the linear regression line formed by the closing price for a look back period. The green is the distance from the close price and the lower line. The red is the list from the close and the upper line. (you don't see the lower and upper lines, but yo do see the green and red lines)
The goal is too easily see when price is approaching those support and resistance levels.
GRAY LINES:
GRAY lines are a form of volatility metric. GRAYS represent the distance from the RED and GREEN lines talked about above. low volatility mean the two GRAY lines will be close and times of high volatility will be father apart.
COLORED CIRCLES:
the color circles represent possible bounce zones, when price is high or low for for a given time period.
PURPLE is caution that there could be a possible price drop
RED is a critical zone for rejection and price drop
BLUE is caution that there could be a possible price increase
GREEN is a critical zone for bounce and price increase
how its used
feel free to play around and Try new things but, how its intended to be used is on 4hr time Frame looking for longer term trends on assets that tend to be less volatile on average.
settings
some settings:
buy deviation, this will say how many standard deviations do you want the lower bounce line to be from the linear regression line
sell deviation, this will say how many standard deviations do you want the upper bounce line to be from the linear regression line
dist to zero buy: how close dose the price has to be to put out a possible bounce.
Recap
-red and purple = possible upcoming price drop... red is more critical than purple
-green and blue = possible upcoming price increase... green is more critical than blue
-use on less volatile assents and on 4hr timeframe
good luck!
Bottom

Average Total Price From BottomThis is an indicator to help determine where the bottom of the market is currently based on the average close of the previous cycle. This is an idea from @Jay_DCA on YouTube and I thought it would be fun to code. Enjoy!
How to use:
Specify the date at which the bottom of the markets occurred. I added two extra cycle inputs for future usability. So, when the current bottom is found of this bull cycle, make sure to change the date in Bottom 3.

M.Right_Top & Bottom Finder 1.0Thank you @Lazybear for the calculations for squeeze and BB, and all of the other great pine-coders who inspired me to create my own indicator to share!
This is the result of hours of work learning to code pine and tweaking until everything fits exactly what I was looking for.
After using it for a while and seeing the benefits personally, I figured now might be a good time to share with everyone while we are in such great market volatility, maybe I can save you some losses.
Basically, my indicator is meant to use volatility and standard deviations to show you the top and bottom of trends.
It does indeed work on lower timeframes, I typically use it on 5m, 30m, 4hr, and 1d.
What to look for:
When it detects the trend bottoming it will send a green histogram bar down, I also created a different shade green for even more likely bottoms.
When it detects the top of the trend it will send a red bar up, I have a brighter red for more certain tops.
The length of the histogram bar is also an indication as well. Sometimes there will be a reversal while still just showing the gray bar.
I just added alerts, so hopefully those work. If not, I will update.
Let me know if you have any questions, and enjoy.
Cheers!

Oscillator EdgesAnother simple script to be added on top of other indicators. Simply provides a symbol of varying color depending on the value of the oscillator. Allows up to 4 different colors in each direction. Includes alerts conditions. Demonstration is the indicator being applied to the RSI (purple) included in Market Cipher B.
To use, simply add it to your indicator, and choose and oscillator of your choice in the Input Settings. Alternatively, you can just keep it on 'close' and use the built in RSI. Or, you can use the RSI formula on top of something else (if that's your thing).
The names are silly, so I hope this is okay with all of you.
Let me know what you think, and if there are any problems, questions, or concerns!

Divergence HunterThis script searches multiple divergences based on the wave trend indicator
You could combine support and resistance to identify with the bearish divergence a Potential Top.
Bullish divergence on the other hand could indicate that the market found its bottom and you should keep your eye open for an long entry.
If you are already short and took some profit the hidden bearish divergence could indicate a continuation of the downtrend. Could also be used together with Fib-Retracement to find a reentry or an add for your current entry.
Hidden bull divs could be used to find a reentry in the current up trending move or of course could be used as and add for your current position.
If you want to try it or have questions leave me a message.
DISCLAIMER: No sharing, copying, reselling, modifying, or any other forms of use are authorized for the documents, script / strategy, and the information published with them. This informational planning script / strategy is strictly for individual use and educational purposes only. This is not financial or investment advice. Investments are always made at your own risk and are based on your personal judgement. I am not responsible for any losses you may incur. Please invest wisely.
Price Range TableThe table shows the ranking of the price as a percentage relative to the past candles.
100 ~ highest price of the time frame
0 ~ lowest price of the time frame

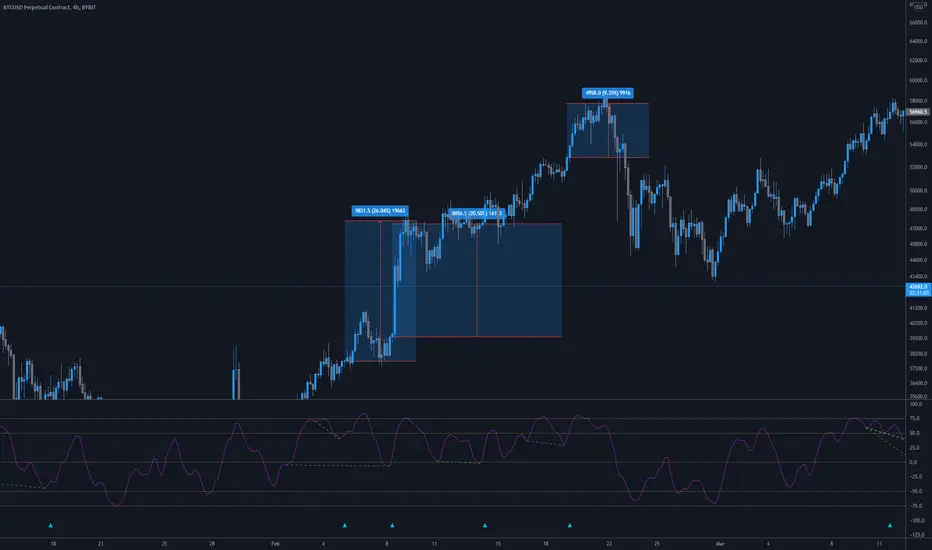
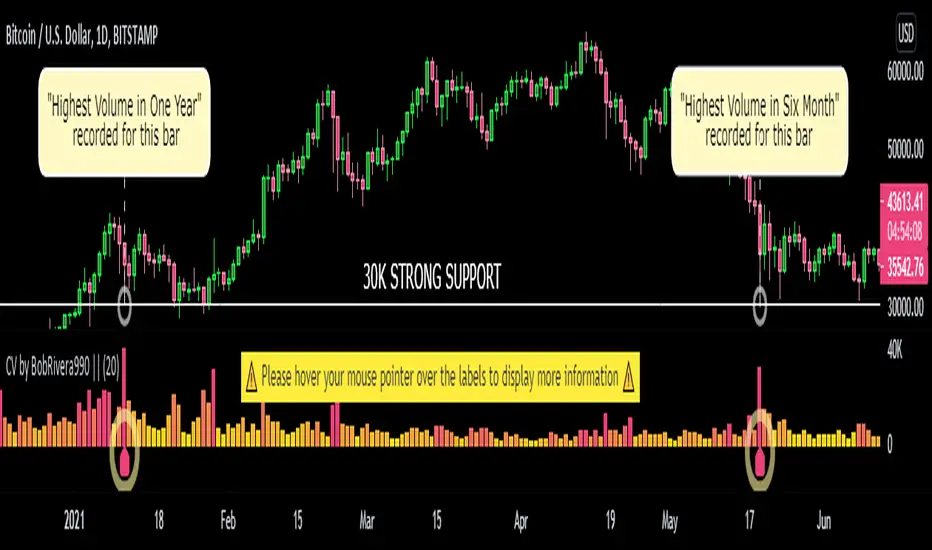
Custom Volume - Periodic Peaks & Troughs + AlertThis script is a custom volume indicator with additional features.
But why is this useful?
The minimum and maximum volumes, in different time periods, are displayed by labels below the bars. I call them "Peaks" and "Troughs".
Hover your mouse cursor over the labels to see more details.
These parameters are widely used in technical analysis.
If traders want to confirm a reversal on a level of support–or floor–they look for high buying volume. Conversely, if traders are looking to confirm a break in the level of support, they look for low volume from buyers.
If traders want to confirm a reversal on a level of resistance–or ceiling– they look for high selling volume. Conversely, if traders are looking to confirm a break in the level of resistance, they look for high volume from buyers.
For example, take a look at the chart.
Settings menu parameters
{Dialog Box} =>
Parameter to show / hide the dialog box.
{Visual Parameters} =>
Parameters to personalize the appearance of the indicator.
{ Alert Conditions Part 01: Peaks ⏰ "} =>
Parameters to customize the alert.
{ Alert Conditions Part 02: Troughs ⏰ "} =>
Parameters to customize the alert.
{Volume MA} =>
Moving average settings
How to use alerts
Note that by creating an alert, an instance of the indicator, with all your settings, will be activated on the site's server and alerts will be triggered by it.
After that, changing the indicator settings on the chart will no longer affect the alert.
Open the settings window and select the alert conditions as you wish
Click the Create Alert button (or press the A key while holding down the ALT key)
In the Condition section, select the name of the indicator.
Make the rest of the settings as you wish.
Finally, click on the Create button.
It's finished. After a few moments, your alert will be added to the Alerts menu.
Limits
The labels are displayed after the bars close.
Labels are displayed for the last 10,000 bars.
References: Investopedia
Boom HunterEvery "boom" begins with a pullback... This indicator will help traders find bottoms and perfect entries into a pump. It combines two indicators, Dr. John Ehlers Early Onset Trend (EOT) and the infamous Stochastic RSI. The indicator features a built in dump and dip detector which usually picks up signals a few candles before it happens. The blue wave (EOT) shows trend, when waves travel up so does the price. Likewise for the opposite. Low points are revealed when EOT bottoms out and flat lines. Traders can then use the Stochastic RSI crossover to enter a trade. As the EOT lines get closer together there is more movement in price action, so as they get wider traders can expect sideways action. This indicator works on all timeframes but has had excellent results on hourly chart.
Entry zones are marked with a green dot at top of indicator. This signals a bottom is being formed and traders should look for an entry.
Exit points are marked with a red dot at top of indicator. This signals a peak and great time to exit.
Dips and dumps are indicated in red at bottom of indicator.

Bitcoin Price Bottom IndicatorThis Indicator flashes up on bottoms of each Bitcoin market cycle. It’s suggesting, that the price of BTC finds strong support at the 200W SMA . Thats why it’s not flashing up in the first cycle, because there was not enough price data at that moment.
This Indicator uses price data from the weekly timeframe so for the best experience USE WEEKLY TIMEFRAME .

Stochastic RVIBased on the Stochastic RSI but uses RVI (Relative Volatility Index) as source. Another great tool for finding market lows and entry points. This oscillator is also good for finding accurate diversions.

StochasticLSMAIntroducing the worlds first StochasticLSMA. A powerful Stochastic that shows trends and highlights market tops/bottoms. This may be the ultimate tool in locating tops and bottoms on any timeframe.
How to tune the settings:
Depending on what chart you use and what timeframe you are on it may be necessary to dial in the settings to correctly locate the tops and bottoms you wish to trade. Here are some settings to try:
32 < Finds longer term Tops and bottoms.
21 < Great for longer term tops and bottoms on hourly and daily charts.
19 < If 21 is not accurate enough.
17 < If 19 is not accurate enough.
13 <Great setting for short to mid range tops and bottoms and lower timeframes. (default)
11
9
6 < Excellent for finding shorter term tops and bottoms on all timeframes.
*Changing the “Stochastic Price” setting to “hl3” or “low” can help hone in on lows and highs.*
It can be very useful to to use 2 StochasticLSMA indicators with different settings. Here we have two examples how to use multiple indicators on the ETHUSD Daily chart. One set on 13 and the other on 6. A trader can enter on the 6 length indicator and exit on the 13. It also shows how it has the potential to filter out “bad entries” by matching the bottoms.
Example of different length settings.
Alerts:
Overbought: K line crosses over overbought line (Red Dot)
Oversold: K line crosses under oversold line (Green Dot)
Buy Signal: K line is under oversold line and trends up (Green Up Arrow)
Sell Signal: K line is over oversold line and trends down (Red Down Arrow)
Last Chance Sell Signal: As K line leaves overbought line (Yellow Dot)
Last Chance Buy Signal: As K line leaves oversold line (Yellow Dot)
Example of alert signals and trigger enabled in settings

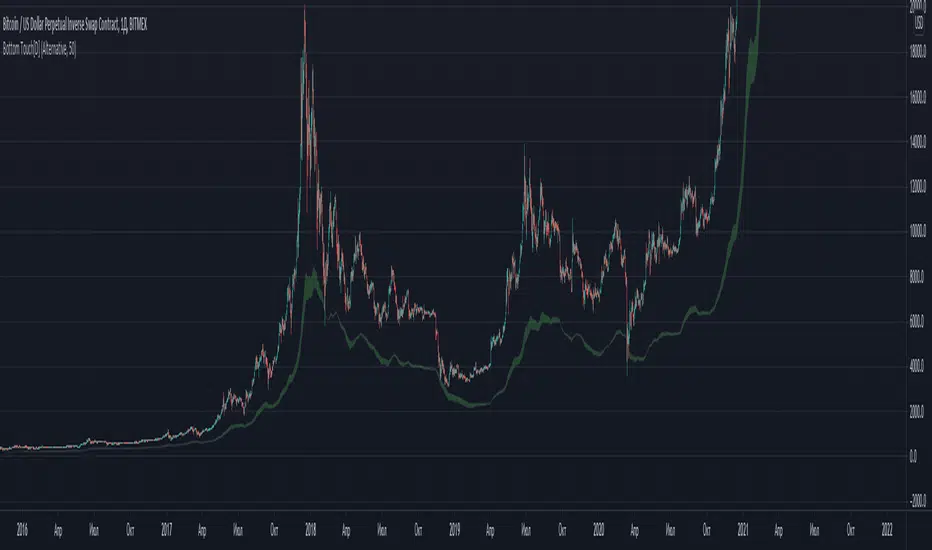
Bottom Touch[Dizart]--------------- ---------------
The indicator determines the bottom in the market, from which a rebound or a global reversal may start with a high probability. Works on any symbol or market.
tuning - If the asset is low volatility, then the price often does not reach the bottom. Adjust the `Bottom Touch` to the closest bottom on the graph.
--------------- ---------------
Индикатор определяет дно на рынке, от которого с большой вероятность может начаться отскок или глобальный разворот. Работает на любом символе или рынке.
tuning - Если актив низковолатильный, то цена часто не доходит до дна. Отрегулируйте `Bottom Touch` до ближайшего дна на графике.
Chameleon indictor ║Tops and bottoms- This indicator uses a modified type of ADX, that offers a cleaner layout and improved signals. The indicator can be used by traders to identify possible tops, bottoms and changes in trends
- If the purple line moves downward after having been inside of the red line signals that a security possibly can have reached the bottom
- If the purple line moves upward after having been inside of the green line signals that a security possibly can reached the top
- The middle acts as a confirmation of the signal
// I have drawn lines on the chart to give examples of what the signals look like

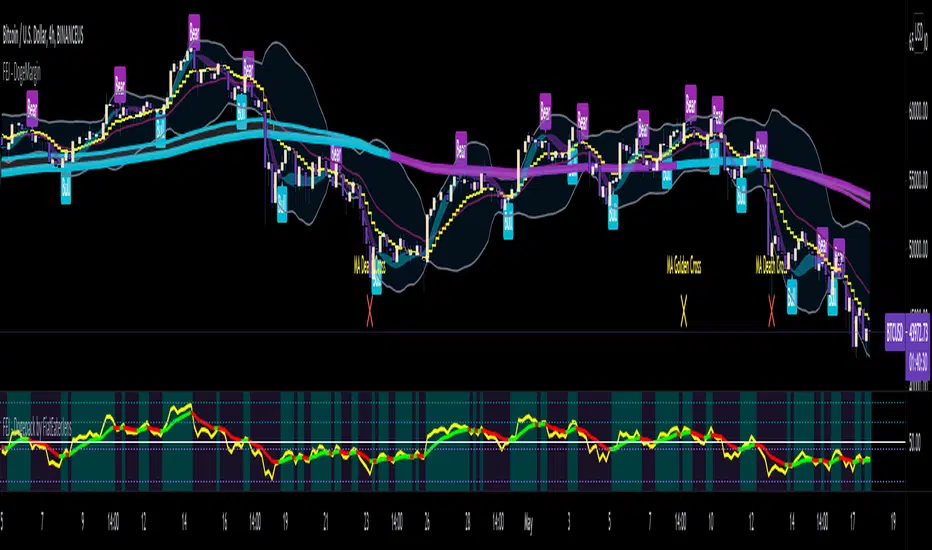
FAJ Dogepack Combines EMA + RSI indicator
Dieses Script ist eine einfache Kombination aus RSI und EMA.
Es erlaubt euch zu erkennen in welche Richtung der Trend in dem aktuellen
TimeFrame geht und wie stark dieser aktuell ist.
Außerdem zeigt es euch ob gerade eher die Bullen oder die Bären den Markt
dominieren. Mit Hilfe des Indikators lassen sich Top und Bottom des aktuellen
Time Frames erkennen.
Ich Empfehle nur eine Nutzung bei BTC um Wellen besser zu erkennen.
Erinnert euch daran, das ist nur eine Beta und gibt immer noch viele Fehlsignale aus, also testet es für euch selber in verschiedenen TimeFrames.
This script is a simple combination of RSI and EMA.
It allows you to see in which direction the trend is going in the current
time frame and how strong it is currently. It also shows you whether the
bulls or the bears are dominating the market. With the help of the indicator,
the top and bottom of the current time frame can be recognized.
recommended only use in BTC to better detect waves.
remember that it is in beta and still sends many false signals so you have to test it well in several time periods.
Top and BottomThe function of this indicator is to make regions that form top and bottom patterns visible.
Especially beginners, do not know the real formation of a top or bottom. Some taking information only for maximum and minimum.
● The main characteristic of forming a top is to have the current maximum (1) less than the previous maximum (2) and the previous maximum (2) greater than the maximum previous to yours (3).
● The main characteristic of forming a fund is to have the current minimum (1) greater than the previous minimum (2) and the previous minimum (2) less than the minimum prior to yours (3).
These are the main characteristics for forming a top and bottom.
When you know where the top or bottom is, it will help you with the use of Fibonacci and also with breakouts.
Alert: To have the graphic design of the indicator you need to have 3 candles. If the previous maximum is broken, you can remove the drawing. The same goes for the bottom. It can form a new top or bottom.

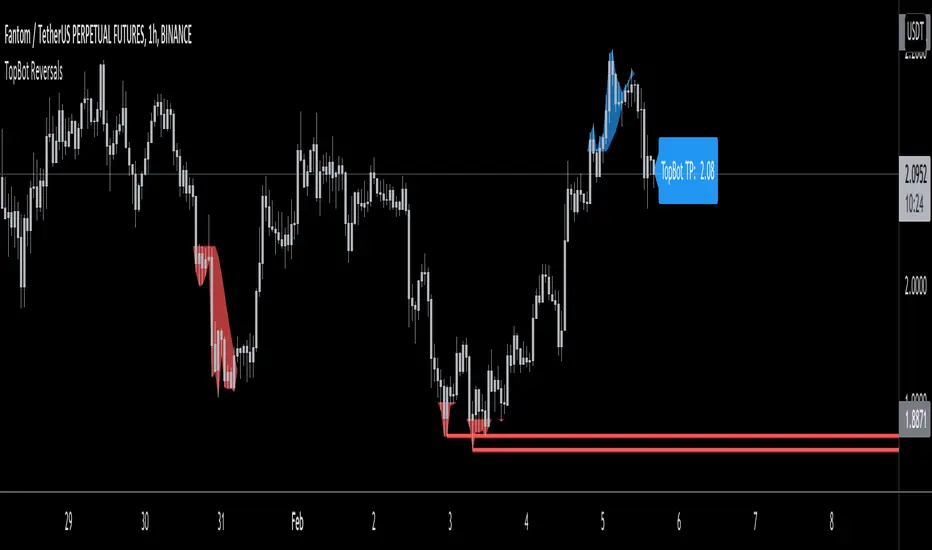
TopBot ReversalsThe TopBot Reversal indicator utilizes exhaustion and historical price levels to draw a possible recent top and bottom level. Using these lines together with other directional indicators such as Stochastic or RSI, we can draw a conclusion to a possible reversal at these levels.
Use the link below to obtain access to this indicator.
Ethereum: Price Action Integral BandsThis indicator tries to display absolute tops and bottoms for Ethereum. The price action gets integrated with three custom functions resulting in the blue top, green mid and red bottom price action integrals. From those integral values we allow 5% deviation in up and down direction, leading to price action integral bands of some non-zero width.
Even during the liquidity crisis in March 2020 with abnormal price movements, Ethereum had no daily or weekly candle close below the support band. For longer-term trades it might be a good idea to buy ETH when price is around the red band, and temporarily sell/go short when ETH is around the blue band, although this is no financial advice and one should always cross-check with other indicators/informations.
The green mid price action integral band indicates bullish/bearish zones. When price is located above the green band, the market is in a bullish environment, if price lies below it, the market is in a bearish environment.
There's the option to plot or hide the bands individually.
These integral bands are specifically designed for the Ethereum (ETHUSD) Kraken ticker on daily (D) or weekly (W) timeframe (the indicator automatically adjusts for both those timeframes). For other assets, tickers and timeframes the functionality of this indicator cannot be guaranteed and will most probably not deliver meaningful results. If you want to use the integral bands for Bitcoin, please see my other indicator titled 'Bitcoin: Price Action Integral Bands'.
For access please contact me via DM on TradingView or on Twitter (linked in my TradingView profile and my signature).

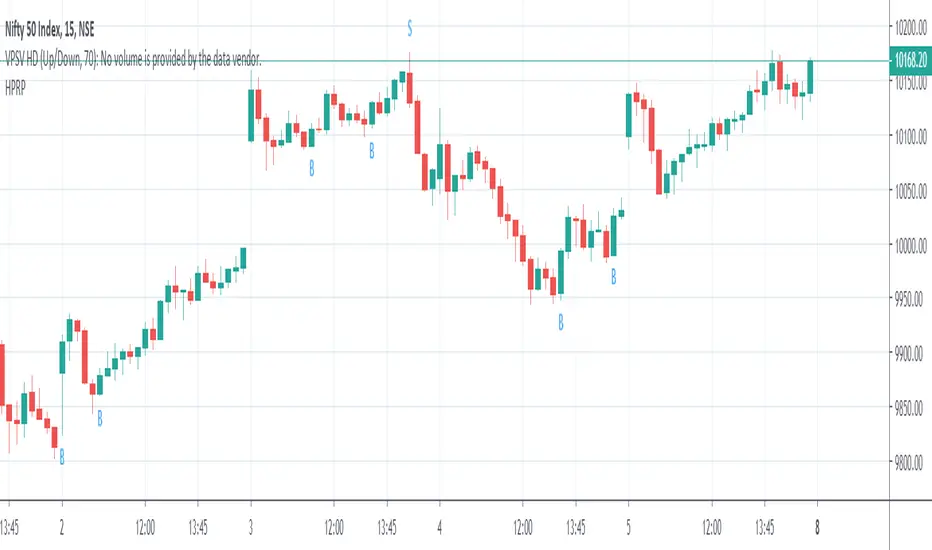
TOP BOTTOM SIGNALThis script identifies short term top and bottom in all time frames. Symbol "S" means a temporary top has been formed and Symbol "B" means a temporary bottom has been formed.
Bitcoin: Top & Bottom Mini-AlgoHere we have a mini-algorithm that tries to show absolute 4-year-cycle top and bottom zones for the case of the BraveNewCoin Liquid Index (BLX) for Bitcoin on the weekly (W) timeframe by using several oscillators as RSI, VPCI etc. employed with a custom logic. When the background gets red we might be near to a cycle peak, and when it gets green we might be near to the absolute bottom of the current cycle. Note that only absolute top/bottoms are indicated (at least since the end of 2013), so that the current strong drop in March 2020 was correctly not tagged, as it wasn't the lowest price of the current cycle.
It is best to combine this mini-algorithm with some of my boundary indicators for BLX, e.g. "Bitcoin: Price Action Integrals", for confluence . For the next peak one could then watch for the mini-algo to go red and for the price to hit the boundary. You can change the background transparency if you like to have this indicator be more unobstrusive on the chart.
For access please contact me via DM on TradingView or on Twitter (linked on my TradingView profile and my signature).

Cyatophilum Double Top & Bottom [ALERTSETUP]Private Indicator
Version Alpha
The indicator is subject to changes.
This indicator's goal is to help automatically find double top and double bottom patterns.
Its core algorithm uses purely price action and does not use any kind of overbought/oversold oscilator.
To be validated, a double top/bottom must be preceded by a simple top/bottom.
Parallel Channels
To be validated, a double top/bottom must be inside the top/bottom parallel channel. Channels will expire after some time. A channel's range is automatically calculated when changing timeframe or symbol. Channels can be used to trade breakouts after a double top/bottom happened.
Alerts
This indicator allows to create automated alerts in order to receive signals for an event. The available alerts are:
Double Bottom
Double Top
Simple Bottom
Simple Top
Send me a message if you would like to help me test the indicator.

Highs & Lows of Last [x] Bars===========
Highs & Lows of Last Bars
===========
We have found this indicator invaluable over the past few years - whether you prefer to trade Crypto, Forex, Commodities or something else this indicator could prove really useful. It's always nice to know the highs and lows of the last Week or Month, the problem being the information is only really relevant at the start or end of that chosen time period; throughout the mid-section of that time period the chart will either be displaying irrelevant information or info that has been/is being re-painted. Not good!
Our Highs & Lows of Last Bars Indicator will remove this re-painting problem and display up-to-date information from higher time frames without compromising the integrity of your current chart period.
-----------
Most high & low finder indicators will use, (for example), a 'W' or 'M' as their higher TF to get HTF results - we do things just a little bit differently, it's like this:
Most other High/Low Indicators:
~ MON 1st (get high/low value from 'W' TF) ~
~ MON 8th (get new data and plot from 'W' TF)
etc. - This leads to gaps in the data, re-painting and missing lots of potential mid-week trades.
Our High & Low of Last Bars:
~ MON 1st (get high/low value from LAST 7 DAYS) ~
~ TUE 2nd (get high/low value from LAST 7 DAYS) ~
etc.
This provides a much smoother High/Low plot with more relevant information. You can clearly see areas of support and resistance, updated on the LTF chart using data from a HTF.
Because we've included 2 TF's you can use simultaneously you can see when the lower TF touches the Higher TF this (generally, but not always!) means there's a breakout coming!
Hope this is useful to you guys!
Good Luck and Happy Trading!

Bitcoin: Price Action Integral BandsThis indicator tries to display absolute tops and bottoms for Bitcoin. The price action gets integrated with two custom functions resulting in the blue top and red bottom price action integrals. From those integral values we allow 5% deviation in up and down direction, leading to price action integral bands of some non-zero width.
Even in the current liquidity crisis with abnormal price movements, Bitcoin had no weekly candle close below the support band. One thing to note is that in the here presented model, up until now only one single weekly candle touches the blue band in each of Bitcoin's cycles. For longer-term trades it might be a good idea to buy BTC when price is around the red band, and sell/go short when BTC is around the blue band, although this is no financial advice and one should always cross-check with other indicators/informations.
There's the option to plot or hide the bands individually.
The integral bands are specifically designed for the Bitcoin BLX (BraveNewCoin Liquid Index) ticker on weekly timeframe. For other assets, tickers and timeframes the functionality of this indicator cannot be guaranteed and will most probably not deliver meaningful results.

Cracking Cryptocurrency - Bottom FeederThe Bottom Feeder
The Bottom Feeder is designed to algorithmically detect significantly oversold conditions in price that represent profitable buying opportunities. Combining this with it’s unique Stop and Target System, the Bottom Feeder is designed to return consistent return with minimal draw down. Whether used as a Market Bottom Detector or as a system for executing safe, profitable mean reversion trades, the Bottom Feeder is a powerful tool in any trader’s arsenal.
Bottom Feeder was designed to be used on BTCUSD , however it is also effective on other USD/USDT pairs. One will have to check the individual pair they wish to trade with the Strategy Tester to simulate performance.
Options
Let’s go through the input options one by one, so that you are able to comfortably navigate all that this indicator has to offer. The link below will display a picture of the layout of the settings for your convenience.
For the sake of simplicity, let’s note now that all settings marked **Conservative Mode** will not work in Aggressive Mode.
Mode: Determines how aggressively Bottom Feeder generates a buy signal. In Conservative Mode, trades can only be opened once per candle and the stop and target will update as new signals appear. In Aggressive Mode, a separate trade is opened each time Bottom Feeder signals, which may be multiple times within one Daily candle.
Plot Target and Stop Loss: Toggles on/off the visualized take profit and stop losses on the chart.
**Conservative Mode** TP Multiplier: This is an input box, it requires a float value. That is, it can accept either a whole number integer or a number with a decimal. This number will determine your Take Profit target. It will take whatever number is entered into this box and multiply the Average True Range against it to determine your Take Profit.
**Conservative Mode** SL Multiplier: See above - this will modify your Stop Loss Value.
**Conservative Mode** Average or Median True Range: This is a drop-down option, the two options are Average True Range or Median True Range. If Average True Range is selected, then this indicator will use the Average True Range calculation, that is, the average of a historical set of True Range values to determine the Average True Range value for Target and Stop Loss calculation. If Median True Range is selected, it will not take an average and will instead take the Median value of your historical look back period.
**Conservative Mode** True Range Length: This is an input that requires an integer. This will represent your historical look back period for Average/Median True Range calculation.
**Conservative Mode** True Range Smoothing: This is a drop-down with the following options: Exponential Moving Average ( EMA ), Simple Moving Average ( SMA ), Weighted Moving Average ( WMA ), Relative Moving Average (RMA). This will determine the smoothing type for calculating the Average True Range if it is selected. Note: if Median True Range is selected above, this option will not have any effect as there is no smoothing for a Median value.
**Conservative Mode** Custom True Range Value?: This is a true/false option that is false by default. If enabled, it will override the Average/Median True Range calculation in favor of a users custom True Range value to be input below.
**Conservative Mode** Custom True Range Value: This is an input box that requires a float value. If Custom True Range is enabled this is where a user will input their desired custom True Range value for Target and Stop Loss calculation.
Stop and Target Description
Because Bottom Feeder is designed only to scalp the various market bottoms that can appear over time in the market and not to identify trends or to trade ranges, it’s imperative that the indicator notify us not just to when to enter our trades, but when to exit! In the service of that, CC Bottom Feeder has a built in Stop and Target system that tracks and displays the stop loss and take profit levels of each individual open trade, whether in Aggressive or Conservative Mode.
Conservative Mode Targeting: In Conservative Mode, Bottom Feeder signals are aggregated into a compound trade. The signal will appear as a green label pointing up below a candle, and will appear upon a candle close. If Bottom Feeder then generates another signal the stop loss and target price will be updated. The process will continue until the aggregated trade completes in either direction. On a trade with multiple signals, a larger position is slowly entered into upon each buy signal.
Aggressive Mode Targeting: In Aggressive Mode, Bottom Feeder signals are individually displayed as they are generated, regardless of how many signals are generated on any single candle. If Bottom Feeder continues to signal, each individual open trade will have their own stop loss and target that will be displayed on the chart until the individual trade completes in either direction. As opposed to a large compound position, aggressive mode represents a higher number of independent signals with their own stop and target levels.
Stop losses and targets are designed to be hard, not soft. That is, they are intended to be stop market orders, not mental stop losses. If price wicks through the target or stop, it will activate.
