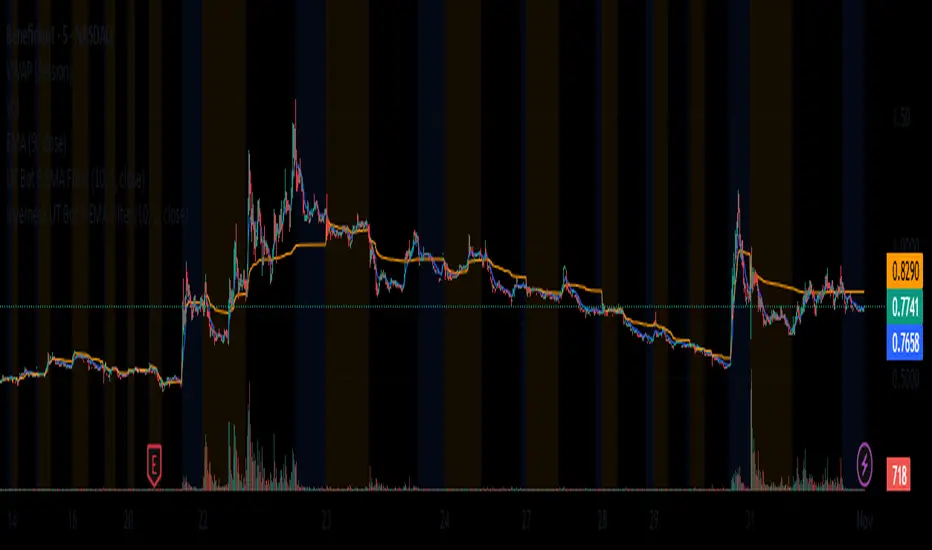
Crash Prevention OpenSource by exp3rtsOpen Source Version - no updates!
Crash Prevention OpenSource by exp3rts – Automated Exit Strategy for TradingView
This indicator allows you to automatically close positions based on dynamic price levels derived from the previous candle with a configurable offset. Perfect for risk management and automated “hard stop” exits.
Key Features:
Flexible Exit Directions: Choose to trigger exits for Long, Short, or Both directions.
Dynamic Exit Levels: Lines are automatically calculated above/below the previous candle plus/minus a user-defined offset in points.
Visual Cues: Clear arrows indicate the exact bar where price touched the exit line.
Session-Independent: Works on any chart and timeframe without manual adjustments.
Webhook Alerts: Sends JSON alerts on touch, enabling integration with external systems or bots.
Auto-Close Logic: Ensures positions are closed immediately when the threshold is breached, keeping trades in check.
How it works:
For Long exits, the line is drawn below the previous bar’s low minus the offset.
For Short exits, the line is drawn above the previous bar’s high plus the offset.
When price crosses the line, the position is closed, an arrow is plotted on the chart, and an alert is fired.
Ideal for traders who want strict stop management or automated exit conditions while keeping visual clarity on the chart.
Bot

Omni-Trend Analytics + Live PnL DashboardOverview
The Omni-Trend Analytics suite is an all-in-one technical command center. It integrates the battle-tested UT Bot signal logic with a sophisticated real-time dashboard, session tracking, and multi-timeframe trend analysis.
📊 The "Nexus" Dashboard
The heart of this script is the 6-row dynamic dashboard, designed to give you "at-a-glance" confluence:
RSI & RSI-MA: Tracks the standard RSI alongside a custom RSI-based Moving Average to spot momentum shifts before they hit the price.
Selectable Trend Status: Unlike static indicators, you can toggle the "Trend" source between EMA 9, 20, or 200 in the settings to match your trading style (Scalping vs. Swing).
Distance to EMA: Shows exactly how "overextended" the price is from your selected trend line.
ATR Volatility (Color-Coded): Turns Green when volatility is expanding (ideal for trend following) and Red when the market is contracting (ideal for range-trading or caution).
Live PnL Tracking: Automatically calculates the profit or loss of the most recent UT Bot signal in real-time.
🛠️ Key Features & Settings
Precision Signals: Combines UT Bot Buy/Sell labels with RSI "!" reversal warnings for high-probability entries.
Institutional Moving Averages: Includes 5 SMAs (including the 610 SMA) and 3 EMAs (9, 20, 200) all set to a professional Thickness 2 for clarity.
Session Highlighting: Automatically shades the background for London and New York sessions to help you trade when liquidity is highest.
VWAP Integration: Includes a purple VWAP line to ensure you are trading at a "fair value" relative to volume.
🔔 Strategic Alert Suite
The script comes pre-loaded with 6 specialized alert conditions:
UT Bot Signal: Standard entry alerts.
RSI Cross RSI-MA: Early warning for momentum reversals.
High-Prob UT + VWAP: Signals that only trigger when aligned with institutional volume.
EMA 9/20 Momentum Cross: Classic trend-shift notification.
ATR Volatility Spike: Alerts you to 50% increases in market volatility.
PnL Target / Break-Even: Pings you when your live trade reaches a user-defined profit threshold.
💡 Trading Pro-Tip
The Convergence Strategy: Look for a UT Bot Buy signal that occurs during the London/NY Overlap while the ATR is Green (expanding) and the RSI is crossing over its RSI-MA. This "triple confluence" is the primary design intent of the Omni-Trend suite.

VWAP SESSION BUY SELL STRATEGY (INDICATOR) (PDK1977)VWAP SESSION BUY SELL STRATEGY (INDICATOR) (PDK1977)
This indicator combines the proven UT Bot breakout engine but with VWAP directional filtering and ATR-based take profit levels.
It delivers clean, high-probability trend entries and automatic volatility-calibrated exits.
How it works:
Buy only when price is above VWAP
Sell only when price is below VWAP
UT Bot confirms momentum with ATR-based trailing logic
ATR Take Profit gives consistent exits based on volatility
Bars turn green/red only while in a trade, back to normal after TP
Best For:
Intraday and swing trading
Indices, FX, crypto, and high-volume stocks but also for Forex with right TF and settings
Traders who want clean signals and minimal noise
2. Trade Checklist:
Use this before every entry. Quick, simple, reliable.
BUY Checklist:
Price confirmed above VWAP
Label prints BUY
Enter on Buy label (on bar close)
→ Hold until ATR TP hits
SELL Checklist:
Price below VWAP
Label prints SELL
Enter on Sell label
→ Hold until ATR TP hits
Avoid Entries When:
Price is chopping tightly around VWAP
Major news events are about to release
Volume is extremely low
ATR is shrinking rapidly (market compression)
3. Risk-Management Guide
This is tailored to how your system actually behaves.
1. Use ATR TP as Primary Exit:
The system automatically calculates a TP based on volatility:
High volatility → larger TP
Low volatility → smaller TP
This keeps trades consistent and avoids lingering too long.
2. Stop-Loss Recommendation
This strategy is designed for TP-only exits, but if you want a SL:
Recommended Stop-Loss:
Use ATR’s opposite trail, OR
Use 1 × ATR behind your entry candle
This matches the system's internal logic.
3. Position Sizing
Since this system enters during momentum expansions, use:
1–2% max risk per trade
Reduce risk during high-impact news sessions
4. Understand VWAP Environment
Different VWAP conditions require different expectations:
Strong Trend (price far from VWAP)
Higher TP probability
Fewer whipsaws
Excellent continuation setups
Chop Zone (price flips above/below VWAP)
Do NOT trade
Signals lose edge
Wait for a clean break + UT confirmation
5. Choose Correct VWAP Reset for your trading and session
This dramatically improves results.
Market Recommended VWAP Reset
US Stocks New York Session
Indices Daily
Forex London or New York
Crypto Daily or None
4. Final Tips for Best Performance
✔ Enter only in the direction of VWAP
✔ Don’t chase signals far away from entry candle
✔ Avoid trading right into major support/resistance
✔ ATR TP will handle exits mostly
Disclaimer
This script is provided for educational and informational purposes only.
It does not constitute financial advice, investment advice, trading advice, or any form of recommendation to buy or sell any financial instrument. The auto take no responsibility for loss or error in the script.

Inyerneck UT Bot 9 EMA V.sthis script is a custom ut bot signal generator using a 9 ema filter and atr based thresholds. it shows buy/sell signals based on crossover logic and works well for volitality based set ups. created by inyerneck
AI Bot Regime Feed (v6) — stableThis indicator generates real-time, structured JSON alerts for external trading bots or automation systems.
It combines multiple technical layers to identify market regimes and high-probability buy/sell events, and sends them to any webhook endpoint (e.g., a FastAPI or Zapier listener).

RSI+BOLLINGER (LONG & SHORT)This indicator combines two of the most popular tools in technical analysis, the Relative Strength Index (RSI) and Bollinger Bands (BB), to generate both long (BUY) and short (SELL) trading signals.
Strategy:
Entries (Buy/Short): Entry signals are based on the RSI.
A BUY is suggested when the RSI crosses above an oversold level (default: 29), indicating a possible upward reversal.
A SHORT is suggested when the RSI crosses below an overbought level (default: 71), indicating a possible downward reversal.
Exits (Position Closure): Exit signals are based on Bollinger Bands.
A long position is closed when the price crosses below the upper Bollinger Band.
A short position is closed when the price crosses above the lower Bollinger Band.
Key Features:
Cascade Filter: Includes a smart filter that prevents opening new consecutive trades if the price hasn't moved significantly in favor of a new entry, optimizing signal quality.
Automation Alerts: Generates detailed alerts in JSON format for each event (buy, sell, close), designed for easy integration with trading bots and automated systems via webhooks.
Fully Configurable: All parameters of the RSI, Bollinger Bands, and strategy filters can be adjusted from the indicator’s settings menu.

UT Bot + LinReg Candles (Dual Sensitivity)
Script Description:
This indicator combines the popular UT Bot Alerts system with Linear Regression Candles (open source) for enhanced trend detection and trading signals in one singel script. The UT Bot features independent, then 2 x ATR sensitivity and periods controls for buy and sell signals, allowing you to fine-tune entries and exits to match your strategy. The script also overlays colored Linear Regression Candles with an optional signal line, helping you visually identify trend strength and direction. All calculations are performed on standard chart prices (no Heikin Ashi). Suitable for all asset classes and timeframes.
Eample setting for usdjpy 5 min chart for repeated buy and sell singnals based on trend:
BUY ATR period 300 multiplier 1
SELL ATR period 1 multiplier 2
Disclaimer:
This script is for informational and educational purposes only. It is not financial advice. Use at your own risk; the author assumes no responsibility for any trading results or losses.
Credits goes to to Ugurvu for linreg candles and quantnomad for UT Bot alerts that make this script possible.
Author: Patrick

Xcalibur Signals & Alerts [AlgoXcalibur]An advanced trend-following algorithm forged to empower retail traders with an edge.
Xcalibur Signals & Alerts is a sophisticated, multi-layered algorithm designed to consistently deliver real-time trend signals—without clutter or unnecessary complexity. The system combines refined trend-following logic with breakout detection, flat-market filtration, false signal failsafes, take profit cues, live alerts, and more — all in a visually simple, easy-to-use indicator built for all assets, timeframes, and market conditions.
🧠 Algorithm Logic
Xcalibur Signals & Alerts operates on a systematic framework that evaluates multiple technical dimensions in harmony—directional alignment, momentum confirmation, relative strength, volume bias, breakout detection, Fibonacci calculations, and more. Rather than reacting to isolated triggers, it filters every opportunity through a multi-layered confirmation engine. It doesn’t just react to every move—it evaluates them. This cohesive approach ensures that each signal results from aligned conditions—not arbitrary thresholds. By combining structural awareness with adaptive filtering, Xcalibur maintains clarity and consistency across a wide range of market environments—delivering actionable signals without unnecessary noise or lag.
⚙️ User-Adjustable Features
• Adjustable Sensitivity:
Choose from 5 pre-tuned Signal Trigger Settings and 3 dynamic Confirmation Filter Modes to tailor the system to your trading style, asset, and timeframe. Candle color reflects the active trigger condition, while an adaptive cyan line displays the selected Confirmation Filter—blocking signals until the filter threshold is crossed.
• Directional Stability Filter: When enabled, this filter uses mean-reversion calculations to determine directional bias and block unreliable signals during choppy, indecisive price action. A magenta line represents this filter threshold and provides higher-confidence signals during periods of low directional conviction.
• Pullback Allowance Filter:
When enabled, this unique filter uses Fibonacci ratios to deliberately block signals from temporary pullbacks during strong trend periods. A green (uptrend) or red (downtrend) line marks the active pullback allowance zone.
• False Signal Failsafe
:
Two selectable modes:
Simple — Cancels the signal if price breaks the signal candle’s high or low.
Advanced — Requires both a price break and opposing momentum confirmation.
When triggered, the system plots a white “X” signal, turns candles gray, disables the background color, sends an alert (if enabled), and enters standby mode until a valid trend condition re-emerges.
• Reaction Zones:
Identifies probable reversal or breakout zones based on recent price action patterns. A yellow line appears when active, with a yellow caution flag plotted if the price reaches this critical area.
• Take-Profit Cues
: Automatically detects potential trend exhaustion using price action structure and momentum shifts. When triggered, a visual “TP” marker is plotted—advising traders to manage profits or prepare for a possible reversal.
• Trailing Stop:
Plots a dynamic, percentage-based trailing stop or trailing take-profit using your selected input. Adjust it to suit your risk tolerance and asset.
• Multi-Timeframe Monitor
: Displays real-time trend direction across 1m, 2m, 5m, 15m, 1H, 4H, and 1D timeframes in a compact, easy-to-read table.
• Alert System
:
Receive desktop and/or mobile alerts for:
* New trend signals
* Failsafe triggers
* 9:00 AM Morning Greeting messages with auto re-arming confirmation
(Alerts are limited to 9:00 AM – 4:00 PM Eastern Time)
• SuperCandles
: Highlights strong momentum moves with a stunning and easily recognizable glow effect.
• Color-Coded Candles & Background
: Candles reflect the current trigger condition, while the background tint tracks the most recent trend—enhancing situational awareness.
*All input settings include tooltips to guide users through setup and interpretation.
⚔️ Not Just Another Signal Tool
Xcalibur Signals & Alerts was built from the ground up to empower retail traders with access to a cohesive, structured algorithmic system—one that reflects the kind of awareness, discipline, and market adaptability found in professional-grade algorithms.
This is not another oversensitive or under-responsive signal indicator that is limited to one specific type of market condition or trader. It does not utilize hyperactive triggers, rely on lagging crossover logic, or need infinitely adjustable and complex sensitivity settings. Instead of cluttered visuals to interpret, this indicator delivers a simple, easy-to-use tool—prioritizing clarity and usability without compromising on depth and sophistication.
Whether the market is trending, breaking out, or moving sideways, Xcalibur adapts—prioritizing trend stability, directional integrity, and visual clarity from one signal to the next.
⚠️ While the Xcalibur Signals & Alerts algorithm is immune to human emotion, you are not. Be mindful not to fall victim to costly emotions that can manipulate your judgment, and understand the unpredictable and complex nature of trading. No algorithm, strategy, or technique can deliver perfect accuracy, and Xcalibur Signals & Alerts is no exception. While AlgoXcalibur strives to be as accurate as possible, incorrect signals can and will occur. Xcalibur Signals & Alerts is a tool, not a guarantee. Users are fully responsible for making their own trading decisions, implementing proper risk management, and always trading responsibly.
🛡️ Wield Xcalibur as a standalone weapon or use it alongside other tools.
🔐 To get access or learn more, visit the Author’s Instructions section.

[Stoxello] Linear Regression Chop Zone Indicator📊 Linear Regression Chop Zone Indicator – Description
The Stoxello Linear Regression Chop Zone Indicator is a custom-built, multi-functional visual tool for identifying market trend direction, strength, and potential entry/exit signals using a combination of linear regression, EMA slope angles, and volatility-adjusted smoothing.
🧠 Core Features:
🔶 1. Chop Zone Color Coding (Trend Strength via EMA Angle)
The script calculates the angle of a 34-period EMA, representing momentum and trend steepness.
This angle is then translated into color-coded bars on the chart to help traders visually identify chop zones and trend strength.
Turquoise / Dark Green / Pale Green = Increasing bullish trend.
Lime / Yellow = Neutral or low momentum (choppy zones).
Orange / Red / Dark Red = Increasing bearish trend.
🔶 2. Linear Regression Deviation Channels (Trend Path)
A custom linear regression line is drawn with +/- deviation bands above and below it.
These lines track the expected price path and visually define upper/lower zones, similar to regression channels.
The correlation (R) and determination (R²) values are displayed as labels on the chart, measuring the strength and reliability of the linear fit.
🔶 3. Linear Regression-Adjusted EMA (Smoothing with Volatility)
A novel volatility-adaptive EMA is computed by combining a traditional EMA with distance from a linear regression line.
The result is a dynamic EMA that becomes more reactive in volatile conditions and smoother in stable ones.
Two lines are plotted:
Primary EMA (Yellow)
Trigger Line (Lagged by 2 bars, Fuchsia)
The fill color between these two helps visualize short-term bullish or bearish pressure.
🔶 4. Buy/Sell Signal Logic with De-Duplication
Buy signals are triggered when:
The adjusted EMA crosses above its previous value (bullish inflection).
Or when the EMA angle exceeds +5° (strong trend detected).
Sell signals occur when:
The adjusted EMA crosses below its previous value.
Each signal is deduplicated by tracking the last signal using var string lastSignal:
No repeat buys after a buy, or sells after a sell.
Signals are marked on the chart using clean text labels:
Buy: "•Entry• = Price"
Sell: "•Exit• = Price"
🔶 5. Alerts
Two alertconditions are included for:
BUY signals (long_signal)
SELL signals (short_signal)
Can be used with webhooks, email, or app notifications to automate or monitor trades.
🔍 Ideal Use Cases:
Traders who want a clear visual aid for market chop vs. trend.
Swing or intraday traders looking for adaptive entry/exit points.
Anyone combining regression analysis and momentum tracking into one indicator.

Grid Bot Visualizer V1
📊 Grid Bot Visualizer – V1
A dynamic and visual support tool for grid trading strategies.
🔧 Key Features
• Fixed grid levels based on a central entry price
• Customizable spacing, number of levels, and range
• Color-coded lines (🟢 green above, 🔴 red below)
• Expands automatically when price exceeds boundaries (within the defined box)
• Optional price labels shown outside the grid
• Grid visually framed by a blue box
• Vertical line to mark grid origin
• Built-in alert when price hits a grid level
⚙️ Use Case
Ideal for visualizing grid bot logic in volatile markets.
Monitor how price interacts with predefined zones.
✅ Alert Ready
Use alertcondition to get notified when a grid level is touched.

UT Bot Stochastic RSIUT Bot Stochastic RSI is a powerful trading tool designed to help traders identify potential buy and sell signals in the market. This indicator combines the Stochastic and RSI (Relative Strength Index) oscillators, two of the most popular and effective technical analysis tools, to provide a comprehensive view of market conditions.
The Stochastic oscillator is a momentum indicator that compares a security's closing price to its price range over a given time period. The RSI, on the other hand, is a momentum oscillator that measures the speed and change of price movements. By combining these two indicators, the UT Bot Stochastic RSI can help traders identify overbought and oversold conditions, as well as potential trend reversals.
The UT Bot Stochastic RSI also includes an ATR (Average True Range) trailing stop, which can be used to set stop-loss levels and manage risk. This feature is particularly useful in volatile markets, where price movements can be large and unpredictable.
In addition to its powerful technical analysis tools, the UT Bot Stochastic RSI also includes a backtesting feature, allowing traders to test their strategies on historical data. This can help traders identify the most effective settings for the indicator and improve their trading performance.
Overall, the UT Bot Stochastic RSI is a versatile and effective tool for traders of all levels, providing valuable insights into market conditions and helping to improve trading decisions

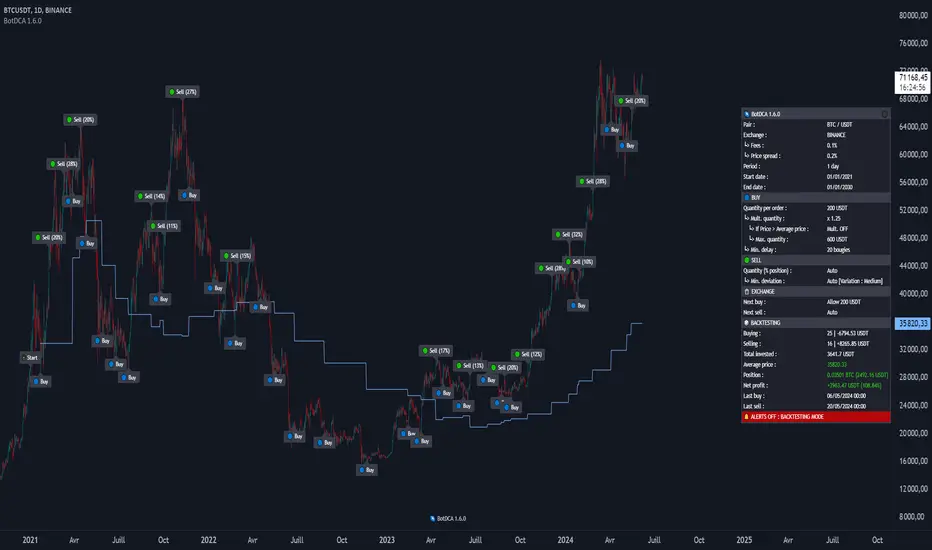
BotDCA | Algorithmic Smart DCA Bot🌌 What the script does, how it does ?
At the heart of its algorithm, this script incorporates the concept of Dollar Cost Averaging (DCA), a method of periodically allocating funds to an asset to mitigate the effects of market volatility.
Before we start, it's important to clarify that the script is adapted for the cryptocurrency market on USDT & USDC pairs in Spot, and on the Daily timeframe (D).
For this reason, and to optimize profits, the script will generate very few buy and sell positions.
Please also note that the script does not repaint.
Essentially, BotDCA generates buy and sell orders.
These buy and sell orders are generated using the following logic :
BUYING LOGIC :
• Volume : Current volume is compared with a linear percentile of volume over a short period.
This means that if current volume is higher than observed volumes over this period, the volume criteria is considered valid.
• Momentum & Volatility : The Average True Range (ATR) indicator adjusted by a square root is used as a measure of volatility.
Momentum is then calculated as the difference between the current closing price and a short moving average, normalized by this adjusted volatility.
The oversold condition is validated when momentum exceeds a specific level.
For the buy order to be triggered, the volume, momentum and volatility criteria must be validated.
SELLING LOGIC :
• Volume : Similar to the buy logic, the volume criteria is validated when current volume is higher than previous volumes.
• Momentum & Volatility : Volatility is measured using the adjusted ATR indicator, similar to the buy logic.
An overbought condition is validated when normalized momentum, calculated as the difference between the current closing price and a volatility-adjusted short-period moving average, exceeds a specific level.
• Trend : The general market trend is considered for the sell logic.
The trend criteria is validated when the current moving average is higher than that of the previous period.
For the sell order to be triggered, the volume, momentum, volatility and trend criteria must be validated.
These orders are also adjusted according to what the user defines as buy and sell settings :
🔵 Buying settings
• Quantity per order ($) : Defines the amount in stable coins to be invested for each buy order.
• └> Mult. quantity (x) : Multiplication factor applied to the buy quantity for successive orders, enabling the investment to be increased in the event of a price fall.
Example : If Quantity per order is $200 and Mult. quantity is x2, then the second buy order will be $400, the third buy order will be $800, the fourth buy order will be $1600 ...
After a sell order, the multiplier is cancelled.
Note : If value is set to 1 : Disabled
• └> Max. quantity (x) : Sets a maximum purchase quantity limit, preventing orders from exceeding this amount.
Example : If Quantity per order is $200, Mult. quantity is x2, and Max. quantity is $700, then the second buy order will be $400, the third buy order will be $700, the fourth buy order will be $700 ...
Note : If value is less than Quantity or is set to 0 : Disabled
• └> If Price > Average price : Enable or disable quantity multiplier when current price exceeds average price.
• Min. delay (in days) : Establishes a minimum interval in days between two successive purchases to avoid investing too close together.
Example : By default the time interval for the bot is set to D, so if you set 20 as the value, the bot will wait at least 20 days between buy orders before entering a position.
Note : If value is set to 0 : Disabled
• └> Min. deviation (%) : Defines the minimum price difference in percent to trigger a new purchase after the first.
Note : If value is set to 0 : Disabled
• └> Mult. deviation (x) : Apply a multiplication factor to the price differential for successive buys, progressively increasing the purchase interval.
Example : If Mult. deviation is 10% and Min. deviation is x2, then between the first and second buy orders the minimum deviation will be 10%, between the second and third buy orders the minimum deviation will be 20%, between the third and fourth buy orders the minimum deviation will be 40%...
After a sell order, the multiplier is cancelled.
Note : If value is set to 1 : Disabled
• Display help for these settings : On chart, displays help text about buying settings.
🟢 Selling settings
• Quantity (% position) : Percentage of the position to be sold in each sell order.
Example : If the first buy order is 0.1 BTC and the second buy order is 0.2 BTC, then the position is 0.3 BTC.
If Quantity (% position) is set to 20, then the first sell order will be 0.06 BTC (20% of 0.3 BTC), the second sell order will be 0.048 BTC (20% of 0.24 BTC) ...
(Auto ?) : If this option is enabled, the bot will automatically sell part of your position.
The quantity sold depends on the volatility of the last 30 days : the higher the volatility, the more it sells, and the lower the volatility, the less it sells.
The minimum sale defined is 10%, while the maximum sale will not exceed 50%.
• └> Min. deviation (%) : Minimum percentage of price deviation to trigger a sale.
Example : If Average price of BTC is 30 000 USDT and Min. deviation is 10%, then the first sell order will be at least 33 000 USDT, the second sell order will be at least 36 300 USDT ...
Note : If value is set to 0 : Disabled
(Auto ?) : If this option is activated, the bot automatically determines the sell minimum deviation percentage.
The deviation set depends on the volatility of the last 30 days : the higher the volatility, the higher the deviation, and the lower the volatility, the lower the deviation.
A start and end date defines when the script should generate buy and sell positions :
📆 Date settings
• Start date : Indicate the script launch date (If it’s a new launch, you must choose today’s date before creating your TradingView alert).
• End date : Enter the date on which you want the script to stop.
Other parameters can be configured to fine-tune buys and sells :
⏲️ Trading session settings
• Days : Allows you to select the specific days on which the script will be active, offering the possibility of excluding certain days.
🏛️ Exchange settings
• Fees (%) : Indicate the percentage fee applied by the exchange platform on each transaction.
• Price spread (%) : Specifies the price spread to be considered for realistic order adjustment.
🤖 Bot settings
• Add to Position ? : Allows tokens to be manually added to the position when the script is launched.
• └> How much ? (Base) : Number of tokens to add.
• └> Cost ? ($) : Stable coins amount of addition to position.
These settings are included in the calculation when an order is triggered.
Advanced visual customization options can be modified :
🎨 Visual settings
• TradingView Theme : Choose between a light or dark theme for the bot interface.
• Panel : Enables or disables the display of the information panel on the graph, and modifies its size and alignment.
• Positions : Show or hide buy and sell position labels on the chart, and modify their size and appearance (several display modes : basic, simple, advanced).
• Average price : Enables or disables the display of the average price line and modifies its size and color.
• Simulator : Enables or disables the ATH percentage-based simulator line and modifies its size and color.
• Trading session : Displays or hides the background of specified trading sessions.
• Hide warning messages ? : Hide or show warning messages on graph.
A profit simulator can be configured :
🕹️ Simulator settings
• Price (% ATH) : Determines a percentage of the token's ATH to simulate potential gains if the token reaches this price level again.
Users can also activate buying and selling alerts in the settings :
🤖 Bot settings
• START THE BOT ? » ALERTS ON : REAL MODE : Enable or disable the bot to execute real orders based on alerts.
• Mode FULL Auto ? : Enables the Mode FULL Auto, requiring additional configuration for connection to exchange APIs.
• └> Password FULL Auto : Password required to activate the Mode FULL Auto.
By activating FULL Auto Mode with TradingView's webhook system, the user can connect the script to the APIs of compatible exchanges, and receive notifications of buy and sell orders by e-mail, Telegram or Discord.
On the chart, a panel displays a variety of information, and also a backtesting / result of the script.
Here is a list of elements displayed by the panel :
💻 Informations panel
General :
• Pair
• Exchange
• └> Fees
• └> Price spread
• Period
• Start date
• End date
• Trading days
Buying
• Quantity per order
• └> Mult. quantity
• └> Max. quantity
• └> If Price > Average price
• └> Min. deviation
• └> Mult. deviation
• Min. delay (in days)
Selling
• Quantity (% position)
• └> Min. deviation
Exchange
• Next buy
• Next sell
Backtesting / Results
• No. of buys
• No. of sells
• Average price
• Actual position
• Actual net profit
• └> Simulator
• Last buy
• Last sell
🌌 About default settings
Default settings are defined as an example.
Above in the description, you will find details of each setting.
Here's a description of how user-defined setting categories affect the script's buy and sell positions :
📆 Date : Determines between which time ranges buy and sell positions are generated.
⏲️ Trading session : Exclude selected days disables buy positions on deselected days.
🕹️ Simulator : Does not affect buying and selling. It is for information purposes only.
🏛️ Exchange : Fees should be as close as possible to your exchange and price spread depends on your tolerance. This affects buy and sell position.
🔵 Buy : Depending on your investment capacity and risk management, these settings have an impact on buy positions.
🟢 Sell : These settings determine profit-taking. This has an impact on sell positions.
🎨 Visual : Does not affect buy and sell positions. For information only.
🤖 Bot : This part is mainly used to use the script with TradingView alerts. Only the 'Add to position' option affects buy and sell positions.
Once you've set all your settings for the script, you can view the backtesting displayed in the panel on the chart.
🌌 How to use it ?
To summarize how to use this script successfully, please follow these steps :
1. First, choose a cryptocurrency pair (e.g. BTC/USDT).
2. Set a start date (preferably today's date if it's your first launch) and an end date.
3. According on your preferences, you can choose specific trading days, or default to all days of the week.
4. Depending on your exchange, you can set fees and a price spread.
5. Then, based on your portfolio management and investment capabilities, define buy and sell parameters.
6. You can set the bot's appearance on the chart.
7. Once you have configured your settings, you can choose a simulation price.
8. Finally, to activate TradingView Alerts, check the box START THE BOT ? ALERTS ON : REAL MODE.
🌌 Overview
Here's a preview of the script with a few screenshots :
BTC/USDT • Basic display
SOL/USDT • Simple display
XRP/USDT • Advanced display
MATIC/USDT • Light theme
Script settings
🌌 Why do I have to pay ?
BotDCA uses advanced indicators and complex calculations to identify buying and selling opportunities.
With TradingView's alert system, it automates your investment strategy, eliminating the need for constant manual analysis and constant market monitoring.
This saves you precious time.
With adjustable buy and sell settings, you can customize the script to suit your risk tolerance and investment objectives.
This flexibility adds considerable value, allowing you to optimize the script to suit your situation.
Paid access ensures that you benefit from ongoing support and updates, which are essential for maintaining the script's effectiveness.
🌌 Disclaimer
This script is provided for educational purposes only and should not be construed as investment advice.
Users should be aware that trading in the financial markets involves risks, and that past performance of a script does not guarantee future results.
It is strongly recommended that you carry out a detailed analysis and consider your financial situation and risk tolerance before committing yourself to trading/investing.
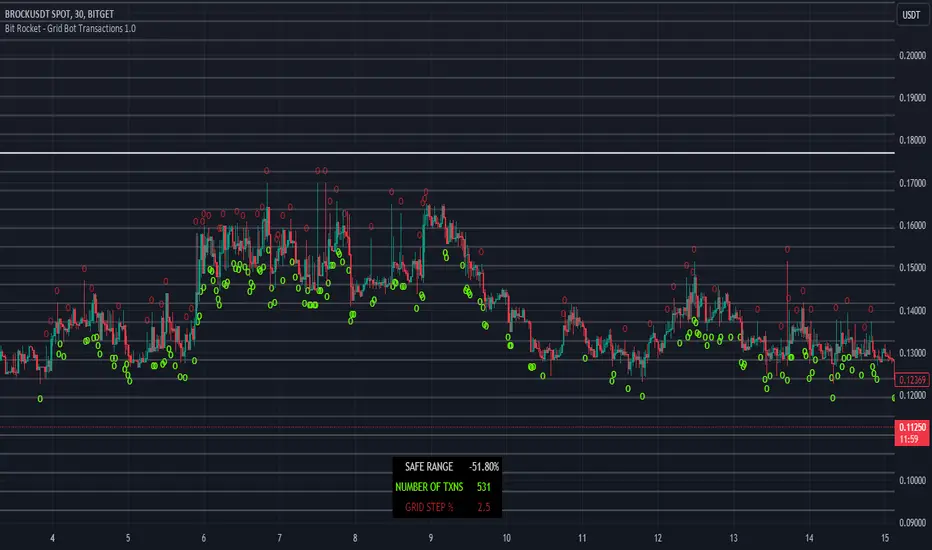
Bit Rocket - Grid Bot Transactions 1.0DESCRIPTION
A grid bot is an automated trading bot that is designed to execute buy and sell orders based on a pre-defined grid of prices. Grid bots operate within a specified price range, placing trades at set intervals above and below the current market price. The key idea behind a grid bot is to take advantage of price fluctuations and market volatility.
The Grid Bot Transactions Indicator serves as a valuable tool for identifying the most suitable trading pairs and optimizing the grid bot percentage, also known as the grid level configuration. This indicator assists in the selection of pairs that are likely to yield the best results and aids in determining the ideal configuration for grid bot trading.
USAGE
NUMBER OF TRANSACTIONS - will calculate the number of times the price moves up and down by the grid level percentage for a particular trading pair. Each move up and down is counted as a transaction, total transactions are then calculated from the date range set by the user.
RANGE - number represents the swing from the highest price to the lowest price during the date range set by the user, this will assist in determining what grid range could be used when configuring the grid bot.
GRID STEP (%) - This is the distance for each buy and sell set by the user, for example if the grid step % is set at 2% then for each 2% move up or down that occurs will count as one transaction. Try different grid step percentages to see what percentage produces the best results, too high and transactions will lower but profit per sell transaction will be greater, too small results in higher trading fees and lower profit per sell transaction. Using 1.5% - 5% for the grid step will make the most sense.
Armed with this knowledge the user can now compare against other pairs, determine the optimum grid level percentage, which pairs have more transactions, and determine transaction trend.
SETUP
When you first add the indicator to the chart you will see a pop-up reminding you to set the From Date Time for Bit Rocket Grid Bot Transactions 1.0, just click anywhere on the chart to add.
1. Change timeframe to 30m
2. Under Inputs – Grid Settings change the From Date & Time field
3. Under Inputs – Grid Settings change Size of Grid % or leave at default 2.5%
4. If grid and buy and sell symbols are in the way, go to ‘Style’ tab and turn off all the signals and Lines options.
DCA Liquidation Calculation [ChartPrime]The DCA Liquidation Calculator is a powerful table indicator designed for both manual and bot-assisted traders who practice Dollar Cost Averaging (DCA). Its primary objective is to help traders avoid getting liquidated and make informed decisions when managing their positions. This comprehensive table indicator provides essential information to DCA traders, enabling them to plan their trades effectively and mitigate potential risks of liquidation.
Key Features:
Liquidation Price Awareness: The DCA Liquidation Calculator calculates and displays the liquidation price for each trade within your position. This critical information empowers traders to set appropriate stop-loss levels and avoid being liquidated in adverse market conditions, especially in leveraged trading scenarios.
DCA Recommendations: Whether you are executing DCA manually or using a trading bot, the DCA Liquidation Calculator offers valuable guidance. It suggests optimal entry prices and provides insights into the percentage deviation from the current market price, helping traders make well-timed and well-informed DCA decisions.
Position Sizing: Proper position sizing is essential for risk management. The DCA Liquidation Calculator helps traders determine the percentage of capital to allocate to each trade based on the provided insights. By using the recommended position sizing, traders can protect their capital and potentially maximize profits.
Profit and Loss Visualization: Gain real-time visibility into your Profit and Loss (PnL) with the DCA Liquidation Calculator. This feature allows you to monitor your trades' performance, enabling you to adapt your strategies as needed and make data-driven decisions.
Margin Call Indicators: Anticipating potential margin calls is crucial for maintaining a healthy trading account. The DCA Liquidation Calculator's smart analysis helps you identify and manage potential margin call situations, reducing the risk of account liquidation.
Capital Requirements: Before entering a trade, it's vital to know the required capital. The DCA Liquidation Calculator provides you with this information, ensuring you are adequately prepared to execute your trades without overextending your resources.
Maximum Trade Limit: Considering your available capital, the DCA Liquidation Calculator helps you determine the maximum number of trades you can enter. This feature ensures you maintain a disciplined and sustainable trading approach aligned with your financial capabilities.
Color-Coded Risk Indicators:
Green Liquidation Price Cell: Indicates that the position is considered safe from liquidation at the given parameters.
Yellow Liquidation Price Cell: Warns traders of potential liquidation risk. Exercise caution and monitor the trade closely to avoid undesirable outcomes.
Purple Liquidation Price Cell: Shows the liquidation price, but it does not necessarily indicate an imminent liquidation. Use this information to make prudent risk management decisions.
Red Row: Signals that the trade cannot be executed due to insufficient capital. Consider alternative strategies or ensure adequate capitalization before proceeding.
Settings explained:
In conclusion, the DCA Liquidation Calculator equips traders with essential tools to make well-calculated decisions, minimize liquidation risks, and optimize their Dollar Cost Averaging strategy. By offering comprehensive insights into your trading position, this indicator empowers you to navigate the markets with confidence and increase your potential for successful and sustainable trading.

Simple Grid Lines VisualizerAbout Grid Bots
A grid bot is a type of trading bot or algorithm that is designed to automatically execute trades within a predefined price range or grid. It is commonly used in markets that exhibit ranging or sideways movement, where prices tend to fluctuate within a specific range without a clear trend.
The grid bot strategy involves placing a series of buy and sell orders at regular intervals within the predefined price range or grid. The bot essentially creates a grid of orders, hence the name. When the price reaches one of these levels, the bot will execute the corresponding trade. For example, if the price reaches a predefined lower level, the bot will buy, and if it reaches a predefined upper level, it will sell.
The purpose of the grid bot strategy is to take advantage of the price oscillations within the range. As the price moves up and down, the bot aims to generate profits by buying at the lower end of the range and selling at the higher end. By repeatedly buying and selling at these predetermined levels, the bot attempts to capture gains from the price fluctuations.
About this Script
Simple Grid Lines Visualizer is designed to assist traders in visualizing and implementing automated price grids on their charts. With just a few inputs, this script generates gridlines based on your specified top price, bottom price, and the number of grids or profit per grid.
How it Works:
Specify Top and Bottom Prices: Start by setting the top and bottom prices that define the range within which the gridlines will be generated. These prices can be based on support and resistance levels, historical data, or any other factors you consider relevant to your analysis.
Determine Grid Parameters: Choose either the number of grids or profit per grid, depending on your preference and trading strategy. If you select the number of grids, the script will evenly distribute the gridlines within the specified price range. Alternatively, if you opt for profit per grid, the script will calculate the price increment required to achieve your desired profit level per grid.
Note that when choosing Profit per Grid , an approximation usually is performed, as all grid lines must be evenly distributed. To achieve that, the script computes the grid distance using the mean price between top and bottom, then computes how many of those complete distances may enter the entire range, and lastly, creates a grid with evenly distributed distances as close as possible to the previously computed.
Customize Styling and Display: Adjust the line color, line style, transparency, and other visual aspects to ensure clear visibility on your charts.
Analyze and Trade: Once the gridlines are plotted on your chart, carefully observe how the market interacts with them. The gridlines can act as reference points for potential support and resistance levels, as well as simple buy/sell orders for a trading bot.
Try to find gridlines that intersect prices as frequently as possible from one to another.
A grid with too many lines will make lots of potential trades, but the amount traded will be minimal (as the total amount invested is divided over the number of grids).
A grid with too few lines will make lots of profits with each trade, but the trades will be less likely to occur (depending on the top/bottom distance).
This tool aims to help visually which grid parameters seem to optimize this problem.
Future versions may include automatic profit computation.

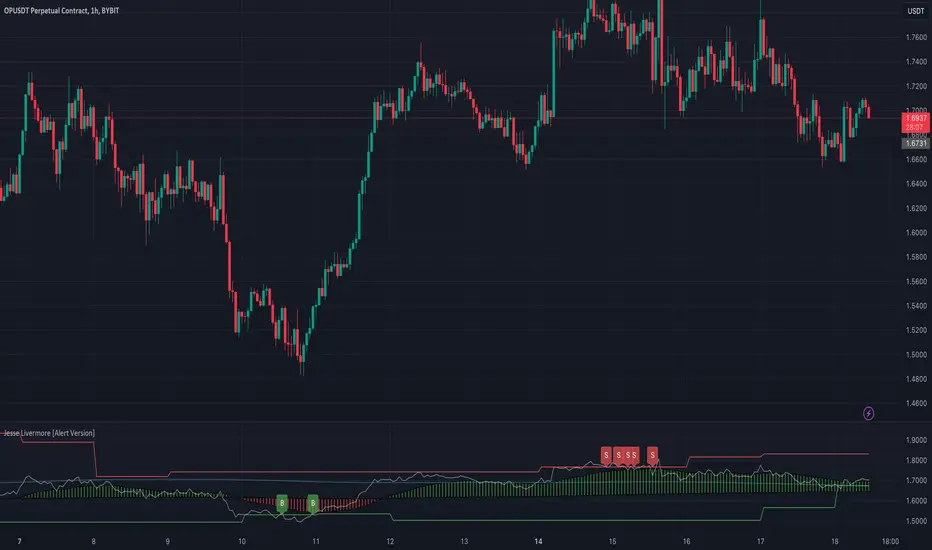
Jesse Livermore Strategy [Buy & Sell]Jesse Livermore was a famous trader who made a fortune in the early 20th century through his unique approach to trading.
While he did not leave behind a single, specific trading strategy that is attributed to him, I have tried to reproduce one.
His trading strategy was based on understanding market trends and sentiment, and he used several technical indicators to identify potential entry and exit points.
Some of the indicators he used include:
Price Action:
Jesse Livermore relied heavily on price action to make trading decisions.
He believed that the price itself was the best indicator of market sentiment, and that by analyzing the price movement, he could identify trends and market behavior.
Volume:
Livermore also used volume to confirm price movements.
He believed that a rise in volume along with a price increase indicated a strong bullish trend, while a decrease in volume with a price increase indicated a weak trend.
Pivot Points:
Another key component of Jesse Livermore's trading strategy was pivot points.
He used pivot points to identify potential support and resistance levels in the market, which he then used to identify potential entry and exit points.
Jesse Livermore outlined a simple trading system: wait for pivotal points before entering a trade.
When the points come into play, trade them using a buffer, trading in the direction of the overall market.
Let the price dictate your actions and stay with profitable trades until there is good reason to exit the trade.
The one I have tried to reproduce it's based on Pivot High and Low looking back 5 Days, and the average price oscillator.
When the price is bellow the support defined line it's time to Buy ( Long Position ), when the Price line is over the Resistance Line it's time to Sell ( Short Position )
This indicator has to be checked, and tried into a Real-Time context, so using the Replay functionality of TradingView is the best way to see and understand how Signals comes
(NB: look back into the chart without Replay should give you wrong Buy/Sell information)
The Indicator can be used on every TimeFrames, but the better ones are 5min - 15min.
I will add the possibility to choose the TimeFrames value for Pivot High and Low.
I will create a version with Alerts for Buy and Sell and the possibility to integrate it with "3commas Bot" where the best deal can be to set a TP to 1% for each Long or Short Entry.
Let's try it and comment for doubts or questions.
BTC 4h bot 2.0 AlertsThis is Alert version of BTC 4h bot 2.0.
Optimized for pairs BTC vs stablecoins, 4h timeframe.
HOW IT WORKS:
Script is based on the fact that there are certain phases of the market when there is a greater probability that BTC will go to one side or the other. To evaluate which phase we are in, the script uses "Main trend" and "Confirmation signals".
Main trend
- Is composed of a combination of several supertrends and moving averages. A Supertrend is a trend following indicator that helps in identifying whether we are in an uptrend or a downtrend. A higher factor is used to capture the main trend and not just small movements. In case the market goes sideways, the Supertrend does not work well, so it is a combination of multiple supertrends along with moving averages to differentiate a real strong trend from a range.
- It can be seen on the graph as a thick solid line.
- In an uptrend is green, in a downtrend red, gray represents the neutral zone.
Confirmation signals
- Are several script-evaluated indicators such as RSI , MACD , ADX and others, which serve to confirm the trend. In this case, it is the opposite way to the Main trend. Confirmation signals are used here to detect small movements. They are trying to capture bullish and bearish price momentum.
- On the graph they are seen as dashed lines above or below the Main trend (in the gray zone they are in the middle).
- It indicates only two signals, green for buy and red for sell.
HOW TO USE IT:
if the Main trend and Confirmation signals are of the same color, it will send a buy or sell signal, depending on which phase of the trend it is in. If the Main trend is e.g. in an uptrend and the market is going up, Confirmation signals should generate a lot of signals. But if the market starts to go in the opposite direction, Confirmation signals should generate fewer signals or none at all, thus reducing the number of wrong trades. In the gray zone of the Main trend it does not open positions.
To close position is possible to use stop loss and take profit or alternative could be to set very high TP value, thereby letting the script close the positions by itself by Stop Long or Stop Short.
The recommended setting is:
TP: 3.9%
SL: 4.7%.
In this case, it is a Alert version, where can be seen all the signals, which the script generates.
Green triangels indicate open Long.
Red triangels indicate open Short.
Small blue triangels indicate Stop Long position.
Small orange triangels indicate Stop Short position.
Signal is valid after bar is closed, so do not open a position before.
Script works well on Bitstamp, but also other exchanges with pair BTC/USD or BTC/stablecoins.
The script works consistently well over a long period of time, using past probabilities, but this does not guarantee future results.
CryptoGraph Entry BuilderA complete system to generate buy & sell signals, based on multiple indicators, timeframes and assets
═════════════════════════════════════════════════════════════════════════
🟣 How it works
This indicator allows you to create buy & sell signals, based on multiple trigger conditions, placed in one easy to use TradingView indicator to produce alerts, backtest, reduce risk and increase profitability. This script is especially designed to be used with the CryptoGraph Strategizer indicator. Signals produced by this indicator, can be used as external input with the CryptoGraph Strategizer, by adding both indicators to your chart and selecting "External Input" as entry source in the inputs of the Strategizer indicator. From that point on, buy & sell signals generated by the Entry Builder, will be used for backtesting.
Each trigger or filtering condition is selectable and able to be combined using the selection boxes.
Trigger or filter conditions can be used on a different timeframes, and with different assets or coin pairs. Make sure to set higher timeframe filters, to a higher timeframe than your chart timeframe.
🟣 How to use
• Add the indicator to your chart
• Select an indicator you woud like to use for entry analysis. Combine more indicators for more entry filtering
• Configure entry conditions per indicator. It is recommended to add and configure one indicator at a time
• Analyse your buy/sell entries
• Connect to CryptoGraph Strategizer as external input source for backtesting purposes
🟣 Indicator Filters
• ATR :
Average True Range (ATR) is a tool used in technical analysis to measure volatility .
Possible options for ATR entry filtering are an ATR value greater/smaller than your input variable for trade entries, or the ATR crossing your input variable for trade entries.
This enables the possibility to only enter positions when the market has a certain degree of volatility .
• ADX :
The Average Directional Index ( ADX ) helps traders determine the strength of a trend, not its actual direction. It can be used to find out whether the
market is ranging or starting a new trend.
Possible options for ADX entry filtering are an ADX value greater/smaller than your input variable for trade entries, or the ADX crossing your input variable for trade entries.
• OBV :
The On Balance Volume indicator (OBV) is used in technical analysis to measure buying and selling pressure. It is a cumulative indicator meaning that on days where price went up, that day's volume is added to the cumulative OBV total.
Possible options for OBV entry filtering are Regular, Hidden or Regular&Hidden divergences. Divergence is when the price of an asset is moving in the opposite direction of a technical indicator, such as an oscillator, or is moving contrary to other data. Divergence warns that the current price trend may be weakening, and in some cases may lead to the price changing direction.
• Moving Average :
Moving Average (MA) is a price based, lagging (or reactive) indicator that displays the average price of a security over a set period of time. A Moving Average is a good way to gauge momentum as well as to confirm trends, and define areas of support and resistance .
Possible options for MA entry filtering are price being above/below Moving Average 1, price crossing up/down Moving Average 1, Moving Average 1 being above/below Moving Average 2 and Moving Average 1 crossing up/down Moving Average 2.
• Supertrend :
Supertrend (ST) is a trend-following indicator based on Average True Range (ATR). The calculation of its single line combines trend detection and volatility . It can be used to detect changes in trend direction and to position stops.
Possible options for ST entry filtering are Supertrend being in upward/downward direction, or Supertrend changing direction.
• RSI :
The Relative Strength Index ( RSI ) is a well versed momentum based oscillator which is used to measure the speed (velocity) as well as the change (magnitude) of directional price movements.
Possible options for RSI entry filtering are RSI being smaller/greater than your input value, or RSI crossing up/down your input value.
• Stochastic RSI :
The Stochastic RSI indicator ( Stoch RSI ) is essentially an indicator of an indicator. It is used in technical analysis to provide a stochastic calculation to the RSI indicator. This means that it is a measure of RSI relative to its own high/low range over a user defined period of time.
Possible options for Stoch RSI entry filtering are Stoch RSI crossing below or above your input value.
• VWAP Bands :
Volume Weighted Average Price ( VWAP ) is a technical analysis tool used to measure the average price weighted by volume . VWAP is typically used with intraday charts as a way to determine the general direction of intraday prices.
We use standard deviations, determined by user input, to create VWAP bands.
Possible options for VWAP long entry filtering are: price being below the lower VWAP band, price crossing back up the lower VWAP band or price crossing down the lower VWAP band.
Possible options for VWAP short entry filtering are: price being above the upper VWAP band, price crossing back down the upper VWAP band, or price crossing up the upper VWAP band.
• Bollinger Bands :
Bollinger Bands (BB) are a widely popular technical analysis instrument created by John Bollinger in the early 1980’s. Bollinger Bands consist of a band of three lines which are plotted in relation to security prices. The line in the middle is usually a Simple Moving Average ( SMA ) set to a period of 20 days (the type of trend line and period can be changed by the trader; however a 20 day moving average is by far the most popular).
Possible options for BB long entry filtering are: price being below the lower Bollinger band , price crossing back up the lower Bollinger band or price crossing down the lower Bollinger band .
Possible options for BB short entry filtering are: price being above the upper Bollinger band , price crossing back down the upper Bollinger band , or price crossing up the upper Bollinger band .
• WaveTrend :
WaveTrend (WT) is a smoothed momentum oscillator which enables it to detect true reversals in an accurate manner.
Possible options for WT entry filtering are: Green/red dots below or above a certain WaveTrend value, Regular Divergence, Hidden Divergence and Regular&Hidden Divergence.

Assassin's Grid
Introduction: Are you a fan of automated grid-based trading and holding onto your crypto assets like they're the last Snickers bar in the world? If so, this Pine script could be your new best friend!
Grid Trading Genius: The script uses some seriously advanced grid trading techniques to automatically place orders at different price levels, creating a mesh of positions that move with the market like a well-oiled machine. This strategy can be great for traders who are willing to sit back and let their positions grow like a fine wine over time.
Optimization Features: The script comes loaded with all sorts of features and tools to help traders optimize their grid positions, like position exits and custom alerts for creating limit and market orders. This helps keep traders in the loop and allows them to take action as needed, like a ninja in the night.
Unique Twists: One of the unique features of this script is the option to choose between normal or incremental entry steps in a 1,2,3,... ratio. By choosing incremental entries, traders can potentially improve their average price and increase their potential profits like a boss. Just keep in mind that this script doesn't have a stop loss feature, but it does include the option to sell without profit on the final entry or on all entries if desired. Additionally, the script is always open to improvement and any ideas for improving it are welcome, like a blank canvas.
Conclusion: If you love automated trading and have the patience and determination to stick to a solid strategy, this Pine script could be a great fit for you. It's suitable for traders who are comfortable with more complex trading approaches and are willing to put in the time and effort to learn and master the script's various features and techniques, like a Jedi Knight
FIN_BOTthis script is just for test,
can be not correct working, is just for now, soon will be better,
this is for test, and it will be prodaction as soon as possible,
Plasse be shur that you don use it as prodaction.
3Commas dollar cost averaging (DCA) QFL IndicatorAs investors, we often face the dilemma of willing high stock prices when we sell, but not when we buy. There are times when this dilemma causes investors to wait for a dip in prices, thereby potentially missing out on a continual rise. This is how investors get lured away from the markets and become tangled in the slippery slope of market timing, which is not advisable to a long-term investment strategy.
Skyrex developed a complex indicator based on dollar-cost averaging in Quick Fingers Luc's interpretation. It is a combinations of strategies which allows to systematically accumulate assets by investing scaled amounts of money at defined market cycle global support levels. Dollar-cost averaging can reduce the overall impact of price volatility and lower the average cost per asset thus even during market slumps only a small bounce is required to reach take profit.
The indicator script monitors a chart price action and identifies bases as they form. When bases are reached the script provides entry alerts. During price action development an asset value can go lower and in this way the script will perform safety entries alerts at each subsequent accumulation levels. When weighted average entry price reaches target profit the script will perform a take profit action alert.
Bases are identified as pivot lows in a fractal pattern and validated by an adjustable decrease/rise percentage to ensure significancy of identified bases. To qualify a pivot low, the indicator will perform the following validation:
Validate the price rate of change on drops and bounces is above a given threshold amount.
Validate the volume at the low pivot point is above the volume moving average (using a given length).
Validate the volume amount is a given factor of magnitude above is above the volume moving average.
Validate the potential new base is not too close to the previous range by using a given price percent difference threshold amount.
A fractal pattern is a recurring pattern on a price chart that can predict reversals among larger, more chaotic price movements. These basic fractals are composed of five or more bars. The rules for identifying fractals are as follows:
A bearish turning point occurs when there is a pattern with the highest high in the middle and two lower highs on each side.
A bullish turning point occurs when there is a pattern with the lowest low in the middle and two higher lows on each side.
Basic dollar-cost averaging approach is enhances by implementation of adjustable accumulation levels in order to provide opportunity of setting them at defined global support levels and Martingale volume coefficient to increase averaging effect. According to Quick Fingers Luc's principles trading principles we added volume validation of a base because it allows to confirm that the market is resistant to further price decrease.
The indicator supports traditional and cryptocurrency spot, futures , options and marginal trading exchanges. It works accurately with BTC , USD, USDT, ETH and BNB quote currencies. Best to use with 1H timeframe charts and limit orders. The indicator can be and should be configured for each particular asset according to its global support and resistance levels and price action cycles. You can modify levels and risk management settings to receive better performance
The difference between core script and this interpretation is that this strategy is specially designed for 3Commas bots
How to use?
1. Apply indicator to a trading pair your are interested in using 1H timeframe chart
2. Configure the indicator: change layer values, order size multiple and take profit/stop loss values according to current market cycle stage
3. Set up a TradingView custom alert using the indicator settings to trigger on a condition you are interested in
4. The indicator will send alerts when to enter and when to exit positions which can be applied to your portfolio using external trading platforms
5. Update settings once market conditions are changed using backtests on a monthly period
Dollar cost averaging (DCA) QFL IndicatorAs investors, we often face the dilemma of willing high stock prices when we sell, but not when we buy. There are times when this dilemma causes investors to wait for a dip in prices, thereby potentially missing out on a continual rise. This is how investors get lured away from the markets and become tangled in the slippery slope of market timing, which is not advisable to a long-term investment strategy.
Skyrex developed a complex indicator based on dollar-cost averaging in Quick Fingers Luc's interpretation. It is a combinations of strategies which allows to systematically accumulate assets by investing scaled amounts of money at defined market cycle global support levels. Dollar-cost averaging can reduce the overall impact of price volatility and lower the average cost per asset thus even during market slumps only a small bounce is required to reach take profit.
The indicator script monitors a chart price action and identifies bases as they form. When bases are reached the script provides entry alerts. During price action development an asset value can go lower and in this way the script will perform safety entries alerts at each subsequent accumulation levels. When weighted average entry price reaches target profit the script will perform a take profit action alert.
Bases are identified as pivot lows in a fractal pattern and validated by an adjustable decrease/rise percentage to ensure significancy of identified bases. To qualify a pivot low, the indicator will perform the following validation:
Validate the price rate of change on drops and bounces is above a given threshold amount.
Validate the volume at the low pivot point is above the volume moving average (using a given length).
Validate the volume amount is a given factor of magnitude above is above the volume moving average.
Validate the potential new base is not too close to the previous range by using a given price percent difference threshold amount.
A fractal pattern is a recurring pattern on a price chart that can predict reversals among larger, more chaotic price movements. These basic fractals are composed of five or more bars. The rules for identifying fractals are as follows:
A bearish turning point occurs when there is a pattern with the highest high in the middle and two lower highs on each side.
A bullish turning point occurs when there is a pattern with the lowest low in the middle and two higher lows on each side.
Basic dollar-cost averaging approach is enhances by implementation of adjustable accumulation levels in order to provide opportunity of setting them at defined global support levels and Martingale volume coefficient to increase averaging effect. According to Quick Fingers Luc's principles trading principles we added volume validation of a base because it allows to confirm that the market is resistant to further price decrease.
The indicator supports traditional and cryptocurrency spot, futures, options and marginal trading exchanges. It works accurately with BTC, USD, USDT, ETH and BNB quote currencies. Best to use with 1H timeframe charts and limit orders. The indicator can be and should be configured for each particular asset according to its global support and resistance levels and price action cycles. You can modify levels and risk management settings to receive better performance
Advantages of this indicator:
The indicator has custom alert settings for each strategy action
The indicator can be used with 3Commas, Cryptohopper, Alertatron or Zignaly bots
The indicator is sustainable to market slumps and can be used for long-term trading
The indicator provides a large number of entries which is good for diversification
Can be applied to any market and quote currency
Easy to configure user interface settings
How to use?
1. Apply indicator to a trading pair your are interested in using 1H timeframe chart
2. Configure the indicator: change layer values, order size multiple and take profit/stop loss values according to current market cycle stage
3. Set up a TradingView custom alert using the indicator settings to trigger on a condition you are interested in
4. The indicator will send alerts when to enter and when to exit positions which can be applied to your portfolio using external trading platforms
5. Update settings once market conditions are changed using backtests on a monthly period

Unicorn X-AlgoUnicorn X-Algo is a multifunctional trading indicator. It is designed to help traders make real-time decisions using quantitative models.
Its core is a trend trading strategy based on our enhanced Trailing Stop-Loss algorithm. This strategy provides the user with position entry and exit signals. It is customizable and has a built-in instant backtesting feature.
For those who have difficulty with finding the good settings the indicator has the Automatic Mode. In this mode, there is no need for the user to adjust any settings. The indicator calculates optimized trading signals automatically.
In addition, the indicator provides a number of useful tools that aim to provide additional confirmation to the trading signals. They include: support and resistance levels forecast, price range prediction and institutional activity detection.
The script can send real-time alerts to the user’s Email and to the cell phone via notifications in the TradingView app.
The indicator can be used for various types of trend and swing trading, including positional trading, day trading and scalping.
Unicorn X-Algo allows users to:
forecast direction of trends with BUY and SELL signals;
determine the right time to close a position;
detect institutional activity in the market;
forecast key support and resistance levels;
predict the future price range for any market;
customize any settings and do a backtest with one click;
see historical trades on the chart;
use the fully Automatic Mode where the algorithm optimizes all its settings itself.
When using this script, keep in mind that past results do not necessarily reflect future results and that many factors influence trading results.
FEATURES
Trading signals
The feature calculates trend or swing entry and exit signals. The underlying strategy does not use fixed Take-Profit levels. It trails the price with a Trailing Stop-Loss to get as many pips as possible from price movements.
The feature is based on our custom Volatility Stop algorithm. It uses linear regressions instead of averaging. As our practice shows, this helps to reduce signal lag while keeping the number of false signals low.
Trading signals are customizable with Sensitivity and Trade Length parameters which determine the trading signals frequency and width of the Trailing-Stop levels, respectively.
Automatic Mode
The Trading Signals function has an automatic mode. When it is turned on, you do not need to adjust the trading signals settings. The algorithm tries to calculate the best settings automatically using an optimization algorithm.
In this mode, Buy and Sell signals are displayed as green and red triangles respectively. There are two types of exit signals displayed as circles and crosses. A circle signal means that a price reversal is expected and you can partially close the position. A cross signal means that a trading signal in the opposite direction is expected soon and you can partially or completely close your position.
Support and Resistance Levels
Support/Resistance levels forecasting model. The forecasted levels are non-repainting. Once calculated for a specified period in the future (day, week, month, etc.), they don't change during this period.
The feature allows the trader to plan trades and use the forecasted levels as entry levels and targets for opening and closing positions. Both intraday and higher timeframes are supported.
The forecasting model analyses the distribution of the price time series to find clusters in the data. These clusters are then used to make the key price levels forecast.
Big Money Activity detection
The Big Money Activity tool identifies areas on the price chart associated with instructional traders' activity in the market.
Institutional activity in a trending market can be a leading signal for upcoming reversal. Institutions could be fixing their profit, causing the price to move against the current trend.
Institutional activity in a sideways market can be due to positions accumulation and signal a new trend formation.
The algorithm uses tick volume, volume, and volatility data to forecast activity of institutional investors. The method develops the idea described in the Daigler & Wiley (2015) and Shalen (1993) works. It says that when institutional traders actively open or close their positions in the market, a divergence between volume and volatility time-series arises. It can be due to their use of position-splitting algorithms that reduce the impact of their positions on the market.
Trading Range Forecast
Trading Range Forecast feature predicts the price range of an asset for a selected period of time in the future, called Forecast Horizon. It can be the next day or 12-hour trading session. This function works if your chart timeframe is intraday (i.e. the timeframe below "D"). It shows the upper and lower bounds between which the price is going to stay in the upcoming Forecast Horizon period.
Instant Backtesting
After changing any settings, you can immediately see the performance of the strategy on the Instant Backtesting panel. Two metrics are displayed there - the percentage of profitable trades and the total return. This information, as well as the historical trades shown on the chart, will help you quickly and easily evaluate any settings you make.
SETTINGS
TRADING SIGNALS
Trade Length - defines the length of the trades the algorithm tries to make. Recommended values are from 1.0 to 6.0.
Sensitivity - controls the sensitivity of the trading signals algorithm. The sensitivity determines the density of trading signals and how close the trailing-stop levels follow the price. The higher the value of this parameter is, the less sensitive the algorithm is. High values of the Sensitivity parameters (100-500) can help to withstand large price swings to stay in longer price moves. Lower values (10-100) work well for short- and medium-term trades.
TRADING TOOLS
Big Money Activity - turns on and off the identification of the areas associated with institutional traders activity.
SUPPORТ AND RESISTANCЕ LEVELS
Show Support And Resistance Levels - turns on and off support and resistance levels calculation.
TRADING RANGE FORECAST
Show Trading Range Forecast - turns on/off trading range forecasting
Forecast Horizon - sets the period for which the trading range forecast is made
Forecasting Method - allows to choose a forecasting algorithm for the trading range forecast.
BACKTESTING
Use Starting Date - turns on/off the starting date for the strategy and backtests. When off, all available historical data is used.
Starting Date - sets the starting date for the strategy and backtests.
Show Instant Backtesting Dashboard - turns on/off a dashboard that shows the current strategy performance: the percentage of profitable trades and total return.
Leverage - sets the leverage that the strategy uses.
