AK MACD BB INDICATOR V 1.00Here's my version of the MACD _BB . This is a great indicator to capture short term trends.
yellow candles = long
aqua candles = short
This indicator can be much better. I will work on it and publish an improved version (hopefully) soon. In the mean time , go ahead and play around with the code, and please share your findings :)
Cheers
Algo
Bandas de Bollinger (BB)

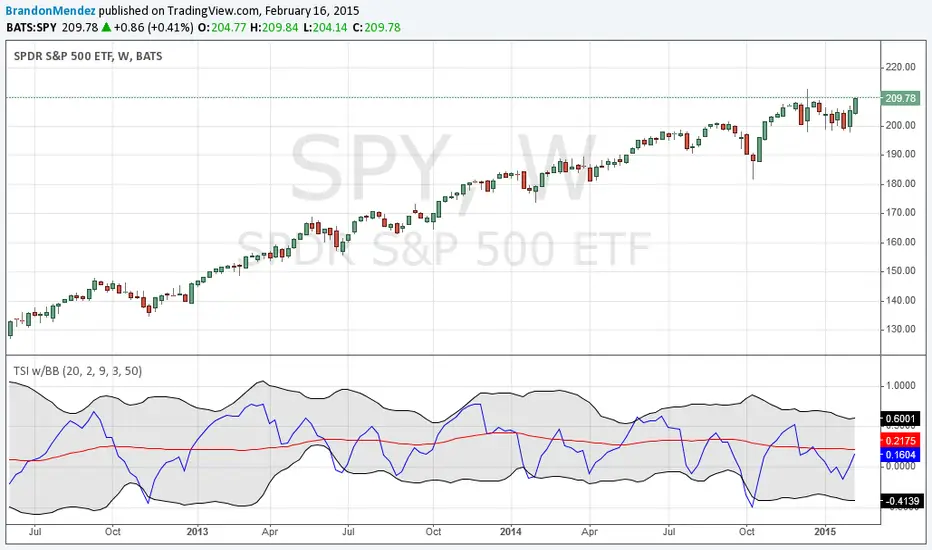
TSI w/BBA simple modification of the normal TSI indicator. It adds Bollinger Bands that are based on the TSI values, instead of the price history.
I find this indicator useful on the weekly interval.
vdub Atlasvdub Atlas, Multiple strategy combined indicator
ichmoku,
inside bollinger bands,
Multiple ma's,
Strength indicator MA's
Hull ma,
vdub binaryPro,
Session background colours.
Switch out any indicator you don't want.

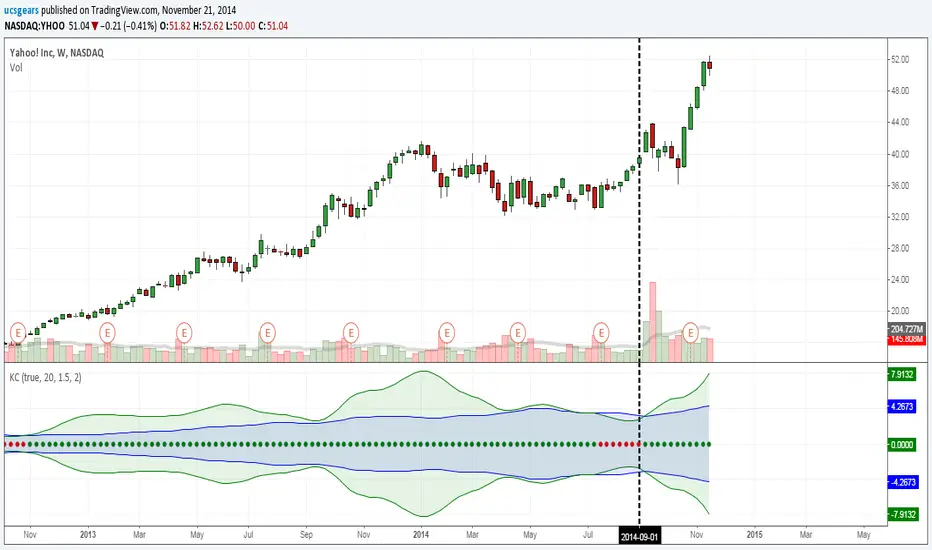
UCS_Squeeze_Timing-V1There is an important information the Squeeze indicator is missing, which is the Pre Squeeze entry. While the Bollinger band begins to curves out of the KC, The breakout usually happens. There are many instances that the Squeeze indicator will fire, after the Major move, I cant blame the indicator, thats the nature (lagging) of all indicators, and we have to live with it.
Therefore pre-squeeze-fire Entry can be critical in timing your entry. Timing it too early could result in stoploss if it turns against you, ( or serious burn on options premium), because we never know when the squeeze will fire with the TTM squeeze, But now We know. Its a little timing tool. Managing position is critical when playing options.
I will code the timing signal when I get some time.
Updated Versions -
Vervoort Smoothed %b [LazyBear]As we know, %b is a measure of where prices are in relation to the outer Bollinger bands and therefore strongly related to volatility. This can get choppy, though.
Vervoort smoothed this using Zero lag TEMA of custom Heiken-ashi recalculated prices. According to Vervoort, "Smoothed Vervoort %b is often a leading indicator making smooth moves with clear turning points. Normal and hidden divergent moves make it an ideal tool to help find entry and exit points while watching price moving between the Bollinger bands."
More info:
drive.google.com
List of my other indicators:
- Chart:
- GDoc: docs.google.com

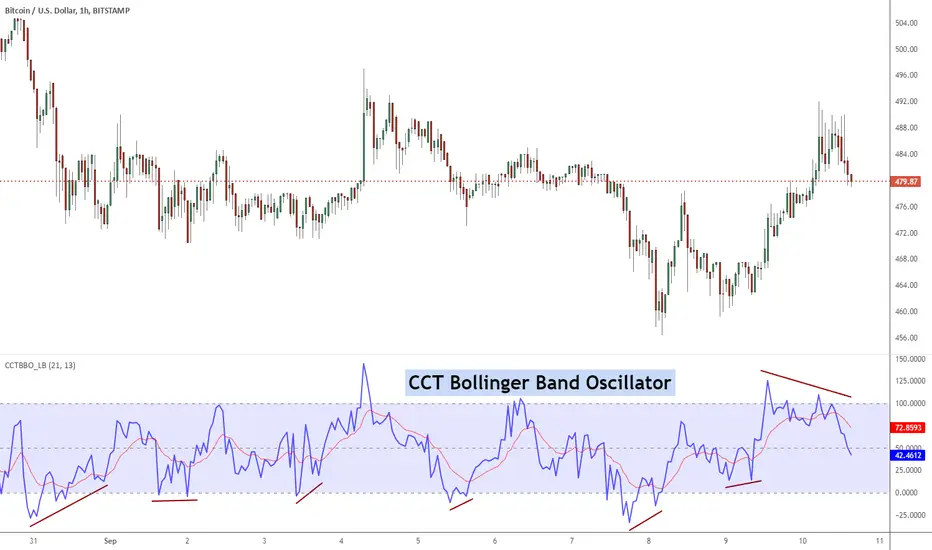
CCT Bollinger Band OscillatorThe CCT Bollinger Band Oscillator (CCTBO), developed by Steve Karnish of Cedar Creek Trading, reconfigures John Bollinger's classic Bollinger Bands (envelopes plotted at two Standard Deviations above and below a moving average) by drawing two parallel lines replacing the envelopes. The parallel lines represent a measurement of two Standard Deviations from the mean and are assigned a value of zero and 100 on the chart.
The indicator represents the price as it travels above and below the mean (50%) and outside the two standard deviations (zero and 100). Penetration of the upper band represents overbought conditions while penetration of the lower band signifies oversold conditions. Usage of the CCT Bollinger Band Oscillator to identify 'failure swings' and 'divergences' can lead to significant reversals.
List of my other indicators:
- Chart:
- GDoc: docs.google.com
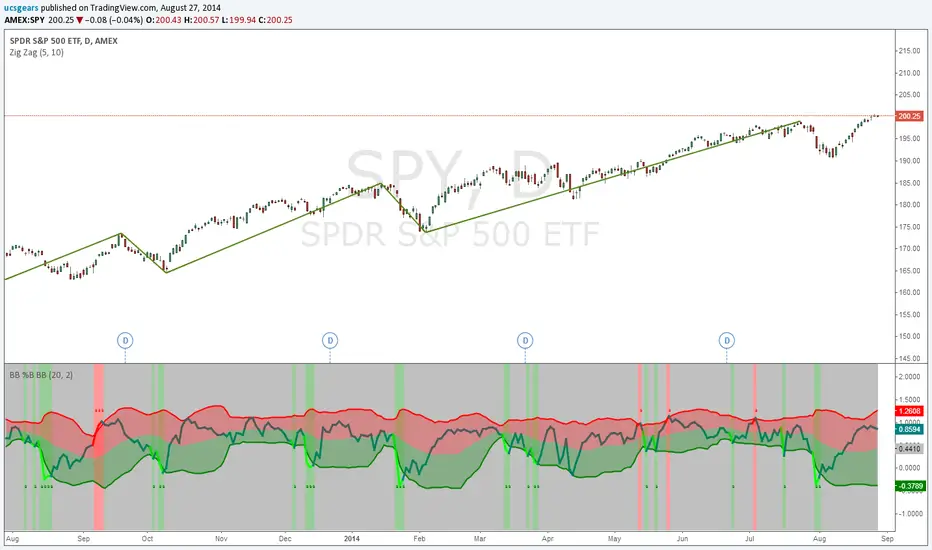
Bollinger Bands %B Bollinger Bands - Version 2Thanks to Chris Moody for his touch
List of All my Indicators - www.tradingview.com
vdubongCustom script I fabricated which I use for Binary Trading on the 1m & 3m charts together with Price action & Time management but the principles are the same for all mediums. Use Price action buy/sell in the clear zones. Use the outer 'pink' horizontal lines (highs / lows / pivots points) to place SL's.
I personally run an additional BB 50/2 for clearer BB higher highs & lower low perspective, but it's not part of the script. Script variables are fully customisable.
I don't take ownership of any part of the script, I not a programmer /script writer just a dabbler. Enjoy :) - VDUBONG UPDATED

DEnvelope [Better Bollinger Bands]*** ***
Bollinger Bands (BB) usually expand quickly after a volatility increase but contract more slowly as volatility declines. This extended time it takes for BB to contract after a volatility drop can make trading some instruments using BB alone difficult or less profitable.
In the October 1998 issue of "Futures" there is an article written by Dennis McNicholl called "Better Bollinger Bands", in which the author recommends improving BB by modifying:
- the center line formula &
- different equations for calculating the bands.
These bands, called "DEnvelope", follow price more closely and respond faster to changes in volatility with these modifications.
Fore more indicators, check out my "Master Index of indicators" (Also check my published charts page for new ones I haven't added to that list):
More scripts related to DEnvelope:
------------------------------------------------
- DEnvelope Bandwidth: pastebin.com
- DEnvelope %B : pastebin.com
Sample chart with above indicators: www.tradingview.com

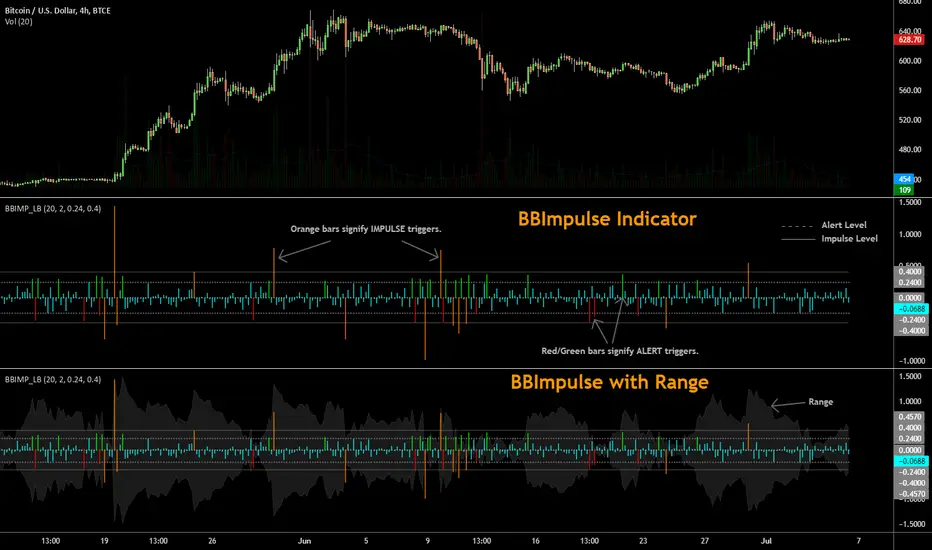
BBImpulse IndicatorBBImpulse is part of the latest indicators package offered by John Bollinger. Excerpt from their market blurb (www.bbforex.com):
"BBImpulse is derived from %b. Its value is the periodic change of %b, so if %b was 0.45 this period and 0.20 last period the present value of BBImpulse is 0.25. We present two reference levels on the chart, an alert level and an impulse level."
"Generally the market moves in the direction of the latest alerts and/or impulses except towards the end of a move where one can take advantage of exhaustion/reversal signals from this indicator."
"Ian Woodward employs BBImpulse for his Kahuna signals using key levels of 0.24 and 0.40."
I added support for the following:
- Highlighting alert/impulse trigger bars
- Rendering the range (check options page).
I noticed that the range, by itself, highlights lot of info:
- Tapering in (narrowing) of range may signify topping or falling prices.
- Tapering out (expanding) may signify nearing a bottom or rising prices.
- Range getting "ranged" between alert or impulse levels signify a major move in the direction of the last impulse trigger. I think for this, alert level ranging intensity is greater than impulse level ranging intensity.
Someone more familiar with BB will have more observations, I am sure. Please do share here so we BB noobs can learn :)
For more indicators, check out my complete list here:
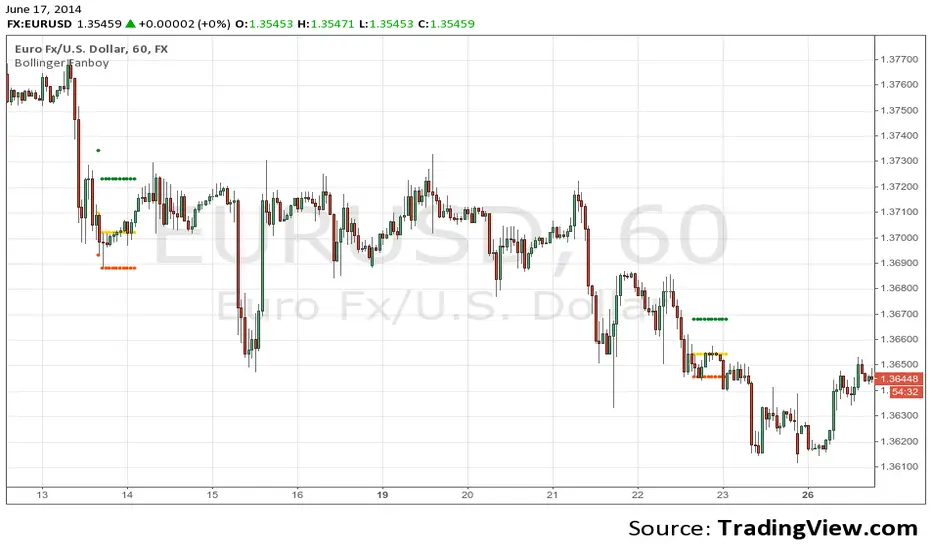
Bollinger FanboyTo use this indicator. Set pending orders to enter at "Entry", stoploss at "Stop", and profit at "Exit". Close pending order after 10 bars if it doesn't open.
Please use this at your own risk. By using this indicator you are agreeing that I am in no way liable for any financial losses that may occur indirectly or directly as a result of using this indicator.
Copyright 2014 Michael Edwards (info@bollingerfanboy.com)
Bollingfanboy.com
Indicator: Custom COG channelThis is my custom channel (Bear Channel!? :)) derived from BB/STARC. It uses both ATR/STDEV for plotting the bounds.
I use COG (Center of Gravity) for deriving the baseline. This enables it to track the price action better than many other channels that make use of MAs or simply "close". Indicator also marks "squeezes" (stdev bands come inside ATR bands). Pay attention to these, as these usually indicate a move.
I am still exploring this indicator on different BTCUSD time frames, would love to hear your feedback / setups for other instruments.
Code for this indicator: pastebin.com
Code for COG fibs I mentioned in the comments: pastebin.com

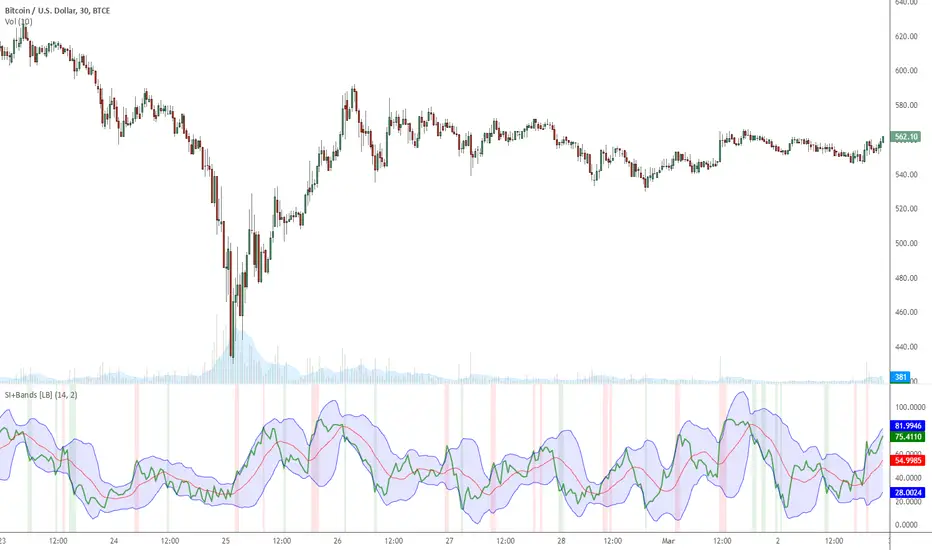
Indicator: MFI or RSI enclosed by Bollinger BandsIndicator allows choosing either MFI or RSI and draws a BB over it to identify oversold / overbought conditions.
Oversold/Overbought breaches are highlighted using different colors for easy identification. Has helped me a lot during sudden pumps to identify the tops, hope you find a use for this.
Trading Strategy based on BB/KC squeeze**** [Edit: New version (v02) posted, see the comments section for the code *****
Simple strategy. You only consider taking a squeeze play when both the upper and lower Bollinger Bands go inside the Keltner Channel. When the Bollinger Bands (BOTH lines) start to come out of the Keltner Channel, the squeeze has been released and a move is about to take place.
I have added more support indicators -- I highlight the bullish / bearish KC breaches (using GREEN/RED crosses) and a SAR to see where price action is trending.
Appreciate any feedback. Enjoy!
Color codes for v02:
----------------------------
When both the upper and lower Bollinger Bands go inside the Keltner Channel, the squeeze is on and is highlighted in RED.
When the Bollinger Bands (BOTH lines) start to come out of the Keltner Channel, the squeeze has been released and is highlighted in GREEN.
When one of the Bollinger Bands is out of Keltner Channel, no highlighting is done (this means, the background color shows up, so don't get confused if you have RED/GREEN in your chart's bground :))
Color codes for v01:
----------------------------
When both the upper and lower Bollinger Bands go inside the Keltner Channel, the squeeze is on and is highlighted in YELLOW.
When the Bollinger Bands (BOTH lines) start to come out of the Keltner Channel, the squeeze has been released and is highlighted in BLUE.
