The Abramelin Protocol [MPL]"Any sufficiently advanced technology is indistinguishable from magic." — Arthur C. Clarke
🌑 SYSTEM OVERVIEW
The Abramelin Protocol is not a standard technical indicator; it is a "Technomantic" trading algorithm engineered to bridge the gap between 15th-century esoteric mathematics and modern high-frequency markets.
This script is the flagship implementation of the MPL (Magic Programming Language) project—an open-source experimental framework designed to compile metaphysical intent into executable Python and Pine Script algorithms.
Unlike traditional indicators that rely on arbitrary constants (like the 14-period RSI or 200 SMA), this protocol calculates its parameters using "Dynamic Entity Gematria." We utilize a custom Python backend to analyze the ASCII vibrational frequencies of specific metaphysical archetypes, reducing them via Tesla's 3-6-9 harmonic principles to derive market-responsive periods.
🧬 WHAT IS ?
MPL (Magic Programming Language) is a domain-specific language and research initiative created to explore Technomancy—the art of treating code as a spellbook and the market as a chaotic entity to be tamed.
By integrating the logic of ancient Grimoires (such as The Book of Abramelin) with modern Data Science, MPL aims to discover hidden correlations in price action that standard tools overlook.
🔗 CONNECT WITH THE PROJECT:
If you are a developer, a trader, or a seeker of hidden knowledge, examine the source code and join the order:
• 📂 Official Project Site: hakanovski.github.io
• 🐍 MPL Source Code (GitHub): github.com
• 👨💻 Developer Profile (LinkedIn): www.linkedin.com
🔢 THE ALGORITHM: 452 - 204 - 50
The inputs for this script are mathematically derived signatures of the intelligence governing the system:
1. THE PAIMON TREND (Gravity)
• Origin: Derived from the ASCII summation of the archetype PAIMON (King of Secret Knowledge).
• Function: This 452-period Baseline acts as the market's "Event Horizon." It represents the deep, structural direction of the asset.
• Price > Line: Bullish Domain.
• Price < Line: Bearish Void.
2. THE ASTAROTH SIGNAL (Trigger)
• Origin: Derived from the ASCII summation of ASTAROTH (Knower of Past & Future), reduced by Tesla’s 3rd Harmonic.
• Function: This is the active trigger line. It replaces standard moving averages with a precise, gematria-aligned trajectory.
3. THE VOLATILITY MATRIX (Scalp)
• Origin: Based on the 9th Harmonic reduction.
• Function: Creates a "Cloud" around the signal line to visualize market noise.
🛡️ THE MILON GATE (Matrix Filter)
Unique to this script is the "MILON Gate" toggle found in the settings.
• ☑️ Active (Default): The algorithm applies the logic of the MILON Magic Square. Signals are ONLY generated if Volume and Volatility align with the geometric structure of the move. This filters out ~80% of false signals (noise).
• ⬜ Inactive: The algorithm operates in "Raw Mode," showing every mathematical crossover without the volume filter.
⚠️ OPERATIONAL USAGE
• Timeframe: Optimized for 4H (The Builder) and Daily (The Architect) charts.
• Strategy: Use the Black/Grey Line (452) as your directional bias. Take entries only when the "EXECUTE" (Long) or "PURGE" (Short) sigils appear.
Use this tool wisely. Risk responsibly. Let the harmonics guide your entries.
— Hakan Yorganci
Technomancer & Full Stack Developer
Bitcoinprice

Ellipse Price Action Indicator v3Successful Trade Setup Using Ellipse Price Action Indicator (EPAI) 🔥
With the help of the Ellipse Price Action Indicator, this bearish trade setup played out perfectly.
EPAI generated a Sell Signal with a red arrow.
According to the EPAI method:
🔹 If price makes a new high on the next candle — add one more unit.
🔹 Every time a new high forms, add one more unit per candle.
🔹 Exit all units at the Moving Average (MA) — this is the core risk-controlled exit rule.
This is why EPAI consistently provides successful trade setups when followed with discipline.
⚠ Important Notice — Last Chance!
The Ellipse Price Action Indicator (EPAI) will soon become PRIVATE.
Access will be restricted only to Premium Members.
✅ First 25 subscribers can use this indicator absolutely FREE.
After that, it will not be available publicly.

The Oracle: Dip & Top Adaptive Sniper [Hakan Yorganci]█ OVERVIEW
The Oracle: Dip & Top Adaptive Sniper is a precision-focused trend trading strategy designed to solve the biggest problem in swing trading: Timing.
Most trend-following strategies chase price ("FOMO"), buying when the asset is already overextended. The Oracle takes a different approach. It adopts a "Sniper" mentality: it identifies a strong macro trend but patiently waits for a Mean Reversion (pullback) to execute an entry at a discounted price.
By combining the structural strength of Moving Averages (SMA 50/200) with the momentum precision of RSI and the volatility filtering of ADX, this script filters out noise and targets high-probability setups.
█ HOW IT WORKS
This strategy operates on a strictly algorithmic protocol known as "The Yorganci Protocol," which involves three distinct phases: Filter, Target, and Execute.
1. The Macro Filter (Trend Identification)
* SMA 200 Rule: By default, the strategy only scans for buy signals when the price is trading above the 200-period Simple Moving Average. This ensures we are always trading in the direction of the long-term bull market.
* Adaptive Switch: A new feature allows users to toggle the Only Buy Above SMA 200? filter OFF. This enables the strategy to hunt for oversold bounces (dead cat bounces) even during bearish or neutral market structures.
2. The Volatility Filter (ADX Integration)
* Sideways Protection: One of the main weaknesses of moving average strategies is "whipsaw" losses during choppy, ranging markets.
* Solution: The Oracle utilizes the ADX (Average Directional Index). It will BLOCK any trade entry if the ADX is below the threshold (Default: 20). This ensures capital is only deployed when a genuine trend is present.
3. The Sniper Entry (Buying the Dip)
* Instead of buying on breakout strength (e.g., RSI > 60), The Oracle waits for the RSI Moving Average to dip into the "Value Zone" (Default: 45) and cross back up. This technique allows for tighter stops and higher Risk/Reward ratios compared to traditional breakout systems.
█ EXIT STRATEGY
The Oracle employs a dynamic dual-exit mechanism to maximize gains and protect capital:
* Take Profit (The Peak): The strategy monitors RSI heat. When the RSI Moving Average breaches the Overbought Threshold (Default: 75), it signals a "Take Profit", securing gains near the local top before a potential reversal.
* Stop Loss (Trend Invalidated): If the market structure fails and the price closes below the 50-period SMA, the position is immediately closed to prevent deep drawdowns.
█ SETTINGS & CONFIGURATION
* Moving Averages: Fully customizable lengths for Support (SMA 50) and Trend (SMA 200).
* Trend Filter: Checkbox to enable/disable the "Bull Market Only" rule.
* RSI Thresholds:
* Sniper Buy Level: Adjustable (Default: 45). Lower values = Deeper dips, fewer trades.
* Peak Sell Level: Adjustable (Default: 75). Higher values = Longer holds, potentially higher profit.
* ADX Filter: Checkbox to enable/disable volatility filtering.
█ BEST PRACTICES
* Timeframe: Designed primarily for 4H (4-Hour) charts for swing trading. It can also be used on 1H for more frequent signals.
* Assets: Highly effective on trending assets such as Bitcoin (BTC), Ethereum (ETH), and high-volume Altcoins.
* Risk Warning: This strategy is designed for "Long Only" spot or leverage trading. Always use proper risk management.
█ CREDITS
* Original Concept: Inspired by the foundational work of Murat Besiroglu (@muratkbesiroglu).
* Algorithm Development & Enhancements: Developed by Hakan Yorganci (@hknyrgnc).
* Modifications include: Integration of ADX filters, Mean Reversion entry logic (RSI Dip), and Dynamic Peak Profit taking.

Bitcoin 4 Year SMA Deviation / DCA HODL gauge Bitcoin 4‑Year SMA Deviation (Daily‑Locked) – Long‑Term Baseline & DCA Guide for HODLers. Bitcoin’s price swings wildly in the short term, but over several years it tends to settle around a smoother trend. A 4‑year simple moving average (SMA) captures that long‑term trajectory, filtering out daily noise, and giving a reliable “baseline” that reflects Bitcoin’s underlying growth path.
Historical consistency: Most of Bitcoin’s major cycles have respected the 4‑year SMA, making it a trustworthy yardstick for anyone who holds the asset for the long term.
What the indicator does
Calculates deviation – Shows the percentage distance between today’s price and the 4‑year SMA.
Displays a histogram – Visualizes the deviation in real‑time, colour‑coded to highlight how far the price sits above or below the baseline.
Daily‑locked logic – All calculations are performed on daily candles, so the signal looks the same whether you view the chart on a 1‑minute, 4‑hour, or weekly timeframe.
How it helps with DCA (Dollar‑Cost Averaging) for HODLers
Spot buying opportunities: When the histogram dips deep into the green zone , Bitcoin is trading at a relative discount to its long‑term trend—an ideal moment to increase your regular DCA contributions.
Guard against over‑buying: A strong positive deviation indicates a "red zone" , the market is stretched above its historic baseline, suggesting a smaller or paused DCA pace.
Quantify confidence: The exact percentage off the SMA gives you a concrete metric to size each DCA tranche, turning gut feeling into a data‑driven plan.
Bottom line for HODLers
Treat the 4‑year SMA as your long‑term compass for Bitcoin. This indicator tells you how far the current price has drifted from that compass, allowing you to decide how aggressively—or conservatively—to execute your DCA strategy. Use it alongside your personal risk tolerance and holding horizon to fine‑tune the cadence and size of your regular Bitcoin purchases. When in doubt, zoom out!

CME Bitcoin Weekend Gap (Global) @jerikooDescription:
The Problem: You are watching the wrong hours. Many traders assume CME Bitcoin futures follow standard stock market hours or open Monday morning. This is incorrect.
Stock Market: Opens Monday morning.
CME Bitcoin: Opens Sunday Evening (US Time).
If you are in Europe, this means the market actually opens at Midnight (00:00) Monday. If you are waiting for the "Monday Morning Open," you are late.
The Solution: True Gap Detection This indicator highlights the exact downtime of the CME Bitcoin Futures market to help you identify true liquidity gaps.
Why this script is different: Most gap scripts break when you change your chart's time zone (e.g., switching from UTC to New York). This script is Universal.
Hardcoded Exchange Time: It calculates logic based on "America/Chicago" (CME HQ) time, regardless of your local chart settings.
Manual Offset Fix: Some data feeds have a +/- 1 or 2-hour sync difference depending on the broker. This script includes a "Hour Shift" setting to manually align the box perfectly to your specific candles.
How to use:
Add to your chart.
Look for the Dark Green highlighted zone.
This zone represents the Weekend Gap (Friday Close to Sunday Open).
Troubleshooting: If the box starts 1-2 hours too early or too late, go to Settings and change the "Hour Shift" value (e.g., -1, +1) until it snaps perfectly to the Friday close candle.
Technical Details:
CME Close: Friday 16:00 CT
CME Open: Sunday 17:00 CT
Color: Dark Green (50% Transparency)
Step 3: Categories & Tags
Select these options in the right-hand menu of the publishing page.
Category: Trend Analysis OR Bitcoin
Tags: CME Bitcoin BTC Gap Futures Weekend
Step 4: Final Checklist Before Clicking "Publish"
Load the Code: Make sure the "Manual Fix" version of the code (the last one I gave you) is currently open in the Pine Editor.
Add to Chart: You must click "Add to Chart" so the script is visible on your screen before publishing.
Privacy: Select Public (so others can search for it) or Private (if you only want to share the link).
Visibility: Choose Open (so others can see the code) or Protected (if you want to hide the code, though Open is better for simple scripts like this).

Puell Multiple Variants [OperationHeadLessChicken]Overview
This script contains three different, but related indicators to visualise Bitcoin miner revenue.
The classical Puell Multiple : historically, it has been good at signaling Bitcoin cycle tops and bottoms, but due to the diminishing rewards miners get after each halving, it is not clear how you determine overvalued and undervalued territories on it. Here is how the other two modified versions come into play:
Halving-Corrected Puell Multiple : The idea is to multiply the miner revenue after each halving with a correction factor, so overvalued levels are made comparable by a horizontal line across cycles. After experimentation, this correction factor turned out to be around 1.63. This brings cycle tops close to each other, but we lose the ability to see undervalued territories as a horizontal region. The third variant aims to fix this:
Miner Revenue Relative Strength Index (Miner Revenue RSI) : It uses RSI to map miner revenue into the 0-100 range, making it easy to visualise over/undervalued territories. With correct parameter settings, it eliminates the diminishing nature of the original Puell Multiple, and shows both over- and undervalued revenues correctly.
Example usage
The goal is to determine cycle tops and bottoms. I recommend using it on high timeframes, like monthly or weekly . Lower than that, you will see a lot of noise, but it could still be used. Here I use monthly as the example.
The classical Puell Multiple is included for reference. It is calculated as Miner Revenue divided by the 365-day Moving Average of the Miner Revenue . As you can see in the picture below, it has been good at signaling tops at 1,3,5,7.
The problems:
- I have to switch the Puell Multiple to a logarithmic scale
- Still, I cannot use a horizontal oversold territory
- 5 didn't touch the trendline, despite being a cycle top
- 9 touched the trendline despite not being a cycle top
Halving-Corrected Puell Multiple (yellow): Multiplies the Puell Multiple by 1.63 (a number determined via experimentation) after each halving. In the picture below, you can see how the Classical (white) and Corrected (yellow) Puell Multiples compare:
Advantages:
- Now you can set a constant overvalued level (12.49 in my case)
- 1,3,7 are signaled correctly as cycle tops
- 9 is correctly not signaled as a cycle top
Caveats:
- Now you don't have bottom signals anymore
- 5 is still not signaled as cycle top
Let's see if we can further improve this:
Miner Revenue RSI (blue):
On the monthly, you can see that an RSI period of 6, an overvalued threshold of 90, and an undervalued threshold of 35 have given historically pretty good signals.
Advantages:
- Uses two simple and clear horizontal levels for undervalued and overvalued levels
- Signaling 1,3,5,7 correctly as cycle tops
- Correctly does not signal 9 as a cycle top
- Signaling 4,6,8 correctly as cycle bottoms
Caveats:
- Misses two as a cycle bottom, although it was a long time ago when the Bitcoin market was much less mature
- In the past, gave some early overvalued signals
Usage
Using the example above, you can apply these indicators to any timeframe you like and tweak their parameters to obtain signals for overvalued/undervalued BTC prices
You can show or hide any of the three indicators individually
Set overvalued/undervalued thresholds for each => the background will highlight in green (undervalued) or red (overvalued)
Set special parameters for the given indicators: correction factor for the Corrected Puell and RSI period for Revenue RSI
Show or hide halving events on the indicator panel
All parameters and colours are adjustable

BTC Cycle Halving Thirds NicoThe bold black vertical lines are the INDEX:BTCUSD halvings.
The background speak for itself.
Time to be bearish?

Bitcoin Halving Strategy
A systematic, data-driven trading strategy based on Bitcoin's 4-year halving cycles. This strategy capitalizes on historical price patterns that emerge around halving events, providing clear entry and exit signals for both accumulation and profit-taking phases.
🎯 Strategy Overview
This automated trading system identifies optimal buy and sell zones based on the predictable Bitcoin halving cycle that occurs approximately every 4 years. By analyzing historical data from all previous halvings (2012, 2016, 2020, 2024), the strategy pinpoints high-probability trading opportunities.
📊 Key Features
Automated Signal Generation: Buy signals at halving events and DCA zones, sell signals at profit-taking peaks
Multi-Phase Analysis: Tracks Accumulation, Profit Taking, Bear Market, and DCA phases
Visual Dashboard: Real-time performance metrics, phase countdown, and position tracking
Backtesting Enabled: Comprehensive historical performance analysis with configurable parameters
Risk Management: Built-in position sizing, slippage control, and optional short trading
⚙️ Strategy Logic
Buy Signals:
At halving event (Week 0)
DCA zone entry (Week 135 post-halving)
Sell Signals:
Profit-taking zone (Week 80 post-halving)
Optional short position entry for advanced traders
📈 Performance Highlights
Captures major bull run profits while avoiding prolonged bear markets
Clear visual indicators for all phases and transitions
Customizable timing parameters for personalized risk tolerance
Professional dashboard with live P&L, win rate, and drawdown metrics
🛠️ Customization Options
Adjustable phase timing (profit start/end, DCA timing)
Position sizing control
Enable/disable short trading
Visual customization (colors, labels, zones)
Table positioning and transparency
⚠️ Risk Disclosure
Past performance does not guarantee future results. This strategy is based on historical halving cycle patterns and should be used as part of a comprehensive trading plan. Always conduct your own research and consider your risk tolerance before trading.
💡 Ideal For
Long-term Bitcoin investors seeking systematic entry/exit points
Swing traders capitalizing on multi-month trends
Portfolio managers implementing cycle-based allocation strategies

MVRV Ratio [Alpha Extract]The MVRV Ratio Indicator provides valuable insights into Bitcoin market cycles by tracking the relationship between market value and realized value. This powerful on-chain metric helps traders identify potential market tops and bottoms, offering clear buy and sell signals based on historical patterns of Bitcoin valuation.
🔶 CALCULATION The indicator processes MVRV ratio data through several analytical methods:
Raw MVRV Data: Collects MVRV data directly from INTOTHEBLOCK for Bitcoin
Optional Smoothing: Applies simple moving average (SMA) to reduce noise
Status Classification: Categorizes market conditions into four distinct states
Signal Generation: Produces trading signals based on MVRV thresholds
Price Estimation: Calculates estimated realized price (Current price / MVRV ratio)
Historical Context: Compares current values to historical extremes
Formula:
MVRV Ratio = Market Value / Realized Value
Smoothed MVRV = SMA(MVRV Ratio, Smoothing Length)
Estimated Realized Price = Current Price / MVRV Ratio
Distance to Top = ((3.5 / MVRV Ratio) - 1) * 100
Distance to Bottom = ((MVRV Ratio / 0.8) - 1) * 100
🔶 DETAILS Visual Features:
MVRV Plot: Color-coded line showing current MVRV value (red for overvalued, orange for moderately overvalued, blue for fair value, teal for undervalued)
Reference Levels: Horizontal lines indicating key MVRV thresholds (3.5, 2.5, 1.0, 0.8)
Zone Highlighting: Background color changes to highlight extreme market conditions (red for potentially overvalued, blue for potentially undervalued)
Information Table: Comprehensive dashboard showing current MVRV value, market status, trading signal, price information, and historical context
Interpretation:
MVRV ≥ 3.5: Potential market top, strong sell signal
MVRV ≥ 2.5: Overvalued market, consider selling
MVRV 1.5-2.5: Neutral market conditions
MVRV 1.0-1.5: Fair value, consider buying
MVRV < 1.0: Potential market bottom, strong buy signal
🔶 EXAMPLES
Market Top Identification: When MVRV ratio exceeds 3.5, the indicator signals potential market tops, highlighting periods where Bitcoin may be significantly overvalued.
Example: During bull market peaks, MVRV exceeding 3.5 has historically preceded major corrections, helping traders time their exits.
Bottom Detection: MVRV values below 1.0, especially approaching 0.8, have historically marked excellent buying opportunities.
Example: During bear market bottoms, MVRV falling below 1.0 has identified the most profitable entry points for long-term Bitcoin accumulation.
Tracking Market Cycles: The indicator provides a clear visualization of Bitcoin's market cycles from undervalued to overvalued states.
Example: Following the progression of MVRV from below 1.0 through fair value and eventually to overvalued territory helps traders position themselves appropriately throughout Bitcoin's market cycle.
Realized Price Support: The estimated realized price often acts as a significant
support/resistance level during market transitions.
Example: During corrections, price often finds support near the realized price level calculated by the indicator, providing potential entry points.
🔶 SETTINGS
Customization Options:
Smoothing: Toggle smoothing option and adjust smoothing length (1-50)
Table Display: Show/hide the information table
Table Position: Choose between top right, top left, bottom right, or bottom left positions
Visual Elements: All plots, lines, and background highlights can be customized for color and style
The MVRV Ratio Indicator provides traders with a powerful on-chain metric to identify potential market tops and bottoms in Bitcoin. By tracking the relationship between market value and realized value, this indicator helps identify periods of overvaluation and undervaluation, offering clear buy and sell signals based on historical patterns. The comprehensive information table delivers valuable context about current market conditions, helping traders make more informed decisions about market positioning throughout Bitcoin's cyclical patterns.

MSTR mNAV IndicatorStrategy mNAV Indicator
Script contains hard-coded historic share counts and BTC holdings of Strategy Inc. ( NASDAQ:MSTR ). Using these, we derived the Bitcoin mNAV multiple for the company. The formula used in this script looks like the following:
mNAV = (Fully Diluted Shares Outstanding * NASDAQ:MSTR ) / (BTC holdings * BITSTAMP:BTCUSD )
This value appears in the Blue tag at the right hand side of the chart on the latest bar. In addition, the script displays mNAV layers below and above the normal ticker chart. These are computed by taking fixing a value for the mNAV (e.g. mNAV=3) and solving the equation above for the NASDAQ:MSTR price that would equate to having that mNAV.
The user is able to configure the number of said mNAV lines to draw but is limited from mNAV = 1 up to mNAV = 20.
Why is the script private?
This script includes data on the relative count of fully diluted shares for Strategy ( NASDAQ:MSTR ) that was manually determined by the author after going through countless hours of SEC disclosures. Since there is no publicly available repository for this information and the author would like to retain the right to make this available at a later date, the script is kept private.

Long-Term VWAP Mean Reversion SDCACore Idea:
This indicator is designed to support Strategic Dollar Cost Averaging (SDCA) for Bitcoin using a cumulative VWAP-based mean reversion model. It helps long-term investors identify high-conviction buy zones and overbought conditions using statistical deviation from the cumulative VWAP. This indicator evaluates how much price is stretched from the true market average price, weighted by cumulative volume over time.
Core Concepts and Formulas:
Cumulative VWAP (Volume Weighted Average Price):
VWAP cumulative = ∑(Price×Volume) / ∑Volume
A long-term anchor that reflects the average dollar cost of all market participants across all candles. This version does not reset daily, unlike intraday VWAP.
VWAP Deviation % :
Deviation% = Price - VWAP cumulative / VWAP cumulative x 100
Shows how far current price has diverged from the long-term fair value.
Z-Score of VWAP Deviation:
Z= (Price−VWAP)−μ / σ (lookback period: default 200)
SDCA Multiplier Mapping:
*Keep in mind in my Z-Score system, -2 represents the overbought level (white horizontal line) and +2 represents oversold (cyan horizontal line) conditions. So the scores on the Y axis and Z-score in the table are reversed.
| Z-Score Range | SDCA Multiplier |
---------------------------------------------
| ≤ -2 | 0.25×
| -1 to +1 | 1.0×
| > +2 | 2.0×
The pink line plots this multiplier. It’s meant to control buy weight at each time step.
How to Use This for SDCA:
-Buy normally when the multiplier is 1.0× (Z-score between -1 and +1)
-Accelerate buying when Z-score is deeply negative (price far below VWAP)
-Slow or pause buying when Z-score is high (price far above VWAP)
-Use the stats panel to track current Z-score, VWAP level, deviation %, and multiplier
-Watch the red/blue backgrounds as visual confirmation of oversold/overbought zones
Inputs:
Z-Score Lookback Length:
Default: 200 but can be adjusted.
Visuals:
Z-Score Line (cyan): shows current standardized deviation from VWAP
Multiplier Line (bright pink): your SDCA intensity signal
Background Zones: cyan = oversold, white = overbought
Horizontal Lines: +2 and -2 standard deviation thresholds
Stats Panel (bottom right): live values for Z-score, multiplier, price, VWAP, and the deviation formula
Suited For:
-Long-term Bitcoin investors
-SDCA Systems
-Mean reversion systems
-Macro-level buy/sell planning

Bitcoin as % Global M2 signalThis script provides signal system:
Buy signal: each time the YoY of the Global M2 rises more than 2.5% while the distance between the bitcoin price as a percentage of the Global M2 is below its yearly SMA.
Sell signal: the distance between the bitcoin price as a percentage of the Global M2 and its yearly SMA is > 0.7
This is a very simple system, but it seems to work pretty well to ride the bitcoin price cycle wave.
The parameters are hard coded but they can be easily changed to test different levels for both the buy and sell signals.

Global M2 YoY % Increase signalThe script produces a signal each time the global M2 increases more than 2.5%. This usually coincides with bitcoin prices pumps, except when it is late in the business cycle or the bitcoin price / halving cycle.
It leverages dylanleclair Global M2 YoY % change, with several modifications:
adding a 10 week lead at the YoY Change plot for better visibility, so that the bitcoin pump moreless coincides with the YoY change.
signal increases > 2.5 in Global M2 at the point at which they occur with a green triangle up.

BTC Price-Volume Efficiency Z-Score (PVER-Z)Overview:
This PVER-Z Score measures Bitcoin’s price movement efficiency relative to trading volume, normalized using a Z-Score over a long-term 200-day period.
It highlights statistically rare inefficiencies, helping investors spot extreme accumulation and distribution zones for systematic SDCA strategies.
Concept:
- Measures how efficiently price has moved relative to the volume that supported it over a long historical window (Default 200 days) but can be adjustable.
- It compares cumulative price changes vs cumulative volume flow.
- Then normalizes those inefficiencies using Z-Score statistics.
How It Works:
1. Calculates the absolute daily price change divided by volume (price-volume efficiency ratio).
2. Applies EMA smoothing to remove noisy fluctuations.
3. Normalizes the result into a Z-Score to detect statistically significant outliers.
4. Plots dynamic heatmap colors as the efficiency score moves through different deviation zones.
5. Background fills appear when the Z-Score moves beyond ±2 to ±3 SD, signaling rare macro opportunities.
Why is Bitcoin price rising while PVER-Z is falling toward green zone?
1. PVER-Z is not just "price" — it's price change relative to volume. PVER-Z measures how efficient the price movement is relative to volume. It's not "price going up" or "price going down" directly. It's how unusual or inefficient the price versus volume relationship is, compared to its historical average.
2. A rising Bitcoin price + weak efficiency = PVER-Z falls.
If Bitcoin rises but volume is super strong (normal buying volume), no problem, the PVER-Z stays normal. If Bitcoin rises but with very weak volume support, PVER-Z falls.
***Usage Notes***:
- Best used on the daily timeframe or higher.
- When the Z-Score enters the green zone (-2 to -3 SD), it signals a historically rare accumulation zone — favoring long-term buying for SDCA.
- When the Z-Score enters the red zone (+2 to +3 SD), it signals overextended distribution — caution recommended.
- Designed strictly for mean-reversion analysis, no trend-following signals.
- The red zone on a proper Z chart would be -2SD to -3SD and +2SD to +3SD for the green zone. At the time of publishing I do not know how to adjust the values on the indicator itself. The red zone at -2SD is actually +2 Standard Deviations on a Z Score SD Chart. (overbought zone).
- Your green zone at +2SD is actually -2SD Standard Deviations (oversold zone).
- Built manually with no reliance on built-in indicators
- Designed for Bitcoin on the 1D, 3D, or Weekly timeframes. NOT for intraday trading.
- DO NOT SOELY RELY ON THIS INDICATOR FOR YOUR LONG TERM VALUATION. I AM NOT RESPONSIBLE FOR YOUR FINANICAL ASSETS.

Sentiment OscillatorIn the complex world of trading, understanding market sentiment can be like reading the emotional pulse of financial markets. Our Sentiment Oscillator is designed to be your personal market mood translator, helping you navigate through the noise of price movements and market fluctuations.
Imagine having a sophisticated tool that goes beyond traditional price charts, diving deep into the underlying dynamics of market behavior. This indicator doesn't just show you numbers – it tells you a story about market sentiment, combining multiple financial signals to give you a comprehensive view of potential market directions.
The Sentiment Oscillator acts like a sophisticated emotional barometer for stocks, cryptocurrencies, or any tradable asset. It analyzes price changes, market volatility, trading volume, and long-term trends to generate a unique sentiment score. This score ranges from highly bullish to deeply bearish, providing traders with an intuitive visual representation of market mood.
Green zones indicate positive market sentiment, suggesting potential buying opportunities. Red zones signal caution, hinting at possible downward trends. The oscillator's gray neutral zone helps you identify periods of market uncertainty, allowing for more calculated trading decisions.
What sets this indicator apart is its ability to blend multiple market factors into a single, easy-to-understand indicator. It's not just about current price – it's about understanding the deeper currents moving beneath the surface of market prices.
Traders can use this oscillator to:
- Identify potential trend reversals
- Understand market sentiment beyond price movement
- Spot periods of market strength or weakness
- Complement other technical analysis tools
Whether you're a day trader, swing trader, or long-term investor, the Sentiment Oscillator provides an additional layer of insight to support your trading strategy. Remember, no indicator is a crystal ball, but this tool can help you make more informed decisions in the dynamic world of trading.

Cabal Dev IndicatorThis is a TradingView Pine Script (version 6) that creates a technical analysis indicator called the "Cabal Dev Indicator." Here's what it does:
1. Core Functionality:
- It calculates a modified version of the Stochastic Momentum Index (SMI), which is a momentum indicator that shows where the current close is relative to the high/low range over a period
- The indicator combines elements of stochastic oscillator calculations with exponential moving averages (EMA)
2. Key Components:
- Uses configurable input parameters for:
- Percent K Length (default 15)
- Percent D Length (default 3)
- EMA Signal Length (default 15)
- Smoothing Period (default 5)
- Overbought level (default 40)
- Oversold level (default -40)
3. Calculation Method:
- Calculates the highest high and lowest low over the specified period
- Finds the difference between current close and the midpoint of the high-low range
- Applies EMA smoothing to both the range and relative differences
- Generates an SMI value and further smooths it using a simple moving average (SMA)
- Creates an EMA signal line based on the smoothed SMI
4. Visual Output:
- Plots the smoothed SMI line in green
- Plots an EMA signal line in red
- Shows overbought and oversold levels as gray horizontal lines
- Fills the areas above the overbought level with light red
- Fills the areas below the oversold level with light green
This indicator appears designed to help traders identify potential overbought and oversold conditions in the market, as well as momentum shifts, which could be used for trading decisions.
Would you like me to explain any specific part of the indicator in more detail?

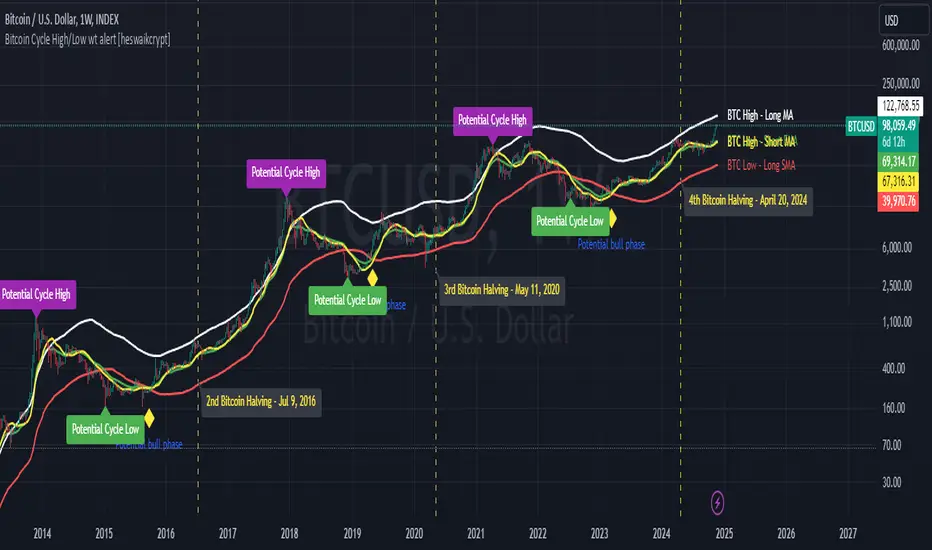
Bitcoin Cycle High/Low with functional Alert [heswaikcrypt]Introduction
Just as machines are fine-tuned for maximum efficiency, trading indicators must evolve to meet the demands of ever-changing markets.
Credit goes to the initial author, @NoCreditsLeft I only improved the existing Pi-cycle indicator with a functional alert and included a bull mode indicator in the script. The alert can help you get a live alert at candle close when the cycle tops, bottoms, and the potential bull phase switch occurs.
Philip Swift’s Pi Cycle Top Indicator is a brilliant example of leveraging mathematical relationships to signal critical turning points in Bitcoin’s price cycles. Historically, it has identified market and local tops with some relative accuracy, often within three days, as demonstrated in all the previous bull run cycles.
At its core, the Pi Cycle Indicator derives its name from the mathematical constant π (pi), achieved by using simple moving averages (MAs) in a specific ratio: 𝜋 = Long MA/short MA
The Bull mode switch is calculated using a crossover of the short exponentia moving average and the long moving average.
.
.
.
Knowing when Bitcoin reaches its top—and receiving timely alerts about it—is crucial for successful trading. The indicator is designed to signal;
Potential Bitcoin tops: Purple label
Potential Bitcoin bottoms : green Label, and
Parabolic swing : Yellow diamond shape (relating to the market switching to a potential bull mode)
"Please note: This indicator is tailored for Bitcoin using historical data analysis and should not be considered definitive. However accurate it might be."
Setting alerts
To set the alert conditions, select any alert function call to get alert whenever the conditions are met. The script is configured on dialy TF; you can set it on 1D or weekly TF.
Enjoy and Trade smartly
2024 - Median High-Low % Change - Monthly, Weekly, DailyDescription:
This indicator provides a statistical overview of Bitcoin's volatility by displaying the median high-to-low percentage changes for monthly, weekly, and daily timeframes. It allows traders to visualize typical price fluctuations within each period, supporting range and volatility-based trading strategies.
How It Works:
Calculation of High-Low % Change: For each selected timeframe (monthly, weekly, and daily), the script calculates the percentage change from the high to the low price within the period.
Median Calculation: The median of these high-to-low changes is determined for each timeframe, offering a robust central measure that minimizes the impact of extreme price swings.
Table Display: At the end of the chart, the script displays a table in the top-right corner with the median values for each selected timeframe. This table is updated dynamically to show the latest data.
Usage Notes:
This script includes input options to toggle the visibility of each timeframe (monthly, weekly, and daily) in the table.
Designed to be used with Bitcoin on daily and higher timeframes for accurate statistical insights.
Ideal for traders looking to understand Bitcoin's typical volatility and adjust their strategies accordingly.
This indicator does not provide specific buy or sell signals but serves as an analytical tool for understanding volatility patterns.

Bitcoin CME-Spot Z-Spread - Strategy [presentTrading]This time is a swing trading strategy! It measures the sentiment of the Bitcoin market through the spread of CME Bitcoin Futures and Bitfinex BTCUSD Spot prices. By applying Bollinger Bands to the spread, the strategy seeks to capture mean-reversion opportunities when prices deviate significantly from their historical norms
█ Introduction and How it is Different
The Bitcoin CME-Spot Bollinger Bands Strategy is designed to capture mean-reversion opportunities by exploiting the spread between CME Bitcoin Futures and Bitfinex BTCUSD Spot prices. The strategy uses Bollinger Bands to detect when the spread between these two correlated assets has deviated significantly from its historical norm, signaling potential overbought or oversold conditions.
What sets this strategy apart is its focus on spread trading between futures and spot markets rather than price-based indicators. By applying Bollinger Bands to the spread rather than individual prices, the strategy identifies price inefficiencies across markets, allowing traders to take advantage of the natural reversion to the mean that often occurs in these correlated assets.
BTCUSD 8hr Performance
█ Strategy, How It Works: Detailed Explanation
The strategy relies on Bollinger Bands to assess the volatility and relative deviation of the spread between CME Bitcoin Futures and Bitfinex BTCUSD Spot prices. Bollinger Bands consist of a moving average and two standard deviation bands, which help measure how much the spread deviates from its historical mean.
🔶 Spread Calculation:
The spread is calculated by subtracting the Bitfinex spot price from the CME Bitcoin futures price:
Spread = CME Price - Bitfinex Price
This spread represents the difference between the futures and spot markets, which may widen or narrow based on supply and demand dynamics in each market. By analyzing the spread, the strategy can detect when prices are too far apart (potentially overbought or oversold), indicating a trading opportunity.
🔶 Bollinger Bands Calculation:
The Bollinger Bands for the spread are calculated using a simple moving average (SMA) and the standard deviation of the spread over a defined period.
1. Moving Average (SMA):
The simple moving average of the spread (mu_S) over a specified period P is calculated as:
mu_S = (1/P) * sum(S_i from i=1 to P)
Where S_i represents the spread at time i, and P is the lookback period (default is 200 bars). The moving average provides a baseline for the normal spread behavior.
2. Standard Deviation:
The standard deviation (sigma_S) of the spread is calculated to measure the volatility of the spread:
sigma_S = sqrt((1/P) * sum((S_i - mu_S)^2 from i=1 to P))
3. Upper and Lower Bollinger Bands:
The upper and lower Bollinger Bands are derived by adding and subtracting a multiple of the standard deviation from the moving average. The number of standard deviations is determined by a user-defined parameter k (default is 2.618).
- Upper Band:
Upper Band = mu_S + (k * sigma_S)
- Lower Band:
Lower Band = mu_S - (k * sigma_S)
These bands provide a dynamic range within which the spread typically fluctuates. When the spread moves outside of these bands, it is considered overbought or oversold, potentially offering trading opportunities.
Local view
🔶 Entry Conditions:
- Long Entry: A long position is triggered when the spread crosses below the lower Bollinger Band, indicating that the spread has become oversold and is likely to revert upward.
Spread < Lower Band
- Short Entry: A short position is triggered when the spread crosses above the upper Bollinger Band, indicating that the spread has become overbought and is likely to revert downward.
Spread > Upper Band
🔶 Risk Management and Profit-Taking:
The strategy incorporates multi-step take profits to lock in gains as the trade moves in favor. The position is gradually reduced at predefined profit levels, reducing risk while allowing part of the trade to continue running if the price keeps moving favorably.
Additionally, the strategy uses a hold period exit mechanism. If the trade does not hit any of the take-profit levels within a certain number of bars, the position is closed automatically to avoid excessive exposure to market risks.
█ Trade Direction
The trade direction is based on deviations of the spread from its historical norm:
- Long Trade: The strategy enters a long position when the spread crosses below the lower Bollinger Band, signaling an oversold condition where the spread is expected to narrow.
- Short Trade: The strategy enters a short position when the spread crosses above the upper Bollinger Band, signaling an overbought condition where the spread is expected to widen.
These entries rely on the assumption of mean reversion, where extreme deviations from the average spread are likely to revert over time.
█ Usage
The Bitcoin CME-Spot Bollinger Bands Strategy is ideal for traders looking to capitalize on price inefficiencies between Bitcoin futures and spot markets. It’s especially useful in volatile markets where large deviations between futures and spot prices occur.
- Market Conditions: This strategy is most effective in correlated markets, like CME futures and spot Bitcoin. Traders can adjust the Bollinger Bands period and standard deviation multiplier to suit different volatility regimes.
- Backtesting: Before deployment, backtesting the strategy across different market conditions and timeframes is recommended to ensure robustness. Adjust the take-profit steps and hold periods to reflect the trader’s risk tolerance and market behavior.
█ Default Settings
The default settings provide a balanced approach to spread trading using Bollinger Bands but can be adjusted depending on market conditions or personal trading preferences.
🔶 Bollinger Bands Period (200 bars):
This defines the number of bars used to calculate the moving average and standard deviation for the Bollinger Bands. A longer period smooths out short-term fluctuations and focuses on larger, more significant trends. Adjusting the period affects the responsiveness of the strategy:
- Shorter periods (e.g., 100 bars): Makes the strategy more reactive to short-term market fluctuations, potentially generating more signals but increasing the risk of false positives.
- Longer periods (e.g., 300 bars): Focuses on longer-term trends, reducing the frequency of trades and focusing only on significant deviations.
🔶 Standard Deviation Multiplier (2.618):
The multiplier controls how wide the Bollinger Bands are around the moving average. By default, the bands are set at 2.618 standard deviations away from the average, ensuring that only significant deviations trigger trades.
- Higher multipliers (e.g., 3.0): Require a more extreme deviation to trigger trades, reducing trade frequency but potentially increasing the accuracy of signals.
- Lower multipliers (e.g., 2.0): Make the bands narrower, increasing the number of trade signals but potentially decreasing their reliability.
🔶 Take-Profit Levels:
The strategy has four take-profit levels to gradually lock in profits:
- Level 1 (3%): 25% of the position is closed at a 3% profit.
- Level 2 (8%): 20% of the position is closed at an 8% profit.
- Level 3 (14%): 15% of the position is closed at a 14% profit.
- Level 4 (21%): 10% of the position is closed at a 21% profit.
Adjusting these take-profit levels affects how quickly profits are realized:
- Lower take-profit levels: Capture gains more quickly, reducing risk but potentially cutting off larger profits.
- Higher take-profit levels: Let trades run longer, aiming for bigger gains but increasing the risk of price reversals before profits are locked in.
🔶 Hold Days (20 bars):
The strategy automatically closes the position after 20 bars if none of the take-profit levels are hit. This feature prevents trades from being held indefinitely, especially if market conditions are stagnant. Adjusting this:
- Shorter hold periods: Reduce the duration of exposure, minimizing risks from market changes but potentially closing trades too early.
- Longer hold periods: Allow trades to stay open longer, increasing the chance for mean reversion but also increasing exposure to unfavorable market conditions.
By understanding how these default settings affect the strategy’s performance, traders can optimize the Bitcoin CME-Spot Bollinger Bands Strategy to their preferences, adapting it to different market environments and risk tolerances.

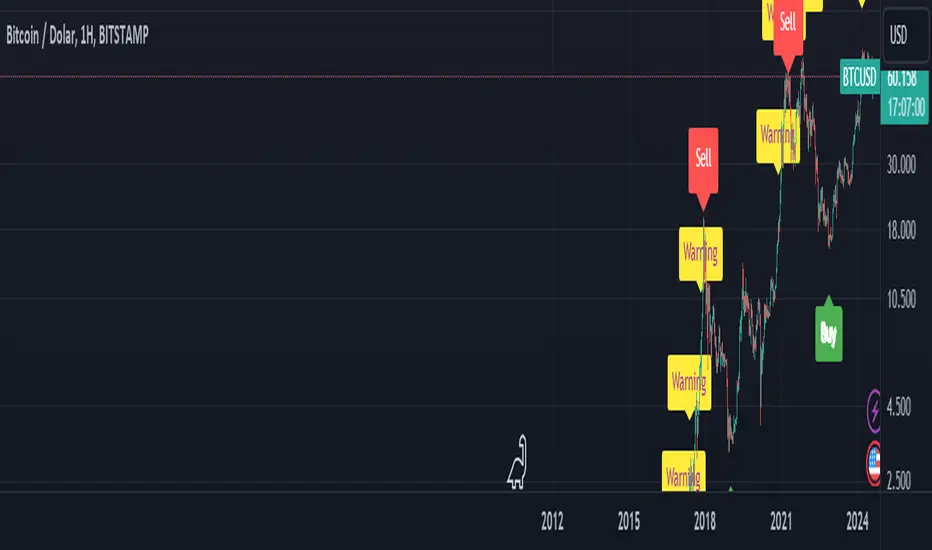
BTC Arcturus IndicatorBTC Arcturus Indicator: This indicator is designed to create buy and sell signals based on the market value of Bitcoin. It also predicts potential market tops with the Pi Cycle Top indicator.
How Does It Work?
1. MVRVZ (Market Value to Realized Value-Z Score) Calculation:
MC: Bitcoin's market cap (Market Cap) is pulled daily from Glassnode data.
MCR: Realized Market Cap of Bitcoin is taken daily from Coinmetrics data.
MVRVZ: It is calculated by dividing the difference between Bitcoin's market value and realized market value by one standard deviation. This value indicates whether the market is overvalued or undervalued.
2. Reception and Warning Signals:
Buy Signal: When MVRVZ falls below the -0.255 threshold value, the indicator gives a "Buy" signal. This indicates that Bitcoin is undervalued and may be a buying opportunity.
Warning Signal: A warning signal turns on when MVRVZ exceeds the threshold value of 2.765. This indicates that the market is approaching saturation and caution is warranted.
3. Tracking the Highest MVRVZ Value:
The indicator records the highest MVRVZ value in the last 10 candlesticks. This value is used to determine whether the market has reached its highest risk levels.
4. Warning Display:
If the MVRVZ value matches the highest value in the last 10 bars and this warning has not been displayed before, a "Warning" signal is displayed.
Once the warning signal is shown, no further warnings are shown for 10 candles.
5. Pi Cycle Top Indicator:
Pi Cycle Top: This indicator predicts Bitcoin tops by comparing two moving averages (350-day and 111-day). If the short-term moving average falls below the long-term moving average, this is considered a sell signal.
The indicator displays this signal with the label "Sell", indicating a potential market top.
User Guide:
Green Buy Signal: It means Bitcoin is cheap and offers a buying opportunity.
Yellow Warning Signal: Indicates that Bitcoin has reached possible profit taking points and caution should be exercised.
Red Sell Signal: Indicates that Bitcoin has reached market saturation and it may be appropriate to sell.
Atlantean Bitcoin Weekly Market Condition - Top/Bottom BTC Overview:
The "Atlantean Bitcoin Weekly Market Condition Detector - Top/Bottom BTC" is a specialized TradingView indicator designed to identify significant turning points in the Bitcoin market on a weekly basis. By analyzing long-term and short-term moving averages across two distinct resolutions, this indicator provides traders with valuable insights into potential market bottoms and tops, as well as the initiation of bull markets.
Key Features:
Market Bottom Detection: The script uses a combination of a simple moving average (SMA) and an exponential moving average (EMA) calculated over long and short periods to identify potential market bottoms. When these conditions are met, the script signals a "Market Bottom" label on the chart, indicating a possible buying opportunity.
Bull Market Start Indicator: When the short-term EMA crosses above the long-term SMA, it signals the beginning of a bull market. This is marked by a "Bull Market Start" label on the chart, helping traders to prepare for potential market upswings.
Market Top Detection: The script identifies potential market tops by analyzing the crossunder of long and short-term moving averages. A "Market Top" label is plotted, suggesting a potential selling point.
Customizable Moving Averages Display: Users can choose to display the moving averages used for detecting market tops and bottoms, providing additional insights into market conditions.
How It Works: The indicator operates by monitoring the interactions between the specified moving averages:
Market Bottom: Detected when the long-term SMA (adjusted by a factor of 0.745) crosses over the short-term EMA.
Bull Market Start: Detected when the short-term EMA crosses above the long-term SMA.
Market Top: Detected when the long-term SMA (adjusted by a factor of 2) crosses under the short-term SMA.
These conditions are highlighted on the chart, allowing traders to visualize significant market events and make informed decisions.
Intended Use: This indicator is best used on weekly Bitcoin charts. It’s designed to provide long-term market insights rather than short-term trading signals. Traders can use this tool to identify strategic entry and exit points during major market cycles. The optional display of moving averages can further enhance understanding of market dynamics.
Originality and Utility: Unlike many other indicators, this script not only highlights traditional market tops and bottoms but also identifies the aggressive start of bull markets, offering a comprehensive view of market conditions. The unique combination of adjusted moving averages makes this script a valuable tool for long-term Bitcoin traders.
Disclaimer: The signals provided by this indicator are based on historical data and mathematical calculations. They do not guarantee future market performance. Traders should use this tool as part of a broader trading strategy and consider other factors before making trading decisions. Not financial advice.
Happy Trading!
By Atlantean

LONG/SHORT PIFRO que esse indicador faz?
Esse indicador tem o objetivo de plotar o valor de Premium Index e Funding Rate de qualquer token que seja negociado nos futuros da Binance. Basta acessar o token, por exemplo "BTCUSDT" ou "BTCUSDT.P" e o indicador funcionará de forma automática.
A ideia de leitura desse indicador é verificar as maiores oscilações e aliar a analise técnica para tomar uma decisão de compra ou venda.
What does this indicator do?
This indicator aims to plot the Premium Index and Funding Rate value of any token that is traded on Binance futures. Just access the token, for example "BTCUSDT" or "BTCUSDT.P" and the indicator will work automatically.
The idea of reading this indicator is to check the biggest fluctuations and combine technical analysis to make a buy or sell decision.
=============
O que é o Índice Bitcoin Premium?
O índice Bitcoin Premium rastreia o prêmio ou desconto dos contratos perpétuos de Bitcoin em relação ao preço do índice à vista por minuto. O Índice de prêmio é baseado na diferença de preço entre o último preço negociado de um contrato perpétuo e o preço do índice à vista. O preço do índice à vista é um índice à vista ponderado pelo volume, o que significa um preço médio obtido em várias bolsas.
Basicamente, ele mostra para cada criptomoeda se o mercado à vista está negociando acima ou abaixo do contrato perpétuo. O valor pode ser superior, inferior ou igual a 0. Quando o valor está acima de 0, o contrato perpétuo está sendo negociado acima do “preço de referência”, quando o valor está abaixo de 0, o índice à vista está negociando acima do contrato perpétuo .
Como ler o índice premium do Bitcoin?
Existem várias maneiras de visualizar o Índice Bitcoin Premium. Você pode observar o valor (acima ou abaixo de 0) semelhante às taxas de financiamento ou pode observar certos extremos. Esta informação pode ser muito útil na sua estratégia de negociação. O gráfico é exibido como um gráfico de velas com um corpo e o pavio (também conhecido como sombra) da vela. O pavio pode mostrar um certo extremo, enquanto o fechamento da vela mostra o valor.
O valor acima ou abaixo de 0 mostra se o preço dos contratos perpétuos de Bitcoin está sendo negociado acima ou abaixo do índice à vista. Quando o índice à vista está sendo negociado em alta, o prêmio cai abaixo de 0 e fica negativo, geralmente, isso é conhecido como um sinal de alta. Quando o valor está sendo negociado acima de 0 e fica positivo, significa que o contrato perpétuo do Bitcoin está sendo negociado acima do índice à vista, geralmente isso é visto como um sinal de baixa.
Os mercados são um reflexo das emoções humanas e muitas vezes, antes que o preço possa mudar, vemos um certo extremo nas emoções. Esse extremo pode ser identificado no Índice Premium. Quando temos um sinal extremo no Índice Bitcoin Premium as chances de uma reversão aumentam. Esta pode ser uma reversão de curto prazo ou uma reversão maior.
Resumindo, um prêmio de índice à vista é geralmente de alta e um prêmio de derivativos é geralmente um sinal de baixa.
Mas, tal como acontece com as taxas de financiamento, por vezes demora um pouco para que essa pressão de compra ou venda seja expressa no preço e, portanto, é sempre importante combinar esta métrica com outras métricas, como a estrutura de preços.
Por exemplo, aqui na imagem abaixo podemos ver uma leitura extrema no índice premium do Bitcoin. Embora várias horas após o evento ainda vejamos a subida do preço, vemos que está bastante perto de uma reversão e, eventualmente, o preço muda.
Descrição por whaleportal
What is the Bitcoin Premium Index?
The Bitcoin Premium index tracks the premium or discount of Bitcoin perpetual contracts relative to the spot index price per minute. The premium Index is based on the difference in price between the last traded price of a perpetual contract and the spot index price. The spot index price is a volume- weighted spot index, which means an average price taken from multiple exchanges.
Basically, it shows you for each cryptocurrency whether the spot market is trading higher or lower than the perpetual contract. The value can either be above, below, or equal to 0. When the value is above 0, the perpetual contract is trading higher than the “mark price”, when the value is below 0 the spot index is trading higher than the perpetual contract.
How to read the Bitcoin premium index?
There are multiple ways to view the Bitcoin Premium Index. You can either look at the value (above or below 0) similar to the funding rates or you can look at certain extremes. This information can be very helpful in your trading strategy. The chart is displayed as a candlestick chart with a body and the wick (also known as shadow) of the candle. The wick can show a certain extreme, while the close of the candle shows the value.
The value, either above or below 0 shows whether the price of Bitcoin perpetual contracts is trading higher or lower than the spot index. When the spot index is trading higher, the premium will go below 0 and turns negative, usually, this is known to be a bullish sign. When the value is trading higher than 0 and turns positive, it means the Bitcoin perpetual contract is trading higher than the spot index, usually, this is seen as a bearish signal.
The markets are a reflection of human emotions and often before the price can shift we are seeing a certain extreme in emotions. That extreme can be spotted in the Premium Index. When we have an extreme signal in the Bitcoin Premium Index the chances of a reversal increase. This can be either a short-term reversal or a bigger reversal.
In short, a spot index premium is usually bullish and a derivatives premium is usually a bearish signal.
But as with funding rates, it sometimes takes a moment for that buying or selling pressure to be expressed in the price and therefore it is always important to combine this metric with other metrics like the price structure.
For example, here in the image below we can see an extreme reading in the premium index on Bitcoin. Although in several hours after the event we still see the price climb, we do see that it’s rather close to a reversal and eventually the price turns around.
Description by whaleportal

BAERMThe Bitcoin Auto-correlation Exchange Rate Model: A Novel Two Step Approach
THIS IS NOT FINANCIAL ADVICE. THIS ARTICLE IS FOR EDUCATIONAL AND ENTERTAINMENT PURPOSES ONLY.
If you enjoy this software and information, please consider contributing to my lightning address
Prelude
It has been previously established that the Bitcoin daily USD exchange rate series is extremely auto-correlated
In this article, we will utilise this fact to build a model for Bitcoin/USD exchange rate. But not a model for predicting the exchange rate, but rather a model to understand the fundamental reasons for the Bitcoin to have this exchange rate to begin with.
This is a model of sound money, scarcity and subjective value.
Introduction
Bitcoin, a decentralised peer to peer digital value exchange network, has experienced significant exchange rate fluctuations since its inception in 2009. In this article, we explore a two-step model that reasonably accurately captures both the fundamental drivers of Bitcoin’s value and the cyclical patterns of bull and bear markets. This model, whilst it can produce forecasts, is meant more of a way of understanding past exchange rate changes and understanding the fundamental values driving the ever increasing exchange rate. The forecasts from the model are to be considered inconclusive and speculative only.
Data preparation
To develop the BAERM, we used historical Bitcoin data from Coin Metrics, a leading provider of Bitcoin market data. The dataset includes daily USD exchange rates, block counts, and other relevant information. We pre-processed the data by performing the following steps:
Fixing date formats and setting the dataset’s time index
Generating cumulative sums for blocks and halving periods
Calculating daily rewards and total supply
Computing the log-transformed price
Step 1: Building the Base Model
To build the base model, we analysed data from the first two epochs (time periods between Bitcoin mining reward halvings) and regressed the logarithm of Bitcoin’s exchange rate on the mining reward and epoch. This base model captures the fundamental relationship between Bitcoin’s exchange rate, mining reward, and halving epoch.
where Yt represents the exchange rate at day t, Epochk is the kth epoch (for that t), and epsilont is the error term. The coefficients beta0, beta1, and beta2 are estimated using ordinary least squares regression.
Base Model Regression
We use ordinary least squares regression to estimate the coefficients for the betas in figure 2. In order to reduce the possibility of over-fitting and ensure there is sufficient out of sample for testing accuracy, the base model is only trained on the first two epochs. You will notice in the code we calculate the beta2 variable prior and call it “phaseplus”.
The code below shows the regression for the base model coefficients:
\# Run the regression
mask = df\ < 2 # we only want to use Epoch's 0 and 1 to estimate the coefficients for the base model
reg\_X = df.loc\ [mask, \ \].shift(1).iloc\
reg\_y = df.loc\ .iloc\
reg\_X = sm.add\_constant(reg\_X)
ols = sm.OLS(reg\_y, reg\_X).fit()
coefs = ols.params.values
print(coefs)
The result of this regression gives us the coefficients for the betas of the base model:
\
or in more human readable form: 0.029, 0.996869586, -0.00043. NB that for the auto-correlation/momentum beta, we did NOT round the significant figures at all. Since the momentum is so important in this model, we must use all available significant figures.
Fundamental Insights from the Base Model
Momentum effect: The term 0.997 Y suggests that the exchange rate of Bitcoin on a given day (Yi) is heavily influenced by the exchange rate on the previous day. This indicates a momentum effect, where the price of Bitcoin tends to follow its recent trend.
Momentum effect is a phenomenon observed in various financial markets, including stocks and other commodities. It implies that an asset’s price is more likely to continue moving in its current direction, either upwards or downwards, over the short term.
The momentum effect can be driven by several factors:
Behavioural biases: Investors may exhibit herding behaviour or be subject to cognitive biases such as confirmation bias, which could lead them to buy or sell assets based on recent trends, reinforcing the momentum.
Positive feedback loops: As more investors notice a trend and act on it, the trend may gain even more traction, leading to a self-reinforcing positive feedback loop. This can cause prices to continue moving in the same direction, further amplifying the momentum effect.
Technical analysis: Many traders use technical analysis to make investment decisions, which often involves studying historical exchange rate trends and chart patterns to predict future exchange rate movements. When a large number of traders follow similar strategies, their collective actions can create and reinforce exchange rate momentum.
Impact of halving events: In the Bitcoin network, new bitcoins are created as a reward to miners for validating transactions and adding new blocks to the blockchain. This reward is called the block reward, and it is halved approximately every four years, or every 210,000 blocks. This event is known as a halving.
The primary purpose of halving events is to control the supply of new bitcoins entering the market, ultimately leading to a capped supply of 21 million bitcoins. As the block reward decreases, the rate at which new bitcoins are created slows down, and this can have significant implications for the price of Bitcoin.
The term -0.0004*(50/(2^epochk) — (epochk+1)²) accounts for the impact of the halving events on the Bitcoin exchange rate. The model seems to suggest that the exchange rate of Bitcoin is influenced by a function of the number of halving events that have occurred.
Exponential decay and the decreasing impact of the halvings: The first part of this term, 50/(2^epochk), indicates that the impact of each subsequent halving event decays exponentially, implying that the influence of halving events on the Bitcoin exchange rate diminishes over time. This might be due to the decreasing marginal effect of each halving event on the overall Bitcoin supply as the block reward gets smaller and smaller.
This is antithetical to the wrong and popular stock to flow model, which suggests the opposite. Given the accuracy of the BAERM, this is yet another reason to question the S2F model, from a fundamental perspective.
The second part of the term, (epochk+1)², introduces a non-linear relationship between the halving events and the exchange rate. This non-linear aspect could reflect that the impact of halving events is not constant over time and may be influenced by various factors such as market dynamics, speculation, and changing market conditions.
The combination of these two terms is expressed by the graph of the model line (see figure 3), where it can be seen the step from each halving is decaying, and the step up from each halving event is given by a parabolic curve.
NB - The base model has been trained on the first two halving epochs and then seeded (i.e. the first lag point) with the oldest data available.
Constant term: The constant term 0.03 in the equation represents an inherent baseline level of growth in the Bitcoin exchange rate.
In any linear or linear-like model, the constant term, also known as the intercept or bias, represents the value of the dependent variable (in this case, the log-scaled Bitcoin USD exchange rate) when all the independent variables are set to zero.
The constant term indicates that even without considering the effects of the previous day’s exchange rate or halving events, there is a baseline growth in the exchange rate of Bitcoin. This baseline growth could be due to factors such as the network’s overall growth or increasing adoption, or changes in the market structure (more exchanges, changes to the regulatory environment, improved liquidity, more fiat on-ramps etc).
Base Model Regression Diagnostics
Below is a summary of the model generated by the OLS function
OLS Regression Results
\==============================================================================
Dep. Variable: logprice R-squared: 0.999
Model: OLS Adj. R-squared: 0.999
Method: Least Squares F-statistic: 2.041e+06
Date: Fri, 28 Apr 2023 Prob (F-statistic): 0.00
Time: 11:06:58 Log-Likelihood: 3001.6
No. Observations: 2182 AIC: -5997.
Df Residuals: 2179 BIC: -5980.
Df Model: 2
Covariance Type: nonrobust
\==============================================================================
coef std err t P>|t| \
\------------------------------------------------------------------------------
const 0.0292 0.009 3.081 0.002 0.011 0.048
logprice 0.9969 0.001 1012.724 0.000 0.995 0.999
phaseplus -0.0004 0.000 -2.239 0.025 -0.001 -5.3e-05
\==============================================================================
Omnibus: 674.771 Durbin-Watson: 1.901
Prob(Omnibus): 0.000 Jarque-Bera (JB): 24937.353
Skew: -0.765 Prob(JB): 0.00
Kurtosis: 19.491 Cond. No. 255.
\==============================================================================
Below we see some regression diagnostics along with the regression itself.
Diagnostics: We can see that the residuals are looking a little skewed and there is some heteroskedasticity within the residuals. The coefficient of determination, or r2 is very high, but that is to be expected given the momentum term. A better r2 is manually calculated by the sum square of the difference of the model to the untrained data. This can be achieved by the following code:
\# Calculate the out-of-sample R-squared
oos\_mask = df\ >= 2
oos\_actual = df.loc\
oos\_predicted = df.loc\
residuals\_oos = oos\_actual - oos\_predicted
SSR = np.sum(residuals\_oos \*\* 2)
SST = np.sum((oos\_actual - oos\_actual.mean()) \*\* 2)
R2\_oos = 1 - SSR/SST
print("Out-of-sample R-squared:", R2\_oos)
The result is: 0.84, which indicates a very close fit to the out of sample data for the base model, which goes some way to proving our fundamental assumption around subjective value and sound money to be accurate.
Step 2: Adding the Damping Function
Next, we incorporated a damping function to capture the cyclical nature of bull and bear markets. The optimal parameters for the damping function were determined by regressing on the residuals from the base model. The damping function enhances the model’s ability to identify and predict bull and bear cycles in the Bitcoin market. The addition of the damping function to the base model is expressed as the full model equation.
This brings me to the question — why? Why add the damping function to the base model, which is arguably already performing extremely well out of sample and providing valuable insights into the exchange rate movements of Bitcoin.
Fundamental reasoning behind the addition of a damping function:
Subjective Theory of Value: The cyclical component of the damping function, represented by the cosine function, can be thought of as capturing the periodic fluctuations in market sentiment. These fluctuations may arise from various factors, such as changes in investor risk appetite, macroeconomic conditions, or technological advancements. Mathematically, the cyclical component represents the frequency of these fluctuations, while the phase shift (α and β) allows for adjustments in the alignment of these cycles with historical data. This flexibility enables the damping function to account for the heterogeneity in market participants’ preferences and expectations, which is a key aspect of the subjective theory of value.
Time Preference and Market Cycles: The exponential decay component of the damping function, represented by the term e^(-0.0004t), can be linked to the concept of time preference and its impact on market dynamics. In financial markets, the discounting of future cash flows is a common practice, reflecting the time value of money and the inherent uncertainty of future events. The exponential decay in the damping function serves a similar purpose, diminishing the influence of past market cycles as time progresses. This decay term introduces a time-dependent weight to the cyclical component, capturing the dynamic nature of the Bitcoin market and the changing relevance of past events.
Interactions between Cyclical and Exponential Decay Components: The interplay between the cyclical and exponential decay components in the damping function captures the complex dynamics of the Bitcoin market. The damping function effectively models the attenuation of past cycles while also accounting for their periodic nature. This allows the model to adapt to changing market conditions and to provide accurate predictions even in the face of significant volatility or structural shifts.
Now we have the fundamental reasoning for the addition of the function, we can explore the actual implementation and look to other analogies for guidance —
Financial and physical analogies to the damping function:
Mathematical Aspects: The exponential decay component, e^(-0.0004t), attenuates the amplitude of the cyclical component over time. This attenuation factor is crucial in modelling the diminishing influence of past market cycles. The cyclical component, represented by the cosine function, accounts for the periodic nature of market cycles, with α determining the frequency of these cycles and β representing the phase shift. The constant term (+3) ensures that the function remains positive, which is important for practical applications, as the damping function is added to the rest of the model to obtain the final predictions.
Analogies to Existing Damping Functions: The damping function in the BAERM is similar to damped harmonic oscillators found in physics. In a damped harmonic oscillator, an object in motion experiences a restoring force proportional to its displacement from equilibrium and a damping force proportional to its velocity. The equation of motion for a damped harmonic oscillator is:
x’’(t) + 2γx’(t) + ω₀²x(t) = 0
where x(t) is the displacement, ω₀ is the natural frequency, and γ is the damping coefficient. The damping function in the BAERM shares similarities with the solution to this equation, which is typically a product of an exponential decay term and a sinusoidal term. The exponential decay term in the BAERM captures the attenuation of past market cycles, while the cosine term represents the periodic nature of these cycles.
Comparisons with Financial Models: In finance, damped oscillatory models have been applied to model interest rates, stock prices, and exchange rates. The famous Black-Scholes option pricing model, for instance, assumes that stock prices follow a geometric Brownian motion, which can exhibit oscillatory behavior under certain conditions. In fixed income markets, the Cox-Ingersoll-Ross (CIR) model for interest rates also incorporates mean reversion and stochastic volatility, leading to damped oscillatory dynamics.
By drawing on these analogies, we can better understand the technical aspects of the damping function in the BAERM and appreciate its effectiveness in modelling the complex dynamics of the Bitcoin market. The damping function captures both the periodic nature of market cycles and the attenuation of past events’ influence.
Conclusion
In this article, we explored the Bitcoin Auto-correlation Exchange Rate Model (BAERM), a novel 2-step linear regression model for understanding the Bitcoin USD exchange rate. We discussed the model’s components, their interpretations, and the fundamental insights they provide about Bitcoin exchange rate dynamics.
The BAERM’s ability to capture the fundamental properties of Bitcoin is particularly interesting. The framework underlying the model emphasises the importance of individuals’ subjective valuations and preferences in determining prices. The momentum term, which accounts for auto-correlation, is a testament to this idea, as it shows that historical price trends influence market participants’ expectations and valuations. This observation is consistent with the notion that the price of Bitcoin is determined by individuals’ preferences based on past information.
Furthermore, the BAERM incorporates the impact of Bitcoin’s supply dynamics on its price through the halving epoch terms. By acknowledging the significance of supply-side factors, the model reflects the principles of sound money. A limited supply of money, such as that of Bitcoin, maintains its value and purchasing power over time. The halving events, which reduce the block reward, play a crucial role in making Bitcoin increasingly scarce, thus reinforcing its attractiveness as a store of value and a medium of exchange.
The constant term in the model serves as the baseline for the model’s predictions and can be interpreted as an inherent value attributed to Bitcoin. This value emphasizes the significance of the underlying technology, network effects, and Bitcoin’s role as a medium of exchange, store of value, and unit of account. These aspects are all essential for a sound form of money, and the model’s ability to account for them further showcases its strength in capturing the fundamental properties of Bitcoin.
The BAERM offers a potential robust and well-founded methodology for understanding the Bitcoin USD exchange rate, taking into account the key factors that drive it from both supply and demand perspectives.
In conclusion, the Bitcoin Auto-correlation Exchange Rate Model provides a comprehensive fundamentally grounded and hopefully useful framework for understanding the Bitcoin USD exchange rate.
