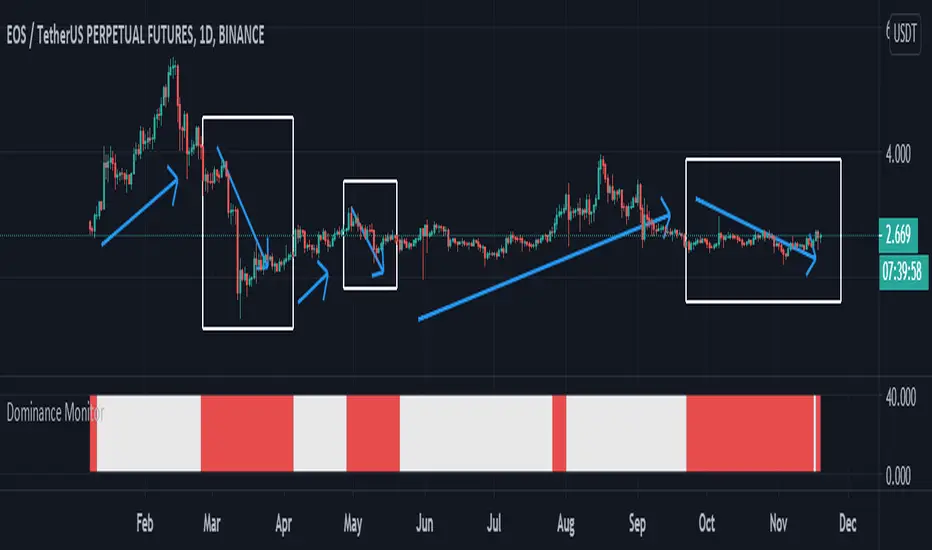
Dominance Monitoralways a trader must check the bitcoins Dominance and if its ok can make a deal on AltCoins
this indicator Monitor the BTC.D and check the trend with ATR and give you results
please just check it in 1D timeframe
when the color was white you can easily trade and if the color was red you should be aware the risk and rest or maybe close the deals
BINANCE:EOSUSDT
be our guest
Bitcoindominance
RSI Season Tracker by KrisWatersSeason tracker identifies the momentum with tracking dominance and market capitalization data of Bitcoin , Altcoin and USDT .
With this indicator you can able to get know about Bitcoin, Altcoin and USDT dominance and market capitalization easily.
Backgrond Color Definations:
If the background color of indicator is ORANGE means that Bitcoin dominance is the most powerful. It is a good sign for Bitcoin.
If the background color of indicator is BLUE means that Altcoin dominance is the most powerful. It is a good sign for Altcoins.
If the background color of indicator is GREEN means that USDT dominance is the most powerful. It is a good sign for USDT.
Plus Sign (+) Meaning and Color Definations:
If ORANGE plus sign is visible on indicator means that market capitalization of Bitcoin is increasing. It is a good sign for Bitcoin.
If BLUE plus sign is visible on indicator means that market capitalization of Altcoin is increasing. It is a good sign for Altcoins.
If GREEN plus sign is visible on indicator means that market capitalization of Bitcoin and Altcoins are decreasing. It is not a good sign for both.
Light and Dark RSI Line Color Definations:
If the line of Bitcoin color is Orange means that, RSI value was increased compared with previous bar. It is one of the good sign of the momentum strength.
If the line of Bitcoin color is Yellow means that, RSI value was decreased compared with previous bar. It is not a good sign.
If the line of Altcoin color is Navy means that, RSI value was increased compared with previous bar. It is one of the good sign of the momentum strength.
If the line of Altcoin color is Blue means that, RSI value was decreased compared with previous bar. It is not a good sign.
If the line of USDT color is Green means that, RSI value was increased compared with previous bar. It is one of good the sign of the momentum strength.
If the line of USDT color is Lime means that, RSI value was decreased compared with previous bar. It is not a good sign.
Simple RSI rules are valid for this indicator.
RSI value is under 30 indicates that asset is OVERSOLD .
RSI value is upper 70 indicates that asset is OVERBOUGHT .
Important Notice: Dominance data is not correlated with price. For example; sometimes dominance is increasing but the price is not. And that's where the market capitalization comes in.
If the plus sign is not visible , you can get questioning for the movement. It is not a good sign at all.
If the plus sign is visible and RSI is increasing , It is a good sign for the strength of assets movement.
I recommended to use on DAILY timeframe . But you can use different timeframes as well.
Please leave comment below If you have any question or development idea.
