Indicadores de Bill Williams
Momentum Trend Fusion (MTF)The Momentum Trend Fusion (MTF) is a composite indicator that combines the Awesome Oscillator and the Relative Strength Index to provide a unique perspective on market momentum and trend strength. The MTF is calculated by first running the Relative Strength Index (RSI) on the Awesome Oscillator (AO) and then applying an Exponential Moving Average (EMA) on the RSI value. The MTF is designed to help traders detect market phases and confirm trend direction by analyzing the cross of the EMA and RSI, as well as divergences between the AO and price. The MTF can be customized by the user by providing the lengths of the RSI and EMA calculations, making it an ideal tool for traders with different time frames and risk tolerances.

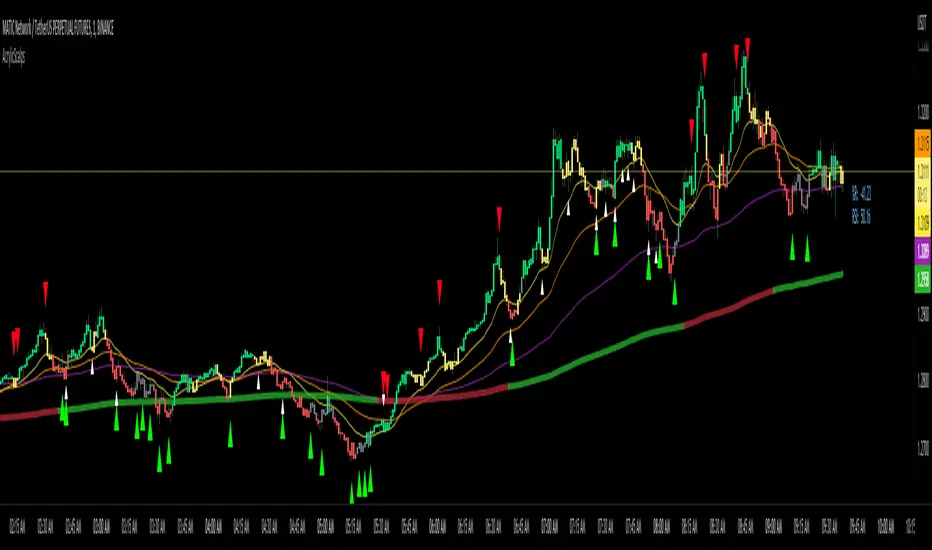
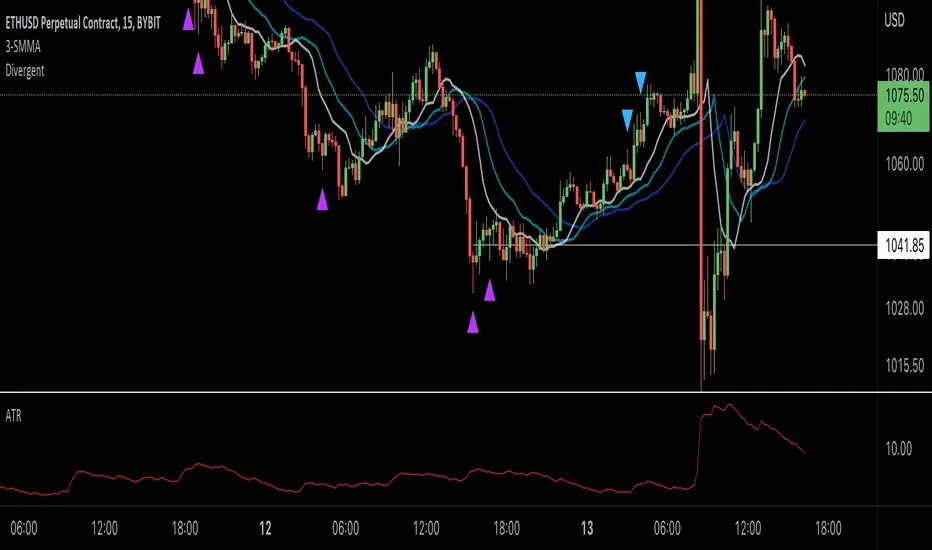
Acrylic's 1m/3m Scalper Buy/Sell SignalsAcrylic's Scalper Signals uses a combination of RSI / Stochastic / Williams %R to calculate the perfect entry signals. The script(with it's default settings) has been optimized and thoroughly tested on BTC & ETH 1 and 3 minute time frames. It's intended for quick in and out trades that should only last a few minutes unless a strong trend is caught. Basic knowledge of market structure is needed, as you will not be taking every signal generated by the script.
You also have the option to display all signals regardless of the short term trend that has been confirmed by RSI. This can be good if you're looking for reversal entries at resistance/support levels.
-Large triangle signal: Strongest signal that was confirmed with RSI & Williams %R optimized calculations. (prints at current candle close)
-Small triangle signal: Fractal signal can be used as a late entry signal/continuation. (prints after 2 candle closes)
-Candle colors are matched to stochastic strength for added confluence to enter trades. (Must hide default trading view candles to see these)
-233SMMA color is matched to the extreme short term trend based off of RSI calculations.
Perfect Long Entry Setup Image :
1) EMA21 > EMA55 > EMA100 > SMMA233(Colored green for added confluence) - All pointing up indicating strong trend
2) Enter on pullback to short term EMA after signal candle closes. (Do not take entry if candles closed below 100EMA)
Perfect Short Entry Setup Image :
1) EMA21 < EMA55 < EMA100 < SMMA233(Colored red for added confluence) - All pointing down indicating strong trend
2) Enter on pullback to short term EMA after signal candle closes. (Do not take entry if candles closed above 100EMA)
Feel free to ask questions or leave feedback in the comments, I'm always looking to improve! Thanks!
3 indicators in another time frame "3 indicators in another time frame"
1- In the indicator settings section, you can save and change another time period
2-For time frame changes, it should be calculated in minutes
3-Includes three performance indicators ( ichimoku , bollinger bans, pivot ) that are set to a 15-minute timeframe by default.

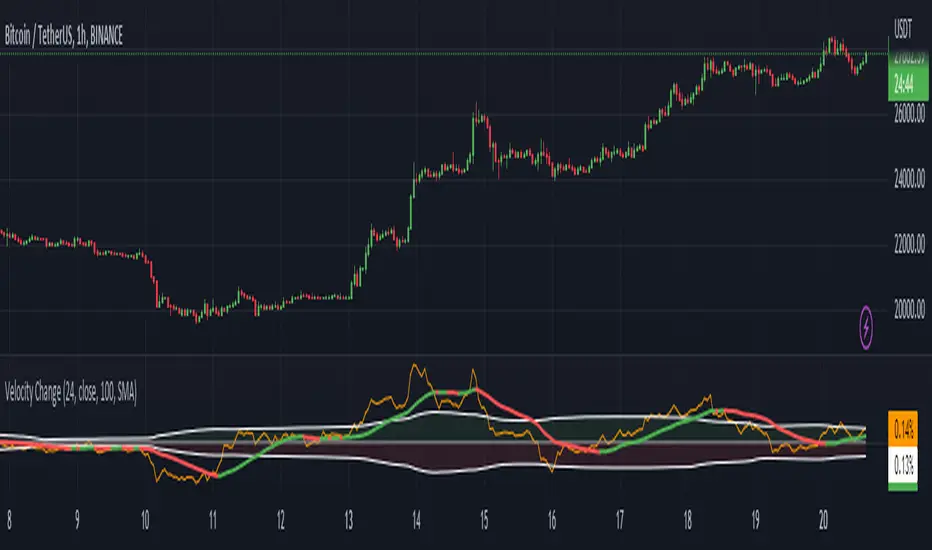
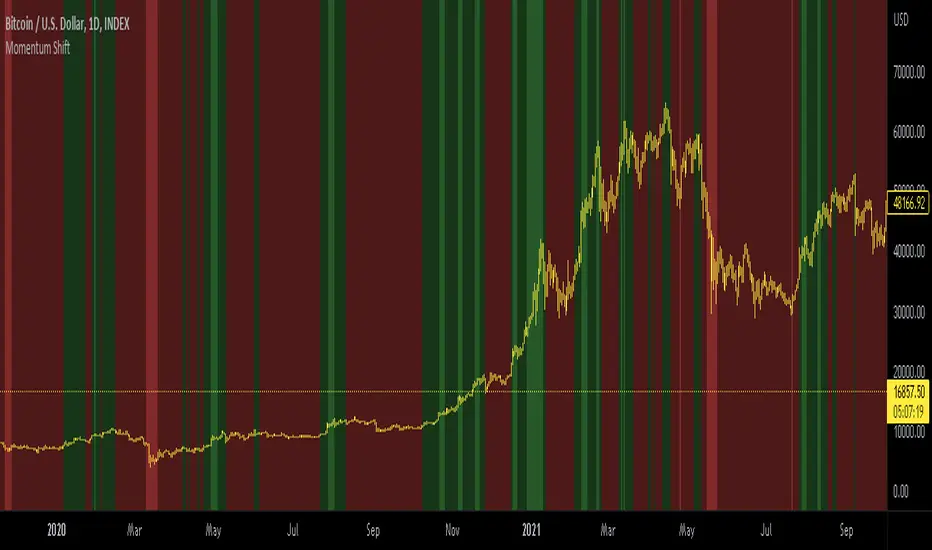
Momentum shift CCI, MACD, RSI, AligatorIndicator for BTC only.
This indicator combines CCI MACD RSI AND William's alligator.
Bullish macd cross, RSI over 50, bullish William cross and positive CCI result in green background. Otherwise red background is displayed.
For better visibility extreme values can be displayed with greater color saturation. 1D BTCUSD is best with default values.
For other TFs Bull side and bear side values can be tweaked.
For bright red we may assume price to be `greatly oversold.
For bright green we may seek some profit taking.

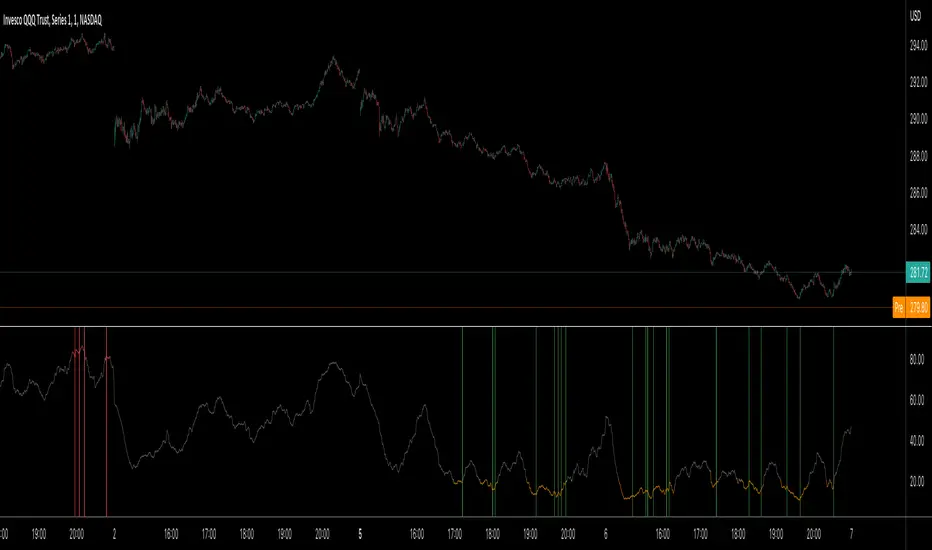
BugiCoThis indicator is designed for shorter time frames - specifically 15 minutes to 1 minute.
It is scalping tool that users William Bollinger setup on various time frames.
This indicator will give you an edge and a way of thinking that you NEVER THOUGHT before because it has a story.
This indicator isolates between 0 and 100. Below around 20 is a buy, above 80 is a sell.
In these locations, try to formulate a scalping strategy with stop loss and risk management. If you don't do that, you will go broke quick in any indicator setup anyways. Be smart...
Story Of This Indicator
~ Took me a while to understand Bollinger Bands and i knew a ton about Fibonacci indicators. So decided to combine fibonacci and bollinger together across different time frames, which is the key. Use as small of a time frame as possible and use it all across the board. The game is designed to rob you either way BUT at least you will have a chance to see what your masters are already taking a look at. There are more complicated tools than this but understand this simple thing "Only way to win in this market to is to do the opposite of the crowd and steal as much money as possible". Create tools that can show you this to "WIN"...
I have a ton of other tools that can change everything for your trading/investing. Reach out to me if you have any questions.
Best wishes
~Megalodon
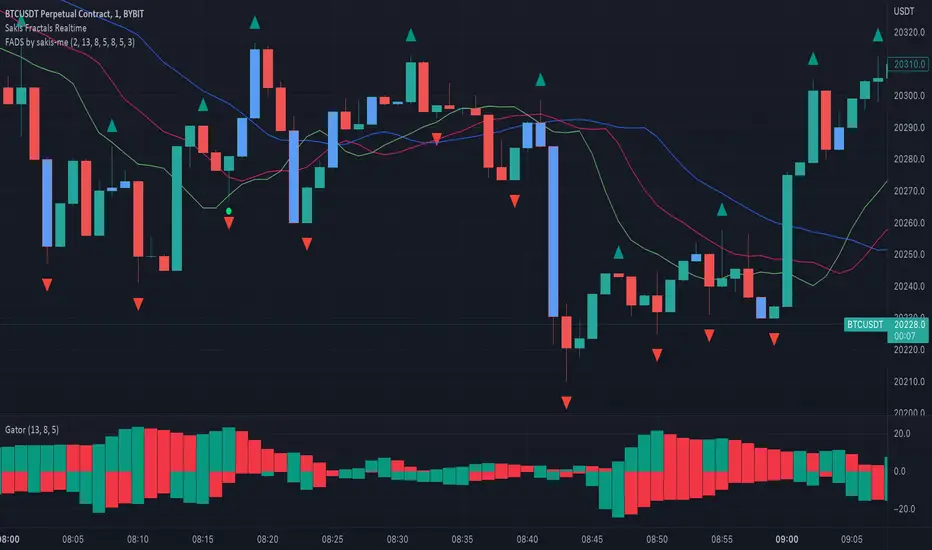
Profitunity - Beginner [TC]This indicator aggregates the knowledges of the first level of the Trading Chaos approach by Bill Williams. It uses the Market Facilitation Index (MFI) in conjunction with the type of bar(candle) to generate strong long and strong short signals.
General information
Bars numeration
All bars or candles could be numbered with the following algorithm. If we divide the candle for 3 equal parts from high to low. The highest third have the number 1, the middle one - 2, the lowest one - 3. Hence we can define the first number as the number of the third where the price opened, second - where the price closed. For example, if the price opened at the highest third and closed at the lowest one this candle has the number 13.
Trend defining
Also candles could be divided into three groups according to the trend condition: uptrend, downtrend, sideways. If the middle of the candle's trading range is above the high of the previous candle - it's uptrend candle, if below the low of the previous candle - it's downtrend candle, sideways in other candles.
Profitunity windows
According to Bill Williams MFI has 4 windows - fake, green, fade and squat. I am not going to describe here the methodology of MFI, but one thing you should know that the most valuable windows are green and squat. Green state is an indication of the true move on the market. Squat the sign that the increase in volume have not triggered the trend continuation and reverse is about to happen.
How to use?
You can use this script as the helper in automatic defining the type of candle. Indicator shows only green (green candle color) and squat (red candle color) MFI states. Add script to any timeframe and asset chart to see labels.
The "strong long" label flashes when 3 conditions are met:
1. Squat candle
2. Candle number 13
3. Downtrend candle
"Strong short" label flashes when:
1. Squat candle
2. Candle number 31
3. Uptrend candle
This indicator helps to find the trend reversal points, can be used in conjunction with other TA tools to find the entry points.

Trend & atr day & calcHi!
Why for what and how in this script?
At the time of publication the script consists of three modules, it may increase in the future.
1. Bottom left corner : daytime ATR module
(idea and basis of the author's script - ???)
- The size of the daily ATR based on 14 bars;
- intraday ATR progress;
- colour indication of the progress status, for easier visual perception (green < 70%, yellow 70-90 and red over 90% of ATR)
By evaluating the progress of the daily ATR, it is possible to suggest and expedient to enter/exit/hold a trade.
2. Top right: trend module
The trend is calculated based on Bill Williams' alligator indicator
- trend status on specified timeframes for the current ticker;
- colour indication for visual perception (green - growing trend, yellow - alligator is sleeping, red - downtrend)
Do not forget that the alligator is based on moving averages with the resulting consequences.
Its purpose is to assess the state of the trend on other ticker TFs, without additional actions (switching to another screen or TF)
3. In the bottom left corner - risk and position calculator
(based on an idea of the risk calculator by @andrei.bunulu)
It helps to determine the advisability of entering the trade and also what size position to enter into the trade, within money management strategy chosen.
- The calculator works in two directions: long deal and short deal (short deal calculation is enabled by check-box in settings)
- two calculation methods:
a. based on the set stop loss % (default is 0.3%), in this mode the stop and takeout level is automatically calculated (default is 1 / 3).
b. by entering the desired price levels (entry, stop and take profit points)
To make this work correctly please do not forget to choose the type of calculation (% or price) in the settings, and the currency symbol (for visual representation in the results).
The calculator can take into account the set commissions and spreads.
When hovering over the module - tooltips are displayed.
Each module can be enabled / disabled in the settings.
The size and arrangement of the modules is made for joint use with the script - "Abnormal Bar".
/// а по-русски это так ///
Привет!
Зачем для чего и как в этом скрипте?
На момент публикации скрипт состоит из трех модулей, возможно в будущем увеличится.
1. В левом нижнем углу : модуль дневного ATR
(идея и основа скрипт автора - ???)
- размер дневной ATR на основании 14 баров;
- прогресс ATR внутри дня;
- цветовая индикация состояния прогресса, для более простого визуального восприятия (зеленый < 70%, желтый 70-90 и красный более 90% ATR)
Оценивая прогресс дневного ATR, можно предположить и целесообразности входа / выхода / удержания из сделки.
2. В правом верхнем углу: модуль тренда
Тренд рассчитывается на основе индикатора - аллигатор Билла Вильямса
- состояние тренда на указанных таймфреймах для текущего тикера;
- цветовая индикация для визуального восприятия (зеленый - растущий тренд, желтый - аллигатор спит, красный - нисходящий тренд)
Не забываем, что аллигатор построен на основе скользящих средних с вытекающими последствиями.
Назначение - оценить состояние тренда на других ТФ тикера, без дополнительных действий (переключения на другой экран или ТФ)
3. В нижнем левом углу - калькулятор рисков и позиции
(на основе идеи калькулятора аuthor: @andrei.bunulu)
Помогает определить целесообразность входа в сделку, а также каким размером позиции входить в сделку, в рамках выбранной стратегии мани менеджмента.
- калькулятор работает в два направления: длинная и короткая сделка (расчет по короткой включается в настройках чек-боксом)
- два варианта расчета:
а. на основании установленного % стоп лосса (по-умолчанию 0,3%), при этом режиме происходит автоматический расчет уровня стопа и тейка (по умолчанию 1 / 3).
b. путем ввода данных желаемых уровней цены (точки входа, стопа и тейк профита)
Для корректной работы не забываем в настройках выбирать тип расчета (% или цена), а также символ валюты (для визуального отображения в итогах).
Калькулятор может учитывать установленный размер комиссий и спреда.
При наведении на модуль - отображаются подсказки.
Каждый модуль можно включить / выключить в настройках.
Размер и расположение модулей сделано для совместного использования со скриптом - "Abnormal Bar"

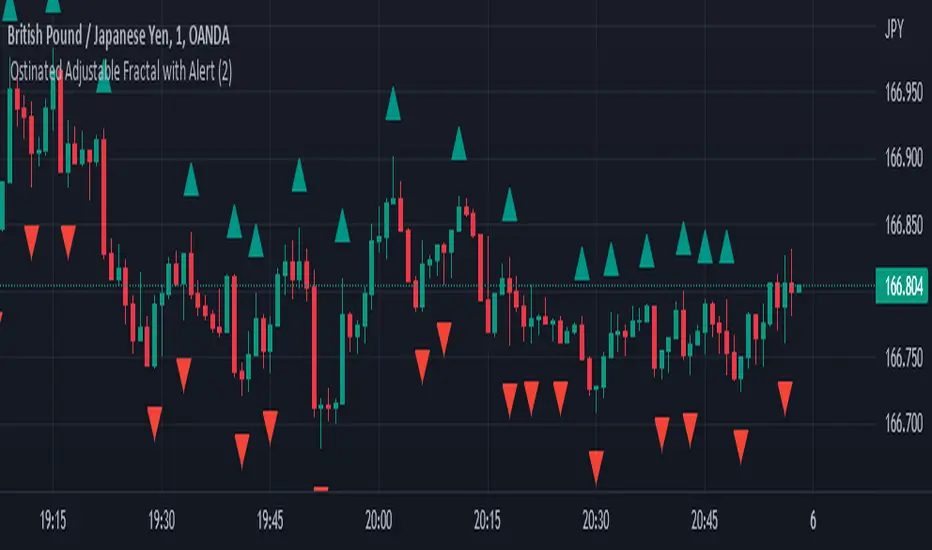
Ostinated Adjustable Fractal with AlertThis indicator (Ostinated Adjustable Fractal with Alert) is like the traditional William Fractals. However, it created to overcome two disadvantages of the William Fractals:
1. Set minimum value to 1. This a big advantage over traditional William Fractal that has a minimum value of 2.
2. Alerts: setting alert with the traditional William Fractal is very difficult. We have created this indicator to simplify setting fractal alerts.
Like and comment.
Enjoy!
SUPER Alligator[Gabbo]📈 Alligator Indicator Update - Version 2
🔹 New Features and Improvements:
1️⃣ New MA Selection for Indicator Calculations:
You can now choose from various Moving Average types for the indicator calculations, adding more flexibility to your analysis.
2️⃣ Improved Input Visibility and Organization:
Inputs have been reorganized so that the most commonly used options are placed at the beginning for quicker and more convenient configuration.
3️⃣ Bug Fixes and Code Improvements:
Minor bugs have been resolved, and the code has been optimized for better stability and performance. The code is now cleaner and fully functional in version 6.
4️⃣ Cometreon Public Library Integration:
To lighten the code and improve modularity, we’ve integrated the Cometreon public library. This makes the code more efficient and reduces the need to duplicate common functions.
☄️ With this update, the Alligator indicator becomes even more versatile and user-friendly, offering enhanced customization options and improved overall performance!

Quick and Simple - WPR+RSI+CCITake a look.
Couple of confluencial reversal signals from popular indicators (W%R, RSI & CCI). I can only say this shows how random the "stanard tools" are and how the market makers "play" these kind of tools to their advantage.
That said. It's better tha average, but not top-class, so expect to have to take signals with other confluence. DON'T take the plots or signals as buy / sell signals, they are just confluencial movements from these indicators based on how they should be "traditionally" used. Instead, use it as a guide as to what other traders may be thinking, or as a pull-back identifier.
Included 100 period ema as basic trend filter.
Not my normal type of script + been away for some time so be kind, lol :)
You might find it useful however so sharing.
More stuff to follow :)

Shaikh Saab Ki MagarmachJab Magarmach bhuki ho jati hai to wo sabko kha jati hai chahe wo bulls ho ya bears.

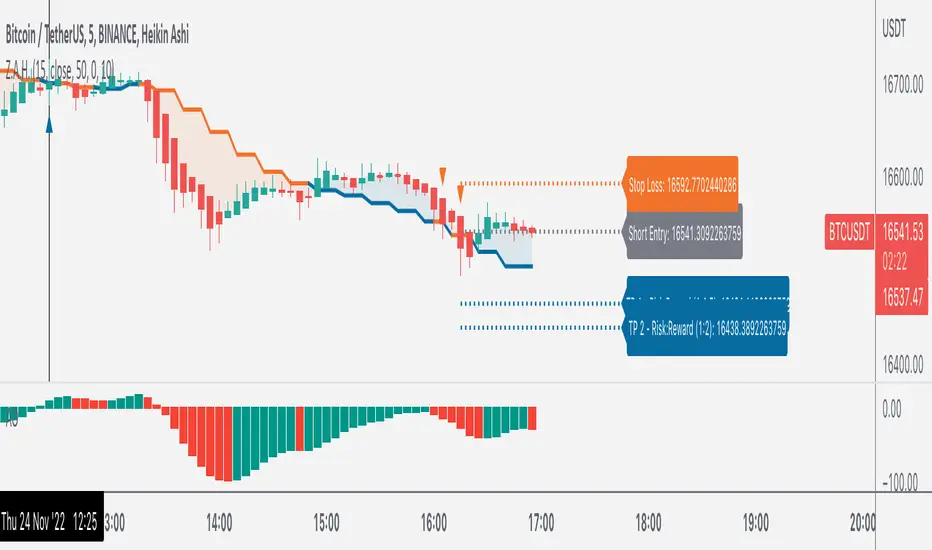
Z.A.H.It's a scalping script, which can be used using Heikin Ashi candle on 5min time frame (I personally use it for BINANCE:BTCUSDT and BINANCE:ETHUSDT scalping).
We've tried to include SL and target (1.5R and 2R) in this as well, and it works well but sometimes (please note SOMETIMES..SOMETIMES, it can be few..few pips here and there)
Idea is simple, you take the trade based on the signal given by the script and place your SL as per the script and then target 1.5R for 80% of your position and 20% for the remaining 20% of your position.
One extra thing which I've found useful is, you can use Awesome Oscillator (default setting) as well for placing SLs. If you use this method for placing SL, then just place your SL at the last green awesome oscillator candle for shorts and at the last red awesome oscillator candle for longs. From there target 1.5R and 2R.
Overall results are same for either, so you can use it as per your convenience. For any query, you can send me a DM on discord or twitter.
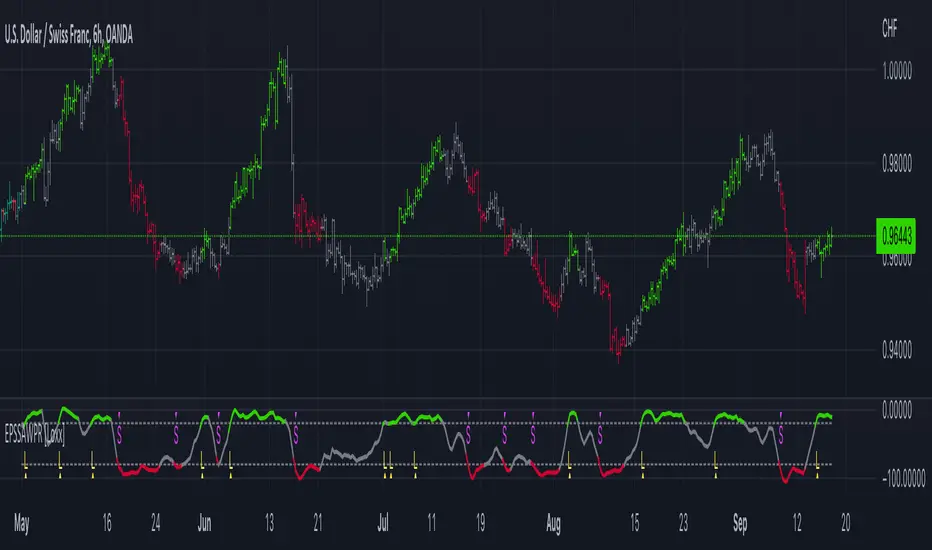
End-pointed SSA of Williams %R [Loxx]End-pointed SSA of Williams %R is an indicator that runes Williams %R SSA calculation through a Singular Spectrum Analysis (SSA) algorithm to derive a smoother final output. The reduction in noise from the traditional Williams %R is significant.
What is Williams %R?
Williams %R , also known as the Williams Percent Range, is a type of momentum indicator that moves between 0 and -100 and measures overbought and oversold levels. The Williams %R may be used to find entry and exit points in the market. The indicator is very similar to the Stochastic oscillator and is used in the same way. It was developed by Larry Williams and it compares a stock’s closing price to the high-low range over a specific period, typically 14 days or periods.
What is Singular Spectrum Analysis ( SSA )?
Singular spectrum analysis ( SSA ) is a technique of time series analysis and forecasting. It combines elements of classical time series analysis, multivariate statistics, multivariate geometry, dynamical systems and signal processing. SSA aims at decomposing the original series into a sum of a small number of interpretable components such as a slowly varying trend, oscillatory components and a ‘structureless’ noise. It is based on the singular value decomposition ( SVD ) of a specific matrix constructed upon the time series. Neither a parametric model nor stationarity-type conditions have to be assumed for the time series. This makes SSA a model-free method and hence enables SSA to have a very wide range of applicability.
For our purposes here, we are only concerned with the "Caterpillar" SSA . This methodology was developed in the former Soviet Union independently (the ‘iron curtain effect’) of the mainstream SSA . The main difference between the main-stream SSA and the "Caterpillar" SSA is not in the algorithmic details but rather in the assumptions and in the emphasis in the study of SSA properties. To apply the mainstream SSA , one often needs to assume some kind of stationarity of the time series and think in terms of the "signal plus noise" model (where the noise is often assumed to be ‘red’). In the "Caterpillar" SSA , the main methodological stress is on separability (of one component of the series from another one) and neither the assumption of stationarity nor the model in the form "signal plus noise" are required.
"Caterpillar" SSA
The basic "Caterpillar" SSA algorithm for analyzing one-dimensional time series consists of:
Transformation of the one-dimensional time series to the trajectory matrix by means of a delay procedure (this gives the name to the whole technique);
Singular Value Decomposition of the trajectory matrix;
Reconstruction of the original time series based on a number of selected eigenvectors.
This decomposition initializes forecasting procedures for both the original time series and its components. The method can be naturally extended to multidimensional time series and to image processing.
The method is a powerful and useful tool of time series analysis in meteorology, hydrology, geophysics, climatology and, according to our experience, in economics, biology, physics, medicine and other sciences; that is, where short and long, one-dimensional and multidimensional, stationary and non-stationary, almost deterministic and noisy time series are to be analyzed.
Included:
Bar coloring
[*Alerts
[*Signals
[*Loxx's Expanded Source Types
Related Williams %R Indicators
Williams %R on Chart w/ Dynamic Zones
Williams %R w/ Bollinger Bands
Intermediate Williams %R w/ Discontinued Signal Lines
Related SSA Indicators
End-pointed SSA of FDASMA
End-pointed SSA of Normalized Price Oscillator
Williams %R (v.4)This is an upgrade and an update of my Williams %R indicator modification.
As before this implementation is enhanced with CCI in the form of background colors. These colors can be used as a confirmation signal and indication of a current trend. Thee also can be employed in deciding when to enter/exit the market.
Besides, added is a scaling function and Lower/Upper Bound inputs.
Fractals + Alligator + Divergent Bars + Squat BarsFractals + Alligator + Divergent Bars + Squat Bars Williams Indicators
All combined in one
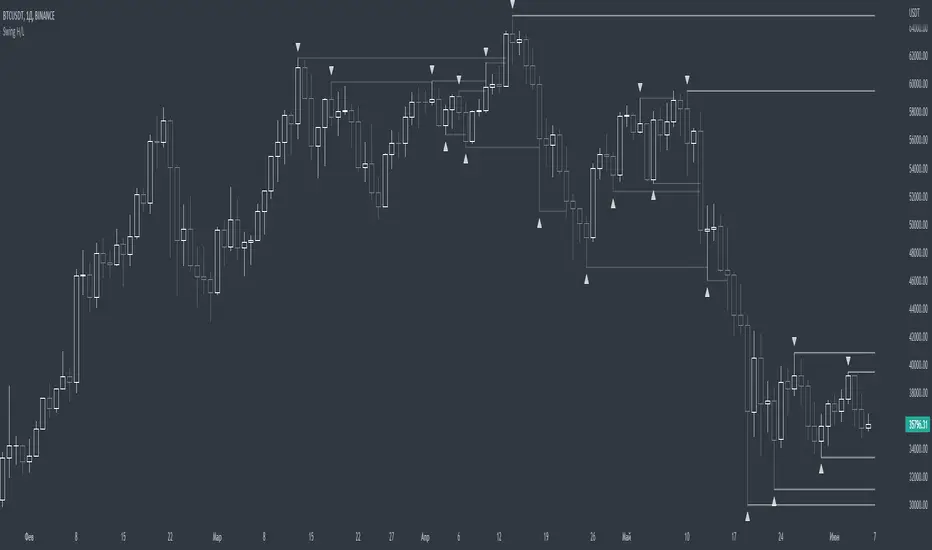
Swing PointsEnglish:
The indicator shows the fractals where stop-losses may be located and can be used to trade from their taking.
You can adjust the length of the fractal (the number of bars with which it is surrounded on both sides, to confirm the validity).
You can also display lines from fractal points for clarity.
To keep the chart clean, you can enable deletion of already taken fractals.
Example of use with deleted fractals and without lines:
Русский:
Индикатор показывает фракталы где могут находиться стоп-лоссы и его можно использовать для торговли от их снятия.
Можно настраивать длину фрактала (количество баров, которыми он окружен с обеих сторон, для подтверждения валидности).
Так же можно выводить линии от фрактальных точек для наглядности.
Для сохранения чистоты графика можно включить удаление уже снятых фракталов.
Пример использования с удалением снятых фракталов и без линий:
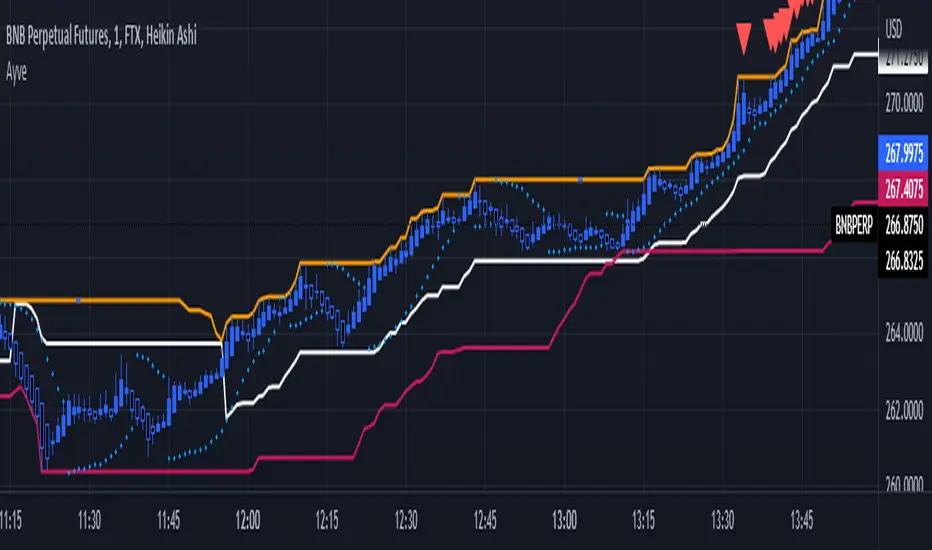
Ayvebotemİki kanal arasında çalışan içinde süper trend,parabolic sar ve bollinger bantları bulunan combo bir indikatör.
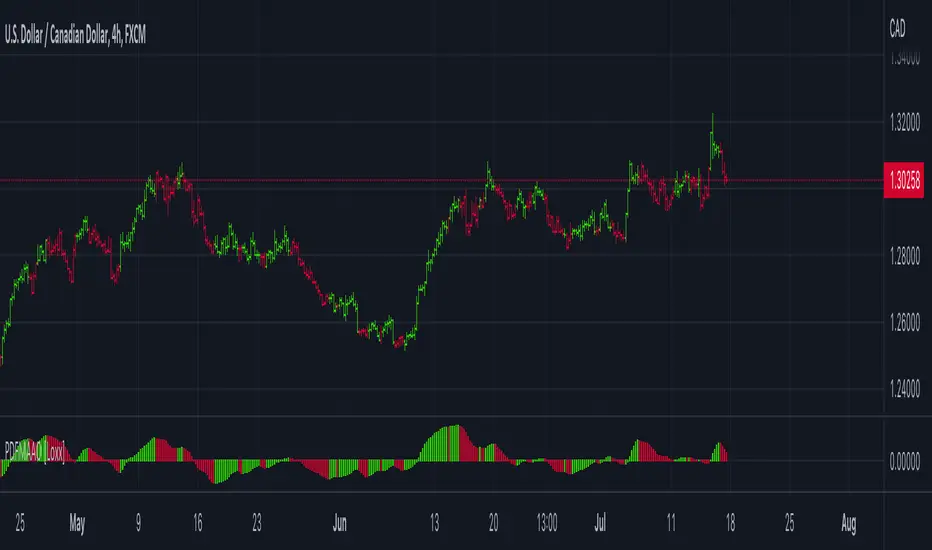
PDFMA Awesome Oscillator [Loxx]Theory:
Bill Williams's Awesome Oscillator Technical Indicator (AO) is a 34-period simple moving average, plotted through the bars midpoints (H+L)/2, which is subtracted from the 5-period simple moving average, built across the bars midpoints (H+L)/2. It shows us quite clearly what’s happening to the market driving force at the present moment.
This version uses PdfMA (Probability Density Function weighted Moving Average) instead of SMA (Simple Moving Average). This is a deviation from the original AO since in the AO since there is no parameter that you can change, but with this version, you can change the variance part of the PdfMA calculation. That way you can get different values for the AO even without changing periods of calculation (the general rule of thumb is: the greater the variance, the smoother the result)
Usage:
You can use color changes (mainly on zero cross) for trend change signals
Williams Divergent Bar (First Wise Man)Based on Bill Williams' First Wise Man. Bull candles are marked with purple and Bear candles with blue.
Requirements:
- Candle height must be greater than ATR (filter out tiny Doji candles)
- Open and Close must be beyond the HL2 (midpoint) for either Bull or Bear scenarios
- Candle HL2 must be more than 1x ATR from the Alligator Jaw (13-period SMMA, pushed forward 8 periods). The dark blue line in my example.
- ATR is calculated using a 13-period RMA of the true range
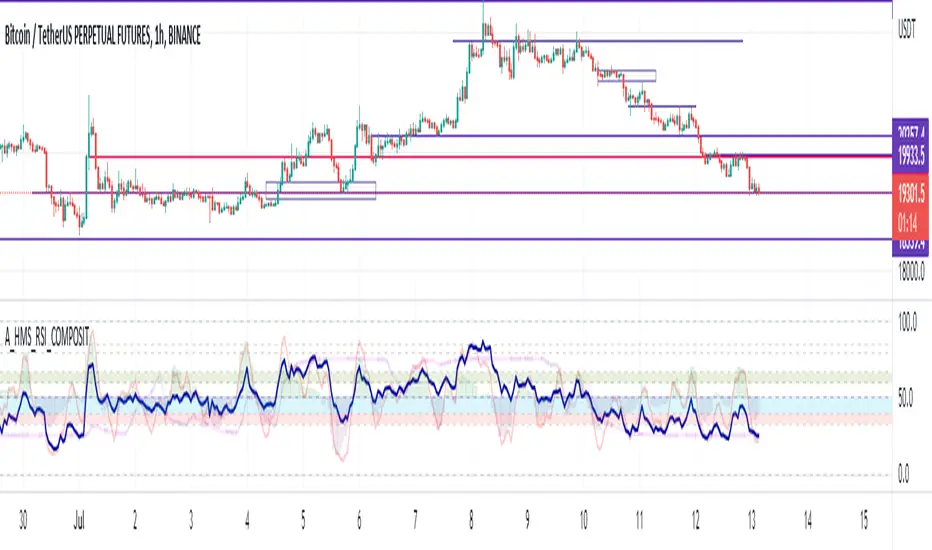
A_HMS_RSI_COMPOSITMy majic Macd Indicator with Ema base macd is My great Indicator that combine four ema base macd lines with its signal lines that show price gravity by best way , and one spatial chart that is the best part of this magic indicator that help you to trading without any problem
for better use note that:
green fill line is ema 66 and ema 199 macd and signal its name is macd very slow signal line
blue fill line is ema 19 and ema 66 macd and signal its name is macd normal signal line
red fill line is ema 9 and ema 19 macd and signal its name is macd very fast signal line
black line is ema 4 and ema 14 macd its name is macd main signal line
in all of this lines we can define divergence
when this lines crossing over and under from together each of this crossings give me some signals and because this signals very much we cant describe thats in some lines
but note that we in fact trade just by black line but short and long position determine by position of black line instead of other lines and positions of other lines from each ones
purple line is rsi line
red line is composite line
blue line is rmi line
red and Blue below line is Slow Stochastic lines
blue and orange line is Stochastic ema with ema12 - ema21
and third chart is a secret indicator that help more to determine best place to start trading
A_HMS_RSI is My great Indicator that RSI , RMI and , momentum of price movement by a histogram , that help you to trading without any problem
for better use note that:
blue line is rsi line with hl2 source and 14 length
low color line is rmi line with momentum 33
rmi of price with momentum 33 is a very good signal for long positions.
momentum histogram help us to define strong of price motion in each time
some futures is hidden by default:
composite red and green signal line
rmi of price with momentum 4
ema 13, 33 of rmi as signal line and rsi and composit
finaly u can change any colors from setting
in background we determine some filled zones for better use of Indicator
when composite line run away from histogram momentum increase rapidly
when composite and rsi line is in same way its time to get position .
rmi of price with momentum 20 is a very good signal for long positions.
some futures is hidden by default:
composite red and green signal line
rmi of price with momentum 20
ema 13, 33 of rmi as signal line
finaly u can change any colors from setting
and you can get stoch signals too
in background we determine some filled zones for better use of Indicator
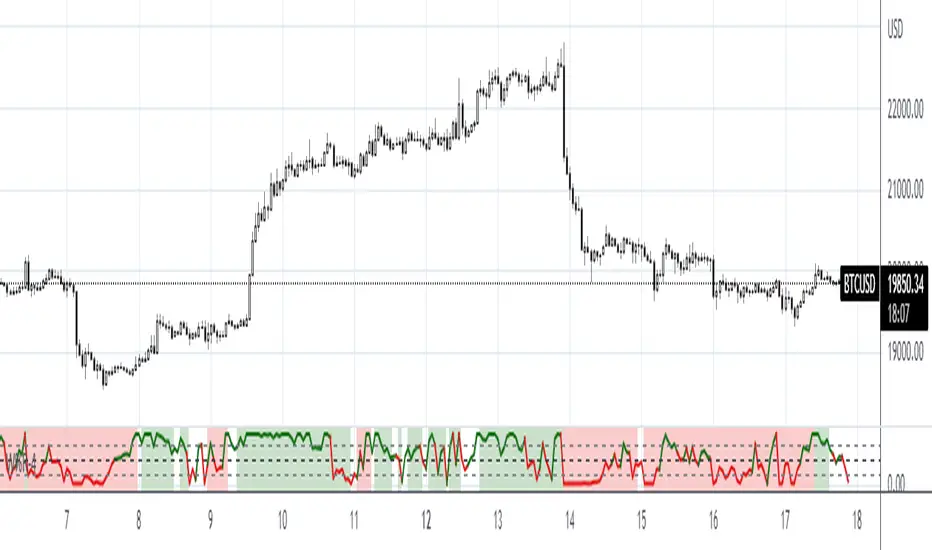
Phase Accumulation, Smoothed Williams %R Histogram [Loxx]Phase Accumulation, Smoothed Williams %R Histogram is a Williams %R indicator using dynamic inputs from Ehlers Phase Accumulation Dominant Cycle Period Algorithm. This indicator includes alerts and signals and is in a smoothed histogram form. The version of Phase Accumulation in this indicator is a modified form of of Ehlers algorithm to allow for better smoothing and cycle length selection.
What is Williams %R?
Williams %R , also known as the Williams Percent Range, is a type of momentum indicator that moves between 0 and -100 and measures overbought and oversold levels. The Williams %R may be used to find entry and exit points in the market. The indicator is very similar to the Stochastic oscillator and is used in the same way. It was developed by Larry Williams and it compares a stock’s closing price to the high-low range over a specific period, typically 14 days or periods.
What is Phase Accumulation?
The phase accumulation method of computing the dominant cycle is perhaps the easiest to comprehend. In this technique, we measure the phase at each sample by taking the arctangent of the ratio of the quadrature component to the in-phase component. A delta phase is generated by taking the difference of the phase between successive samples. At each sample we can then look backwards, adding up the delta phases.When the sum of the delta phases reaches 360 degrees, we must have passed through one full cycle, on average.The process is repeated for each new sample.
The phase accumulation method of cycle measurement always uses one full cycle’s worth of historical data.This is both an advantage and a disadvantage.The advantage is the lag in obtaining the answer scales directly with the cycle period.That is, the measurement of a short cycle period has less lag than the measurement of a longer cycle period. However, the number of samples used in making the measurement means the averaging period is variable with cycle period. longer averaging reduces the noise level compared to the signal.Therefore, shorter cycle periods necessarily have a higher out- put signal-to-noise ratio.
Included:
-Toggle on/off bar coloring
-Toggle on/off signals
-Alerts long/short
-Loxx's Expanded Source Types Library
