Naveen Prabhu with EMA//@version=6
indicator('Naveen Prabhu with EMA', overlay = true, max_labels_count = 500, max_lines_count = 500, max_boxes_count = 500)
a = input(2, title = 'Key Vaule. \'This changes the sensitivity\'')
c = input(5, title = 'ATR Period')
h = input(false, title = 'Signals from Heikin Ashi Candles')
BULLISH_LEG = 1
BEARISH_LEG = 0
BULLISH = +1
BEARISH = -1
GREEN = #089981
RED = #F23645
BLUE = #2157f3
GRAY = #878b94
MONO_BULLISH = #b2b5be
MONO_BEARISH = #5d606b
HISTORICAL = 'Historical'
PRESENT = 'Present'
COLORED = 'Colored'
MONOCHROME = 'Monochrome'
ALL = 'All'
BOS = 'BOS'
CHOCH = 'CHoCH'
TINY = size.tiny
SMALL = size.small
NORMAL = size.normal
ATR = 'Atr'
RANGE = 'Cumulative Mean Range'
CLOSE = 'Close'
HIGHLOW = 'High/Low'
SOLID = '⎯⎯⎯'
DASHED = '----'
DOTTED = '····'
SMART_GROUP = 'Smart Money Concepts'
INTERNAL_GROUP = 'Real Time Internal Structure'
SWING_GROUP = 'Real Time Swing Structure'
BLOCKS_GROUP = 'Order Blocks'
EQUAL_GROUP = 'EQH/EQL'
GAPS_GROUP = 'Fair Value Gaps'
LEVELS_GROUP = 'Highs & Lows MTF'
ZONES_GROUP = 'Premium & Discount Zones'
modeTooltip = 'Allows to display historical Structure or only the recent ones'
styleTooltip = 'Indicator color theme'
showTrendTooltip = 'Display additional candles with a color reflecting the current trend detected by structure'
showInternalsTooltip = 'Display internal market structure'
internalFilterConfluenceTooltip = 'Filter non significant internal structure breakouts'
showStructureTooltip = 'Display swing market Structure'
showSwingsTooltip = 'Display swing point as labels on the chart'
showHighLowSwingsTooltip = 'Highlight most recent strong and weak high/low points on the chart'
showInternalOrderBlocksTooltip = 'Display internal order blocks on the chart Number of internal order blocks to display on the chart'
showSwingOrderBlocksTooltip = 'Display swing order blocks on the chart Number of internal swing blocks to display on the chart'
orderBlockFilterTooltip = 'Method used to filter out volatile order blocks It is recommended to use the cumulative mean range method when a low amount of data is available'
orderBlockMitigationTooltip = 'Select what values to use for order block mitigation'
showEqualHighsLowsTooltip = 'Display equal highs and equal lows on the chart'
equalHighsLowsLengthTooltip = 'Number of bars used to confirm equal highs and equal lows'
equalHighsLowsThresholdTooltip = 'Sensitivity threshold in a range (0, 1) used for the detection of equal highs & lows Lower values will return fewer but more pertinent results'
showFairValueGapsTooltip = 'Display fair values gaps on the chart'
fairValueGapsThresholdTooltip = 'Filter out non significant fair value gaps'
fairValueGapsTimeframeTooltip = 'Fair value gaps timeframe'
fairValueGapsExtendTooltip = 'Determine how many bars to extend the Fair Value Gap boxes on chart'
showPremiumDiscountZonesTooltip = 'Display premium, discount, and equilibrium zones on chart'
modeInput = input.string( HISTORICAL, 'Mode', group = SMART_GROUP, tooltip = modeTooltip, options = )
styleInput = input.string( COLORED, 'Style', group = SMART_GROUP, tooltip = styleTooltip,options = )
showTrendInput = input( false, 'Color Candles', group = SMART_GROUP, tooltip = showTrendTooltip)
showInternalsInput = input( false, 'Show Internal Structure', group = INTERNAL_GROUP, tooltip = showInternalsTooltip)
showInternalBullInput = input.string( ALL, 'Bullish Structure', group = INTERNAL_GROUP, inline = 'ibull', options = )
internalBullColorInput = input( GREEN, '', group = INTERNAL_GROUP, inline = 'ibull')
showInternalBearInput = input.string( ALL, 'Bearish Structure' , group = INTERNAL_GROUP, inline = 'ibear', options = )
internalBearColorInput = input( RED, '', group = INTERNAL_GROUP, inline = 'ibear')
internalFilterConfluenceInput = input( false, 'Confluence Filter', group = INTERNAL_GROUP, tooltip = internalFilterConfluenceTooltip)
internalStructureSize = input.string( TINY, 'Internal Label Size', group = INTERNAL_GROUP, options = )
showStructureInput = input( false, 'Show Swing Structure', group = SWING_GROUP, tooltip = showStructureTooltip)
showSwingBullInput = input.string( ALL, 'Bullish Structure', group = SWING_GROUP, inline = 'bull', options = )
swingBullColorInput = input( GREEN, '', group = SWING_GROUP, inline = 'bull')
showSwingBearInput = input.string( ALL, 'Bearish Structure', group = SWING_GROUP, inline = 'bear', options = )
swingBearColorInput = input( RED, '', group = SWING_GROUP, inline = 'bear')
swingStructureSize = input.string( SMALL, 'Swing Label Size', group = SWING_GROUP, options = )
showSwingsInput = input( false, 'Show Swings Points', group = SWING_GROUP, tooltip = showSwingsTooltip,inline = 'swings')
swingsLengthInput = input.int( 50, '', group = SWING_GROUP, minval = 10, inline = 'swings')
showHighLowSwingsInput = input( false, 'Show Strong/Weak High/Low',group = SWING_GROUP, tooltip = showHighLowSwingsTooltip)
showInternalOrderBlocksInput = input( true, 'Internal Order Blocks' , group = BLOCKS_GROUP, tooltip = showInternalOrderBlocksTooltip, inline = 'iob')
internalOrderBlocksSizeInput = input.int( 5, '', group = BLOCKS_GROUP, minval = 1, maxval = 20, inline = 'iob')
showSwingOrderBlocksInput = input( true, 'Swing Order Blocks', group = BLOCKS_GROUP, tooltip = showSwingOrderBlocksTooltip, inline = 'ob')
swingOrderBlocksSizeInput = input.int( 5, '', group = BLOCKS_GROUP, minval = 1, maxval = 20, inline = 'ob')
orderBlockFilterInput = input.string( 'Atr', 'Order Block Filter', group = BLOCKS_GROUP, tooltip = orderBlockFilterTooltip, options = )
orderBlockMitigationInput = input.string( HIGHLOW, 'Order Block Mitigation', group = BLOCKS_GROUP, tooltip = orderBlockMitigationTooltip, options = )
internalBullishOrderBlockColor = input.color(color.new(GREEN, 80), 'Internal Bullish OB', group = BLOCKS_GROUP)
internalBearishOrderBlockColor = input.color(color.new(#f77c80, 80), 'Internal Bearish OB', group = BLOCKS_GROUP)
swingBullishOrderBlockColor = input.color(color.new(GREEN, 80), 'Bullish OB', group = BLOCKS_GROUP)
swingBearishOrderBlockColor = input.color(color.new(#b22833, 80), 'Bearish OB', group = BLOCKS_GROUP)
showEqualHighsLowsInput = input( false, 'Equal High/Low', group = EQUAL_GROUP, tooltip = showEqualHighsLowsTooltip)
equalHighsLowsLengthInput = input.int( 3, 'Bars Confirmation', group = EQUAL_GROUP, tooltip = equalHighsLowsLengthTooltip, minval = 1)
equalHighsLowsThresholdInput = input.float( 0.1, 'Threshold', group = EQUAL_GROUP, tooltip = equalHighsLowsThresholdTooltip, minval = 0, maxval = 0.5, step = 0.1)
equalHighsLowsSizeInput = input.string( TINY, 'Label Size', group = EQUAL_GROUP, options = )
showFairValueGapsInput = input( false, 'Fair Value Gaps', group = GAPS_GROUP, tooltip = showFairValueGapsTooltip)
fairValueGapsThresholdInput = input( true, 'Auto Threshold', group = GAPS_GROUP, tooltip = fairValueGapsThresholdTooltip)
fairValueGapsTimeframeInput = input.timeframe('', 'Timeframe', group = GAPS_GROUP, tooltip = fairValueGapsTimeframeTooltip)
fairValueGapsBullColorInput = input.color(color.new(#00ff68, 70), 'Bullish FVG' , group = GAPS_GROUP)
fairValueGapsBearColorInput = input.color(color.new(#ff0008, 70), 'Bearish FVG' , group = GAPS_GROUP)
fairValueGapsExtendInput = input.int( 1, 'Extend FVG', group = GAPS_GROUP, tooltip = fairValueGapsExtendTooltip, minval = 0)
showDailyLevelsInput = input( false, 'Daily', group = LEVELS_GROUP, inline = 'daily')
dailyLevelsStyleInput = input.string( SOLID, '', group = LEVELS_GROUP, inline = 'daily', options = )
dailyLevelsColorInput = input( BLUE, '', group = LEVELS_GROUP, inline = 'daily')
showWeeklyLevelsInput = input( false, 'Weekly', group = LEVELS_GROUP, inline = 'weekly')
weeklyLevelsStyleInput = input.string( SOLID, '', group = LEVELS_GROUP, inline = 'weekly', options = )
weeklyLevelsColorInput = input( BLUE, '', group = LEVELS_GROUP, inline = 'weekly')
showMonthlyLevelsInput = input( false, 'Monthly', group = LEVELS_GROUP, inline = 'monthly')
monthlyLevelsStyleInput = input.string( SOLID, '', group = LEVELS_GROUP, inline = 'monthly', options = )
monthlyLevelsColorInput = input( BLUE, '', group = LEVELS_GROUP, inline = 'monthly')
showPremiumDiscountZonesInput = input( false, 'Premium/Discount Zones', group = ZONES_GROUP , tooltip = showPremiumDiscountZonesTooltip)
premiumZoneColorInput = input.color( RED, 'Premium Zone', group = ZONES_GROUP)
equilibriumZoneColorInput = input.color( GRAY, 'Equilibrium Zone', group = ZONES_GROUP)
discountZoneColorInput = input.color( GREEN, 'Discount Zone', group = ZONES_GROUP)
type alerts
bool internalBullishBOS = false
bool internalBearishBOS = false
bool internalBullishCHoCH = false
bool internalBearishCHoCH = false
bool swingBullishBOS = false
bool swingBearishBOS = false
bool swingBullishCHoCH = false
bool swingBearishCHoCH = false
bool internalBullishOrderBlock = false
bool internalBearishOrderBlock = false
bool swingBullishOrderBlock = false
bool swingBearishOrderBlock = false
bool equalHighs = false
bool equalLows = false
bool bullishFairValueGap = false
bool bearishFairValueGap = false
type trailingExtremes
float top
float bottom
int barTime
int barIndex
int lastTopTime
int lastBottomTime
type fairValueGap
float top
float bottom
int bias
box topBox
box bottomBox
type trend
int bias
type equalDisplay
line l_ine = na
label l_abel = na
type pivot
float currentLevel
float lastLevel
bool crossed
int barTime = time
int barIndex = bar_index
type orderBlock
float barHigh
float barLow
int barTime
int bias
// @variable current swing pivot high
var pivot swingHigh = pivot.new(na,na,false)
// @variable current swing pivot low
var pivot swingLow = pivot.new(na,na,false)
// @variable current internal pivot high
var pivot internalHigh = pivot.new(na,na,false)
// @variable current internal pivot low
var pivot internalLow = pivot.new(na,na,false)
// @variable current equal high pivot
var pivot equalHigh = pivot.new(na,na,false)
// @variable current equal low pivot
var pivot equalLow = pivot.new(na,na,false)
// @variable swing trend bias
var trend swingTrend = trend.new(0)
// @variable internal trend bias
var trend internalTrend = trend.new(0)
// @variable equal high display
var equalDisplay equalHighDisplay = equalDisplay.new()
// @variable equal low display
var equalDisplay equalLowDisplay = equalDisplay.new()
// @variable storage for fairValueGap UDTs
var array fairValueGaps = array.new()
// @variable storage for parsed highs
var array parsedHighs = array.new()
// @variable storage for parsed lows
var array parsedLows = array.new()
// @variable storage for raw highs
var array highs = array.new()
// @variable storage for raw lows
var array lows = array.new()
// @variable storage for bar time values
var array times = array.new()
// @variable last trailing swing high and low
var trailingExtremes trailing = trailingExtremes.new()
// @variable storage for orderBlock UDTs (swing order blocks)
var array swingOrderBlocks = array.new()
// @variable storage for orderBlock UDTs (internal order blocks)
var array internalOrderBlocks = array.new()
// @variable storage for swing order blocks boxes
var array swingOrderBlocksBoxes = array.new()
// @variable storage for internal order blocks boxes
var array internalOrderBlocksBoxes = array.new()
// @variable color for swing bullish structures
var swingBullishColor = styleInput == MONOCHROME ? MONO_BULLISH : swingBullColorInput
// @variable color for swing bearish structures
var swingBearishColor = styleInput == MONOCHROME ? MONO_BEARISH : swingBearColorInput
// @variable color for bullish fair value gaps
var fairValueGapBullishColor = styleInput == MONOCHROME ? color.new(MONO_BULLISH,70) : fairValueGapsBullColorInput
// @variable color for bearish fair value gaps
var fairValueGapBearishColor = styleInput == MONOCHROME ? color.new(MONO_BEARISH,70) : fairValueGapsBearColorInput
// @variable color for premium zone
var premiumZoneColor = styleInput == MONOCHROME ? MONO_BEARISH : premiumZoneColorInput
// @variable color for discount zone
var discountZoneColor = styleInput == MONOCHROME ? MONO_BULLISH : discountZoneColorInput
// @variable bar index on current script iteration
varip int currentBarIndex = bar_index
// @variable bar index on last script iteration
varip int lastBarIndex = bar_index
// @variable alerts in current bar
alerts currentAlerts = alerts.new()
// @variable time at start of chart
var initialTime = time
// we create the needed boxes for displaying order blocks at the first execution
if barstate.isfirst
if showSwingOrderBlocksInput
for index = 1 to swingOrderBlocksSizeInput
swingOrderBlocksBoxes.push(box.new(na,na,na,na,xloc = xloc.bar_time,extend = extend.right))
if showInternalOrderBlocksInput
for index = 1 to internalOrderBlocksSizeInput
internalOrderBlocksBoxes.push(box.new(na,na,na,na,xloc = xloc.bar_time,extend = extend.right))
// @variable source to use in bearish order blocks mitigation
bearishOrderBlockMitigationSource = orderBlockMitigationInput == CLOSE ? close : high
// @variable source to use in bullish order blocks mitigation
bullishOrderBlockMitigationSource = orderBlockMitigationInput == CLOSE ? close : low
// @variable default volatility measure
atrMeasure = ta.atr(200)
// @variable parsed volatility measure by user settings
volatilityMeasure = orderBlockFilterInput == ATR ? atrMeasure : ta.cum(ta.tr)/bar_index
// @variable true if current bar is a high volatility bar
highVolatilityBar = (high - low) >= (2 * volatilityMeasure)
// @variable parsed high
parsedHigh = highVolatilityBar ? low : high
// @variable parsed low
parsedLow = highVolatilityBar ? high : low
// we store current values into the arrays at each bar
parsedHighs.push(parsedHigh)
parsedLows.push(parsedLow)
highs.push(high)
lows.push(low)
times.push(time)
leg(int size) =>
var leg = 0
newLegHigh = high > ta.highest( size)
newLegLow = low < ta.lowest( size)
if newLegHigh
leg := BEARISH_LEG
else if newLegLow
leg := BULLISH_LEG
leg
startOfNewLeg(int leg) => ta.change(leg) != 0
startOfBearishLeg(int leg) => ta.change(leg) == -1
startOfBullishLeg(int leg) => ta.change(leg) == +1
drawLabel(int labelTime, float labelPrice, string tag, color labelColor, string labelStyle) =>
var label l_abel = na
if modeInput == PRESENT
l_abel.delete()
l_abel := label.new(chart.point.new(labelTime,na,labelPrice),tag,xloc.bar_time,color=color(na),textcolor=labelColor,style = labelStyle,size = size.small)
drawEqualHighLow(pivot p_ivot, float level, int size, bool equalHigh) =>
equalDisplay e_qualDisplay = equalHigh ? equalHighDisplay : equalLowDisplay
string tag = 'EQL'
color equalColor = swingBullishColor
string labelStyle = label.style_label_up
if equalHigh
tag := 'EQH'
equalColor := swingBearishColor
labelStyle := label.style_label_down
if modeInput == PRESENT
line.delete( e_qualDisplay.l_ine)
label.delete( e_qualDisplay.l_abel)
e_qualDisplay.l_ine := line.new(chart.point.new(p_ivot.barTime,na,p_ivot.currentLevel), chart.point.new(time ,na,level), xloc = xloc.bar_time, color = equalColor, style = line.style_dotted)
labelPosition = math.round(0.5*(p_ivot.barIndex + bar_index - size))
e_qualDisplay.l_abel := label.new(chart.point.new(na,labelPosition,level), tag, xloc.bar_index, color = color(na), textcolor = equalColor, style = labelStyle, size = equalHighsLowsSizeInput)
getCurrentStructure(int size,bool equalHighLow = false, bool internal = false) =>
currentLeg = leg(size)
newPivot = startOfNewLeg(currentLeg)
pivotLow = startOfBullishLeg(currentLeg)
pivotHigh = startOfBearishLeg(currentLeg)
if newPivot
if pivotLow
pivot p_ivot = equalHighLow ? equalLow : internal ? internalLow : swingLow
if equalHighLow and math.abs(p_ivot.currentLevel - low ) < equalHighsLowsThresholdInput * atrMeasure
drawEqualHighLow(p_ivot, low , size, false)
p_ivot.lastLevel := p_ivot.currentLevel
p_ivot.currentLevel := low
p_ivot.crossed := false
p_ivot.barTime := time
p_ivot.barIndex := bar_index
if not equalHighLow and not internal
trailing.bottom := p_ivot.currentLevel
trailing.barTime := p_ivot.barTime
trailing.barIndex := p_ivot.barIndex
trailing.lastBottomTime := p_ivot.barTime
if showSwingsInput and not internal and not equalHighLow
drawLabel(time , p_ivot.currentLevel, p_ivot.currentLevel < p_ivot.lastLevel ? 'LL' : 'HL', swingBullishColor, label.style_label_up)
else
pivot p_ivot = equalHighLow ? equalHigh : internal ? internalHigh : swingHigh
if equalHighLow and math.abs(p_ivot.currentLevel - high ) < equalHighsLowsThresholdInput * atrMeasure
drawEqualHighLow(p_ivot,high ,size,true)
p_ivot.lastLevel := p_ivot.currentLevel
p_ivot.currentLevel := high
p_ivot.crossed := false
p_ivot.barTime := time
p_ivot.barIndex := bar_index
if not equalHighLow and not internal
trailing.top := p_ivot.currentLevel
trailing.barTime := p_ivot.barTime
trailing.barIndex := p_ivot.barIndex
trailing.lastTopTime := p_ivot.barTime
if showSwingsInput and not internal and not equalHighLow
drawLabel(time , p_ivot.currentLevel, p_ivot.currentLevel > p_ivot.lastLevel ? 'HH' : 'LH', swingBearishColor, label.style_label_down)
drawStructure(pivot p_ivot, string tag, color structureColor, string lineStyle, string labelStyle, string labelSize) =>
var line l_ine = line.new(na,na,na,na,xloc = xloc.bar_time)
var label l_abel = label.new(na,na)
if modeInput == PRESENT
l_ine.delete()
l_abel.delete()
l_ine := line.new(chart.point.new(p_ivot.barTime,na,p_ivot.currentLevel), chart.point.new(time,na,p_ivot.currentLevel), xloc.bar_time, color=structureColor, style=lineStyle)
l_abel := label.new(chart.point.new(na,math.round(0.5*(p_ivot.barIndex+bar_index)),p_ivot.currentLevel), tag, xloc.bar_index, color=color(na), textcolor=structureColor, style=labelStyle, size = labelSize)
deleteOrderBlocks(bool internal = false) =>
array orderBlocks = internal ? internalOrderBlocks : swingOrderBlocks
for in orderBlocks
bool crossedOderBlock = false
if bearishOrderBlockMitigationSource > eachOrderBlock.barHigh and eachOrderBlock.bias == BEARISH
crossedOderBlock := true
if internal
currentAlerts.internalBearishOrderBlock := true
else
currentAlerts.swingBearishOrderBlock := true
else if bullishOrderBlockMitigationSource < eachOrderBlock.barLow and eachOrderBlock.bias == BULLISH
crossedOderBlock := true
if internal
currentAlerts.internalBullishOrderBlock := true
else
currentAlerts.swingBullishOrderBlock := true
if crossedOderBlock
orderBlocks.remove(index)
storeOrdeBlock(pivot p_ivot,bool internal = false,int bias) =>
if (not internal and showSwingOrderBlocksInput) or (internal and showInternalOrderBlocksInput)
array a_rray = na
int parsedIndex = na
if bias == BEARISH
a_rray := parsedHighs.slice(p_ivot.barIndex,bar_index)
parsedIndex := p_ivot.barIndex + a_rray.indexof(a_rray.max())
else
a_rray := parsedLows.slice(p_ivot.barIndex,bar_index)
parsedIndex := p_ivot.barIndex + a_rray.indexof(a_rray.min())
orderBlock o_rderBlock = orderBlock.new(parsedHighs.get(parsedIndex), parsedLows.get(parsedIndex), times.get(parsedIndex),bias)
array orderBlocks = internal ? internalOrderBlocks : swingOrderBlocks
if orderBlocks.size() >= 100
orderBlocks.pop()
orderBlocks.unshift(o_rderBlock)
drawOrderBlocks(bool internal = false) =>
array orderBlocks = internal ? internalOrderBlocks : swingOrderBlocks
orderBlocksSize = orderBlocks.size()
if orderBlocksSize > 0
maxOrderBlocks = internal ? internalOrderBlocksSizeInput : swingOrderBlocksSizeInput
array parsedOrdeBlocks = orderBlocks.slice(0, math.min(maxOrderBlocks,orderBlocksSize))
array b_oxes = internal ? internalOrderBlocksBoxes : swingOrderBlocksBoxes
for in parsedOrdeBlocks
orderBlockColor = styleInput == MONOCHROME ? (eachOrderBlock.bias == BEARISH ? color.new(MONO_BEARISH,80) : color.new(MONO_BULLISH,80)) : internal ? (eachOrderBlock.bias == BEARISH ? internalBearishOrderBlockColor : internalBullishOrderBlockColor) : (eachOrderBlock.bias == BEARISH ? swingBearishOrderBlockColor : swingBullishOrderBlockColor)
box b_ox = b_oxes.get(index)
b_ox.set_top_left_point( chart.point.new(eachOrderBlock.barTime,na,eachOrderBlock.barHigh))
b_ox.set_bottom_right_point(chart.point.new(last_bar_time,na,eachOrderBlock.barLow))
b_ox.set_border_color( internal ? na : orderBlockColor)
b_ox.set_bgcolor( orderBlockColor)
displayStructure(bool internal = false) =>
var bullishBar = true
var bearishBar = true
if internalFilterConfluenceInput
bullishBar := high - math.max(close, open) > math.min(close, open - low)
bearishBar := high - math.max(close, open) < math.min(close, open - low)
pivot p_ivot = internal ? internalHigh : swingHigh
trend t_rend = internal ? internalTrend : swingTrend
lineStyle = internal ? line.style_dashed : line.style_solid
labelSize = internal ? internalStructureSize : swingStructureSize
extraCondition = internal ? internalHigh.currentLevel != swingHigh.currentLevel and bullishBar : true
bullishColor = styleInput == MONOCHROME ? MONO_BULLISH : internal ? internalBullColorInput : swingBullColorInput
if ta.crossover(close,p_ivot.currentLevel) and not p_ivot.crossed and extraCondition
string tag = t_rend.bias == BEARISH ? CHOCH : BOS
if internal
currentAlerts.internalBullishCHoCH := tag == CHOCH
currentAlerts.internalBullishBOS := tag == BOS
else
currentAlerts.swingBullishCHoCH := tag == CHOCH
currentAlerts.swingBullishBOS := tag == BOS
p_ivot.crossed := true
t_rend.bias := BULLISH
displayCondition = internal ? showInternalsInput and (showInternalBullInput == ALL or (showInternalBullInput == BOS and tag != CHOCH) or (showInternalBullInput == CHOCH and tag == CHOCH)) : showStructureInput and (showSwingBullInput == ALL or (showSwingBullInput == BOS and tag != CHOCH) or (showSwingBullInput == CHOCH and tag == CHOCH))
if displayCondition
drawStructure(p_ivot,tag,bullishColor,lineStyle,label.style_label_down,labelSize)
if (internal and showInternalOrderBlocksInput) or (not internal and showSwingOrderBlocksInput)
storeOrdeBlock(p_ivot,internal,BULLISH)
p_ivot := internal ? internalLow : swingLow
extraCondition := internal ? internalLow.currentLevel != swingLow.currentLevel and bearishBar : true
bearishColor = styleInput == MONOCHROME ? MONO_BEARISH : internal ? internalBearColorInput : swingBearColorInput
if ta.crossunder(close,p_ivot.currentLevel) and not p_ivot.crossed and extraCondition
string tag = t_rend.bias == BULLISH ? CHOCH : BOS
if internal
currentAlerts.internalBearishCHoCH := tag == CHOCH
currentAlerts.internalBearishBOS := tag == BOS
else
currentAlerts.swingBearishCHoCH := tag == CHOCH
currentAlerts.swingBearishBOS := tag == BOS
p_ivot.crossed := true
t_rend.bias := BEARISH
displayCondition = internal ? showInternalsInput and (showInternalBearInput == ALL or (showInternalBearInput == BOS and tag != CHOCH) or (showInternalBearInput == CHOCH and tag == CHOCH)) : showStructureInput and (showSwingBearInput == ALL or (showSwingBearInput == BOS and tag != CHOCH) or (showSwingBearInput == CHOCH and tag == CHOCH))
if displayCondition
drawStructure(p_ivot,tag,bearishColor,lineStyle,label.style_label_up,labelSize)
if (internal and showInternalOrderBlocksInput) or (not internal and showSwingOrderBlocksInput)
storeOrdeBlock(p_ivot,internal,BEARISH)
fairValueGapBox(leftTime,rightTime,topPrice,bottomPrice,boxColor) => box.new(chart.point.new(leftTime,na,topPrice),chart.point.new(rightTime + fairValueGapsExtendInput * (time-time ),na,bottomPrice), xloc=xloc.bar_time, border_color = boxColor, bgcolor = boxColor)
deleteFairValueGaps() =>
for in fairValueGaps
if (low < eachFairValueGap.bottom and eachFairValueGap.bias == BULLISH) or (high > eachFairValueGap.top and eachFairValueGap.bias == BEARISH)
eachFairValueGap.topBox.delete()
eachFairValueGap.bottomBox.delete()
fairValueGaps.remove(index)
// @function draw fair value gaps
// @returns fairValueGap ID
drawFairValueGaps() =>
= request.security(syminfo.tickerid, fairValueGapsTimeframeInput, [close , open , time , high , low , time , high , low ],lookahead = barmerge.lookahead_on)
barDeltaPercent = (lastClose - lastOpen) / (lastOpen * 100)
newTimeframe = timeframe.change(fairValueGapsTimeframeInput)
threshold = fairValueGapsThresholdInput ? ta.cum(math.abs(newTimeframe ? barDeltaPercent : 0)) / bar_index * 2 : 0
bullishFairValueGap = currentLow > last2High and lastClose > last2High and barDeltaPercent > threshold and newTimeframe
bearishFairValueGap = currentHigh < last2Low and lastClose < last2Low and -barDeltaPercent > threshold and newTimeframe
if bullishFairValueGap
currentAlerts.bullishFairValueGap := true
fairValueGaps.unshift(fairValueGap.new(currentLow,last2High,BULLISH,fairValueGapBox(lastTime,currentTime,currentLow,math.avg(currentLow,last2High),fairValueGapBullishColor),fairValueGapBox(lastTime,currentTime,math.avg(currentLow,last2High),last2High,fairValueGapBullishColor)))
if bearishFairValueGap
currentAlerts.bearishFairValueGap := true
fairValueGaps.unshift(fairValueGap.new(currentHigh,last2Low,BEARISH,fairValueGapBox(lastTime,currentTime,currentHigh,math.avg(currentHigh,last2Low),fairValueGapBearishColor),fairValueGapBox(lastTime,currentTime,math.avg(currentHigh,last2Low),last2Low,fairValueGapBearishColor)))
getStyle(string style) =>
switch style
SOLID => line.style_solid
DASHED => line.style_dashed
DOTTED => line.style_dotted
drawLevels(string timeframe, bool sameTimeframe, string style, color levelColor) =>
= request.security(syminfo.tickerid, timeframe, [high , low , time , time],lookahead = barmerge.lookahead_on)
float parsedTop = sameTimeframe ? high : topLevel
float parsedBottom = sameTimeframe ? low : bottomLevel
int parsedLeftTime = sameTimeframe ? time : leftTime
int parsedRightTime = sameTimeframe ? time : rightTime
int parsedTopTime = time
int parsedBottomTime = time
if not sameTimeframe
int leftIndex = times.binary_search_rightmost(parsedLeftTime)
int rightIndex = times.binary_search_rightmost(parsedRightTime)
array timeArray = times.slice(leftIndex,rightIndex)
array topArray = highs.slice(leftIndex,rightIndex)
array bottomArray = lows.slice(leftIndex,rightIndex)
parsedTopTime := timeArray.size() > 0 ? timeArray.get(topArray.indexof(topArray.max())) : initialTime
parsedBottomTime := timeArray.size() > 0 ? timeArray.get(bottomArray.indexof(bottomArray.min())) : initialTime
var line topLine = line.new(na, na, na, na, xloc = xloc.bar_time, color = levelColor, style = getStyle(style))
var line bottomLine = line.new(na, na, na, na, xloc = xloc.bar_time, color = levelColor, style = getStyle(style))
var label topLabel = label.new(na, na, xloc = xloc.bar_time, text = str.format('P{0}H',timeframe), color=color(na), textcolor = levelColor, size = size.small, style = label.style_label_left)
var label bottomLabel = label.new(na, na, xloc = xloc.bar_time, text = str.format('P{0}L',timeframe), color=color(na), textcolor = levelColor, size = size.small, style = label.style_label_left)
topLine.set_first_point( chart.point.new(parsedTopTime,na,parsedTop))
topLine.set_second_point( chart.point.new(last_bar_time + 20 * (time-time ),na,parsedTop))
topLabel.set_point( chart.point.new(last_bar_time + 20 * (time-time ),na,parsedTop))
bottomLine.set_first_point( chart.point.new(parsedBottomTime,na,parsedBottom))
bottomLine.set_second_point(chart.point.new(last_bar_time + 20 * (time-time ),na,parsedBottom))
bottomLabel.set_point( chart.point.new(last_bar_time + 20 * (time-time ),na,parsedBottom))
higherTimeframe(string timeframe) => timeframe.in_seconds() > timeframe.in_seconds(timeframe)
updateTrailingExtremes() =>
trailing.top := math.max(high,trailing.top)
trailing.lastTopTime := trailing.top == high ? time : trailing.lastTopTime
trailing.bottom := math.min(low,trailing.bottom)
trailing.lastBottomTime := trailing.bottom == low ? time : trailing.lastBottomTime
drawHighLowSwings() =>
var line topLine = line.new(na, na, na, na, color = swingBearishColor, xloc = xloc.bar_time)
var line bottomLine = line.new(na, na, na, na, color = swingBullishColor, xloc = xloc.bar_time)
var label topLabel = label.new(na, na, color=color(na), textcolor = swingBearishColor, xloc = xloc.bar_time, style = label.style_label_down, size = size.tiny)
var label bottomLabel = label.new(na, na, color=color(na), textcolor = swingBullishColor, xloc = xloc.bar_time, style = label.style_label_up, size = size.tiny)
rightTimeBar = last_bar_time + 20 * (time - time )
topLine.set_first_point( chart.point.new(trailing.lastTopTime, na, trailing.top))
topLine.set_second_point( chart.point.new(rightTimeBar, na, trailing.top))
topLabel.set_point( chart.point.new(rightTimeBar, na, trailing.top))
topLabel.set_text( swingTrend.bias == BEARISH ? 'Strong High' : 'Weak High')
bottomLine.set_first_point( chart.point.new(trailing.lastBottomTime, na, trailing.bottom))
bottomLine.set_second_point(chart.point.new(rightTimeBar, na, trailing.bottom))
bottomLabel.set_point( chart.point.new(rightTimeBar, na, trailing.bottom))
bottomLabel.set_text( swingTrend.bias == BULLISH ? 'Strong Low' : 'Weak Low')
drawZone(float labelLevel, int labelIndex, float top, float bottom, string tag, color zoneColor, string style) =>
var label l_abel = label.new(na,na,text = tag, color=color(na),textcolor = zoneColor, style = style, size = size.small)
var box b_ox = box.new(na,na,na,na,bgcolor = color.new(zoneColor,80),border_color = color(na), xloc = xloc.bar_time)
b_ox.set_top_left_point( chart.point.new(trailing.barTime,na,top))
b_ox.set_bottom_right_point(chart.point.new(last_bar_time,na,bottom))
l_abel.set_point( chart.point.new(na,labelIndex,labelLevel))
// @function draw premium/discount zones
// @returns void
drawPremiumDiscountZones() =>
drawZone(trailing.top, math.round(0.5*(trailing.barIndex + last_bar_index)), trailing.top, 0.95*trailing.top + 0.05*trailing.bottom, 'Premium', premiumZoneColor, label.style_label_down)
equilibriumLevel = math.avg(trailing.top, trailing.bottom)
drawZone(equilibriumLevel, last_bar_index, 0.525*trailing.top + 0.475*trailing.bottom, 0.525*trailing.bottom + 0.475*trailing.top, 'Equilibrium', equilibriumZoneColorInput, label.style_label_left)
drawZone(trailing.bottom, math.round(0.5*(trailing.barIndex + last_bar_index)), 0.95*trailing.bottom + 0.05*trailing.top, trailing.bottom, 'Discount', discountZoneColor, label.style_label_up)
parsedOpen = showTrendInput ? open : na
candleColor = internalTrend.bias == BULLISH ? swingBullishColor : swingBearishColor
plotcandle(parsedOpen,high,low,close,color = candleColor, wickcolor = candleColor, bordercolor = candleColor)
if showHighLowSwingsInput or showPremiumDiscountZonesInput
updateTrailingExtremes()
if showHighLowSwingsInput
drawHighLowSwings()
if showPremiumDiscountZonesInput
drawPremiumDiscountZones()
if showFairValueGapsInput
deleteFairValueGaps()
getCurrentStructure(swingsLengthInput,false)
getCurrentStructure(5,false,true)
if showEqualHighsLowsInput
getCurrentStructure(equalHighsLowsLengthInput,true)
if showInternalsInput or showInternalOrderBlocksInput or showTrendInput
displayStructure(true)
if showStructureInput or showSwingOrderBlocksInput or showHighLowSwingsInput
displayStructure()
if showInternalOrderBlocksInput
deleteOrderBlocks(true)
if showSwingOrderBlocksInput
deleteOrderBlocks()
if showFairValueGapsInput
drawFairValueGaps()
if barstate.islastconfirmedhistory or barstate.islast
if showInternalOrderBlocksInput
drawOrderBlocks(true)
if showSwingOrderBlocksInput
drawOrderBlocks()
lastBarIndex := currentBarIndex
currentBarIndex := bar_index
newBar = currentBarIndex != lastBarIndex
if barstate.islastconfirmedhistory or (barstate.isrealtime and newBar)
if showDailyLevelsInput and not higherTimeframe('D')
drawLevels('D',timeframe.isdaily,dailyLevelsStyleInput,dailyLevelsColorInput)
if showWeeklyLevelsInput and not higherTimeframe('W')
drawLevels('W',timeframe.isweekly,weeklyLevelsStyleInput,weeklyLevelsColorInput)
if showMonthlyLevelsInput and not higherTimeframe('M')
drawLevels('M',timeframe.ismonthly,monthlyLevelsStyleInput,monthlyLevelsColorInput)
xATR = ta.atr(c)
nLoss = a * xATR
src = h ? request.security(ticker.heikinashi(syminfo.tickerid), timeframe.period, close, lookahead = barmerge.lookahead_off) : close
xATRTrailingStop = 0.0
iff_1 = src > nz(xATRTrailingStop , 0) ? src - nLoss : src + nLoss
iff_2 = src < nz(xATRTrailingStop , 0) and src < nz(xATRTrailingStop , 0) ? math.min(nz(xATRTrailingStop ), src + nLoss) : iff_1
xATRTrailingStop := src > nz(xATRTrailingStop , 0) and src > nz(xATRTrailingStop , 0) ? math.max(nz(xATRTrailingStop ), src - nLoss) : iff_2
pos = 0
iff_3 = src > nz(xATRTrailingStop , 0) and src < nz(xATRTrailingStop , 0) ? -1 : nz(pos , 0)
pos := src < nz(xATRTrailingStop , 0) and src > nz(xATRTrailingStop , 0) ? 1 : iff_3
xcolor = pos == -1 ? color.red : pos == 1 ? color.green : color.blue
ema = ta.ema(src, 1)
above = ta.crossover(ema, xATRTrailingStop)
below = ta.crossover(xATRTrailingStop, ema)
buy = src > xATRTrailingStop and above
sell = src < xATRTrailingStop and below
barbuy = src > xATRTrailingStop
barsell = src < xATRTrailingStop
//---------------------------------------------------------------------------------------------------------------------}
//ALERTS
//---------------------------------------------------------------------------------------------------------------------{
alertcondition(currentAlerts.internalBullishBOS, 'Internal Bullish BOS', 'Internal Bullish BOS formed')
alertcondition(currentAlerts.internalBullishCHoCH, 'Internal Bullish CHoCH', 'Internal Bullish CHoCH formed')
alertcondition(currentAlerts.internalBearishBOS, 'Internal Bearish BOS', 'Internal Bearish BOS formed')
alertcondition(currentAlerts.internalBearishCHoCH, 'Internal Bearish CHoCH', 'Internal Bearish CHoCH formed')
alertcondition(currentAlerts.swingBullishBOS, 'Bullish BOS', 'Internal Bullish BOS formed')
alertcondition(currentAlerts.swingBullishCHoCH, 'Bullish CHoCH', 'Internal Bullish CHoCH formed')
alertcondition(currentAlerts.swingBearishBOS, 'Bearish BOS', 'Bearish BOS formed')
alertcondition(currentAlerts.swingBearishCHoCH, 'Bearish CHoCH', 'Bearish CHoCH formed')
alertcondition(currentAlerts.internalBullishOrderBlock, 'Bullish Internal OB Breakout', 'Price broke bullish internal OB')
alertcondition(currentAlerts.internalBearishOrderBlock, 'Bearish Internal OB Breakout', 'Price broke bearish internal OB')
alertcondition(currentAlerts.swingBullishOrderBlock, 'Bullish Swing OB Breakout', 'Price broke bullish swing OB')
alertcondition(currentAlerts.swingBearishOrderBlock, 'Bearish Swing OB Breakout', 'Price broke bearish swing OB')
alertcondition(currentAlerts.equalHighs, 'Equal Highs', 'Equal highs detected')
alertcondition(currentAlerts.equalLows, 'Equal Lows', 'Equal lows detected')
alertcondition(currentAlerts.bullishFairValueGap, 'Bullish FVG', 'Bullish FVG formed')
alertcondition(currentAlerts.bearishFairValueGap, 'Bearish FVG', 'Bearish FVG formed')
alertcondition(buy, 'UT Long', 'UT Long')
alertcondition(sell, 'UT Short', 'UT Short')
plotshape(buy, title = 'Buy', text = 'Buy', style = shape.labelup, location = location.belowbar, color = color.new(color.green, 0), textcolor = color.new(color.white, 0), size = size.tiny)
plotshape(sell, title = 'Sell', text = 'Sell', style = shape.labeldown, location = location.abovebar, color = color.new(color.red, 0), textcolor = color.new(color.white, 0), size = size.tiny)
//--------------------------------------------------------------------------------------
// EMA ADDITIONS (Editable)
//--------------------------------------------------------------------------------------
ema5Len = input.int(5, "5 EMA Length", minval = 1)
ema9Len = input.int(9, "9 EMA Length", minval = 1)
ema5 = ta.ema(src, ema5Len)
ema9 = ta.ema(src, ema9Len)
plot(ema5, "EMA 5", color = color.red, linewidth = 2)
plot(ema9, "EMA 9", color = color.blue, linewidth = 2)
barcolor(barbuy ? color.green : na)
barcolor(barsell ? color.red : na)
Beginner
Learning Understanding ta.change//First script I have published. Constructive criticism is welcome.
// I hope this may be helpful to you.
// Initially, I did this for myself as I was getting some odd results from the ta.change function. Turns out it was my error LOL. What a surprise!
// Typical syntax: ta.change(source, value)
// value doesn't need to be included. If it isn't, it will only calculate the change between the last and current value.
// Conclusion. ta.change simply calculates the difference between a previous value/candle and the latest value/candle current value in that series. Positive number states that the recent is higher.
// Bonus :-) Function on line 34 outputs the changes in a positive figure (so as to be able to sum the changes/volatility of the series of values)
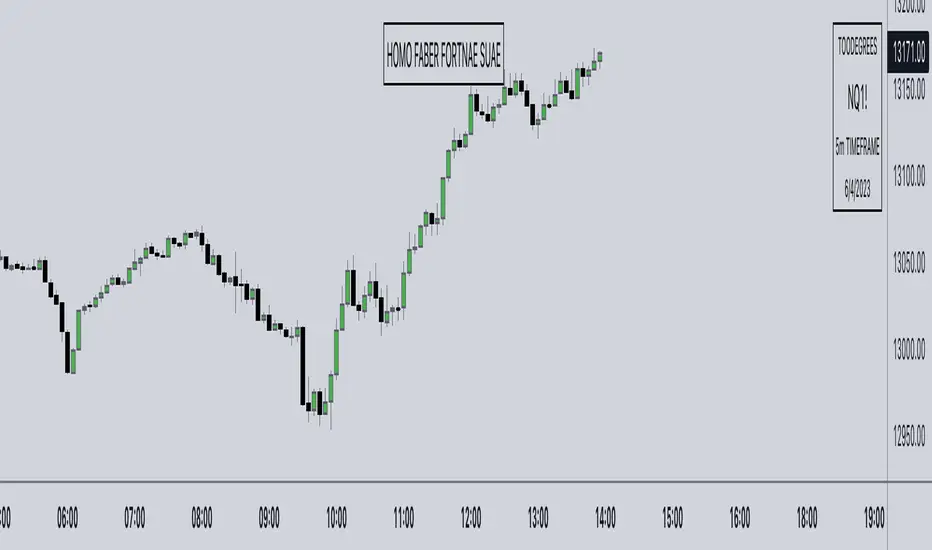
Watermark° (Quote, Name, Timeframe, Date)I have been asked for this a lot, so here it is!
It's an easy script to read, and for all you aspiring Pinescript coders out there it might serve as a little introduction on Tables , switch operator, and a bit of UI/UX!
Description:
This is just a watermark, which follows my personal style an aesthetic when it comes to Pinescript tools. I like to keep my charts clean to focus on Time and price, and I love to have a reminder to remain disciplined.
Homo Faber Fortunae Suae is a Latin maxim which loosely translates to: Humans Are The Makers Of Their Own Destiny.
So make your own destiny, master yourself and the charts!
Indicator Features:
– Display symbol ticker, timeframe and date all in one place.
– Make it look nice 🤗
– Protect your TV username ID, by having your chart show a custom username (if you are sharing charts outside of Tradingview, and are known under a different alias there)
Note: no matter what, by exporting images from TV (copy image/copy link to chart) your TV username will appear in the top left corner of the image
👇👁
Simple Buy Sell SignalsIt is a simple indicator that provides buy or sell signals based on the intersection of two EMAs and a simple moving average (SMA). once the Relative Strength Index has confirmed it. For greater accuracy, add additional indicators like stochastic RSI, MACD, etc. Use only for intraday trading, Not for Positional Trading
ETF / Stocks / Crypto - DCA Strategy v1Simple "benchmark" strategy for ETFs, Stocks and Crypto! Super-easy to implement for beginners, a DCA (dollar-cost-averaging) strategy means that you buy a fixed amount of an ETF / Stock / Crypto every several months. For instance, to DCA the S&P 500 (SPY), you could purchase $10,000 USD every 12 months, irrespective of the market price. Assuming the macro-economic conditions of the underlying country remain favourable, DCA strategies will result in capital gains over a period of many years, e.g. 10 years. DCA is the safest strategy that beginners can employ to make money in the markets, and all other types of strategies should be "benchmarked" against DCA; if your strategy cannot outperform DCA, then your strategy is useless.
Recommended Chart Settings:
Asset Class: ETF / Stocks / Crypto
Time Frame: H1 (Hourly) / D1 (Daily) / W1 (Weekly) / M1 (Monthly)
Necessary ETF Macro Conditions:
1. Country must have healthy demographics, good ratio of young > old
2. Country population must be increasing
3. Country must be experiencing price-inflation
Necessary Stock Conditions:
1. Growing revenue
2. Growing net income
3. Consistent net margins
4. Higher gross/net profit margin compared to its peers in the industry
5. Growing share holders equity
6. Current ratios > 1
7. Debt to equity ratio (compare to peers)
8. Debt servicing ratio < 30%
9. Wide economic moat
10. Products and services used daily, and will stay relevant for at least 1 decade
Necessary Crypto Conditions:
1. Honest founders
2. Competent technical co-founders
3. Fair or non-existent pre-mine
4. Solid marketing and PR
5. Legitimate use-cases / adoption
Default Robot Settings:
Contribution (USD): $10,000
Frequency (Months): 12
*Robot buys $10,000 worth of ETF, Stock, Crypto, regardless of the market price, every 12 months since its founding time.*
*Equity curve can be seen from the bottom panel*
Risk Warning:
This strategy is low-risk, however it assumes you have a long time horizon of at least 5 to 10 years. The longer your holding-period, the better your returns. The only thing the user has to keep-in-mind are the macro-economic conditions as stated above. If unsure, please stick to ETFs rather than buying individual stocks or cryptocurrencies.


