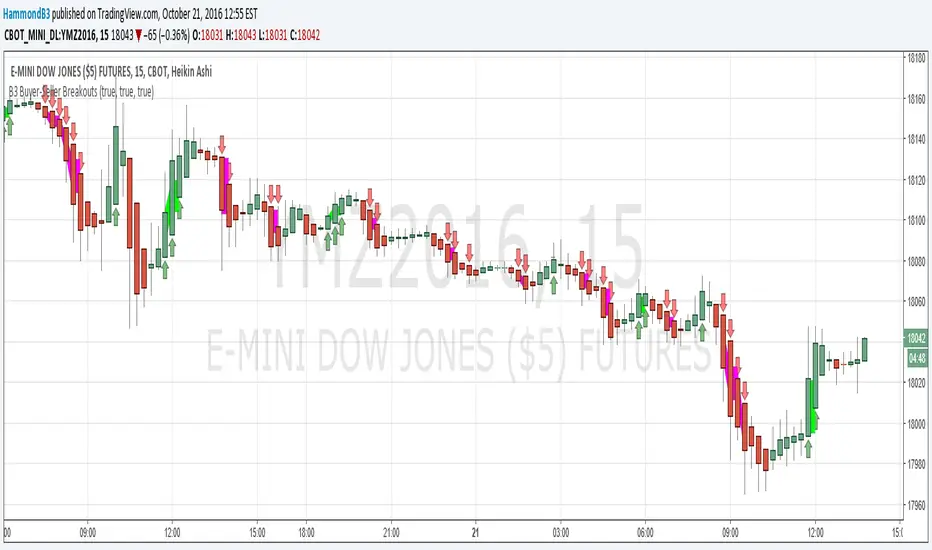
B3 Buyer-Seller BreakoutsB3 Buyer-Seller Breakouts = If a bar is showing that it is moving in a direction with highs lows and close, all of which are >respectively< moving against the open from the bar before, then it prints indicating buyers or sellers bringing momentum. The arrows and cloud carry into the next bar to give lots of awareness of the micro-term momentum. The cloud represents the better price range from which to add to a position.
This study repaints within the bar, most of my indicators do not, but this one is about timing to get an edge on adding to your already in play position, becoming part of the needed momentum to hit profit targets faster. Also, this theory helps you add to winners, and if you never add to losers, you now have statistical odds in your favor. I got the idea for the study reading about turtle trader method and how that statistical edge is really why it works, always adding on every breakout. Keep in mind that I never buy or sell breakouts to initiate trades, only to scale in.
~Cheers!~ ~B3
BARS
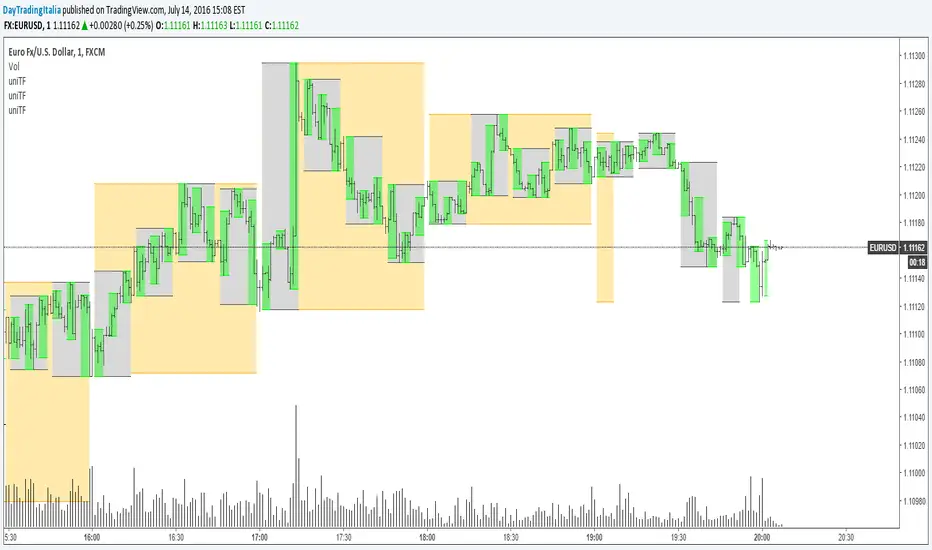
Universal Time Frame v1.1Now it should work better but is only for intraday charts. There are some other glitches though; I'll try to fix them as soon as possible.
Williams Squat BarsSquat bars are a battle of the bulls and the bears, with lots of buying and selling but little price movement.
A squat bar will be one of the top three OR bottom three bars 85% of the time at the end of a trend.
While all trends end with a squat, all squats are NOT the end of a trend.

Dunnigan Bars This displays "Dunnigan Bars," which is defined as:
Higher High and High Low = Green Color
Lower High and Lower Low = Red Color
Inside Bar = Black Color
Outside Bar = Yellow Color

Custom Indicator Clearly Shows If Bulls or Bears are in Control!The Two Versions of this Indicator I learned from Two Famous and Highly Successful Traders. This Indicator shows With No Lag Clear Up and Down Trends in Market by Documenting Clearly If Bulls or Bears are in Control. The Version In SubChart 1 Shows Consecutive Closes if the Current Close is Greater than of Less than the Midpoint of the Previous Bar (Why Midpoint Explained in Detail in 1st Post). The Version in SubChart 2 Shows Consecutive Closes that are Greater than or Less Than the Previous Close (Will Discuss Specific Uses in 1st Post). Works on Stocks, Forex, Futures, on All Timeframes.
