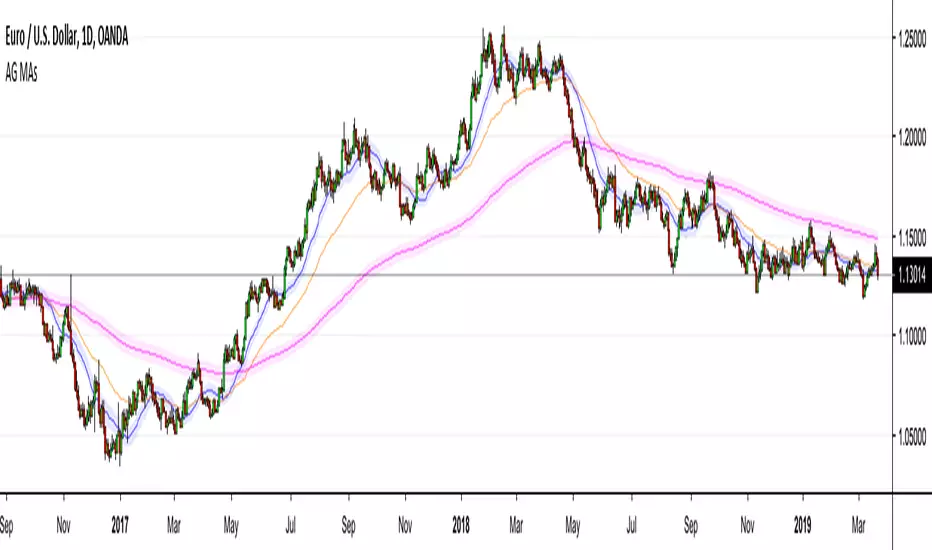
AG Moving Averages w/ BandsThis is an indicator that we built from a few simple ideas: display more than one Moving Average, display the Moving Average "Band" (more below) for each Moving Average, and allowing toggle between SMA/EMA - all in the one indicator.
The Moving Average "Band" is creating using Moving Averages (SMA/EMA) with High and Low as sources. The combination of the MA(Close), MA(High), MA(Low), creates a "Band" for each MA length - which we have found to be very helpful in our Moving Average studies.
The example in the chart above is EURUSD with 20SMA (with Bands), 55EMA (without Bands), 200EMA (with Bands). As you can see, the Bands do a better job than MAs alone for capturing price movement and acting as larger dynamic Support/Resistance zones.
Everything in this indicator is fully customizable, from which MAs to show, to those MA lengths, whether to use SMA/EMA for each individual MA, and whether to display the MA "Band" for each individual MA.
We hope you find it as useful as we have!
Bands
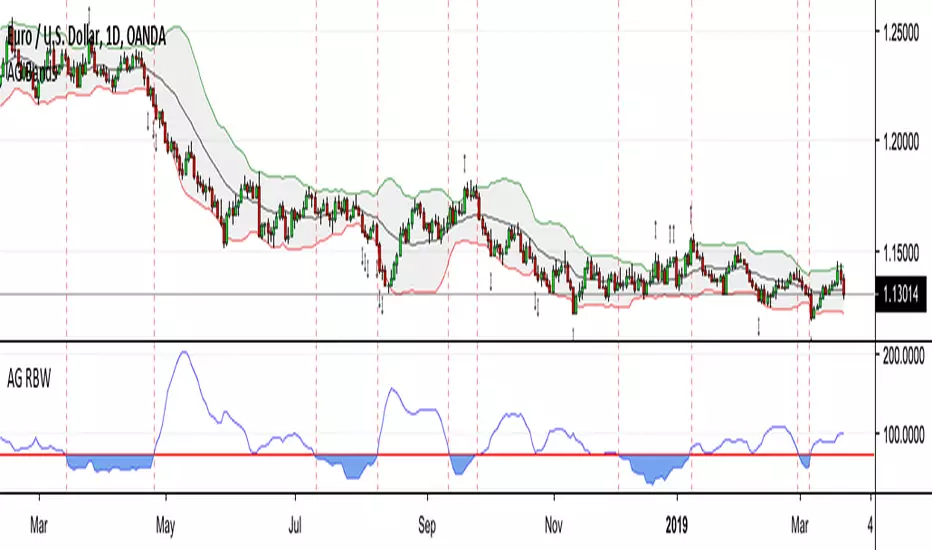
AG Relative BandWidthThis is an indicator that we've been using for a while, very useful for identifying when the market is in a low volatility state. We use the bandwidth of the Bollinger Bands as a proxy for this, but we do something different - we ask the question of "relative to what?".
Whereas typical Bollinger BandWidth indicators give values only applicable for that particular asset, the normalised nature of our Relative BandWidth indicator means that it works and be inferred the same across all assets and timeframes. A really handy tool!
"After periods of low volatility come periods of high volatility" is a well-known theory, and this indicator helps to quickly and easily identify when markets are in low volatility states. Another name for the information our indicator shows is known as the "Bollinger squeeze". Trading breakouts of this squeeze in Bands can be a profitable strategy, given one can filter the false breakouts adequately.
I have shown examples of when the indicator was showing low volatility, take note of what the price action and the width of the Bollinger Bands are doing.
Every parameter is editable, so feel free to play around with the settings. The default settings are what we have used for a long time and have worked well.


Motion To Attraction ChannelsIntroduction
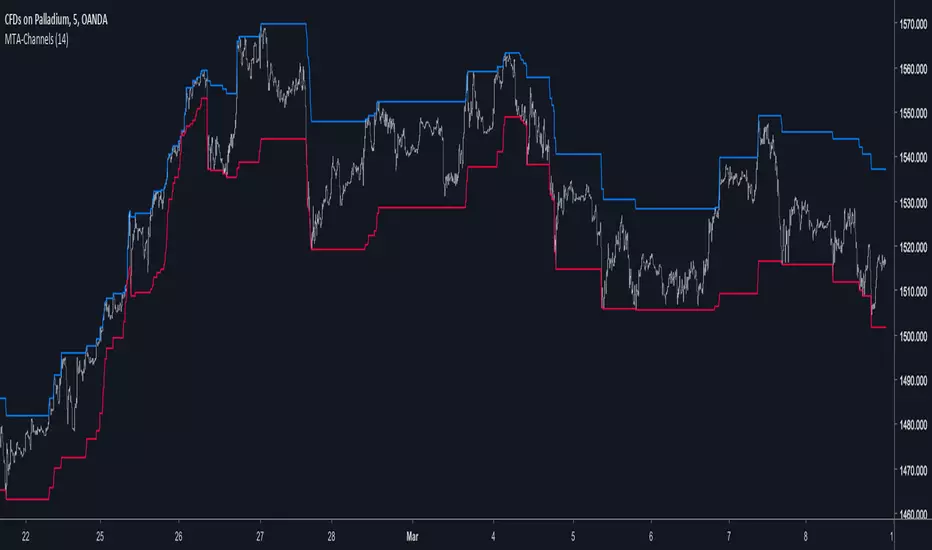
Channels are used a lot on technical-analysis, however most of the them rely on adding/subtracting a volatility indicator to a central tendency indicator, sometimes the central tendency indicator can even be replaced by pure price. A great channel who does not rely on this kind of architecture is the Donchian channels or the quartiles bands. Here i propose a channel similar to the one made by Richard Donchian with some additional abilities.
The Channels
In my indicator, Motion To Attraction mean that the movement of an object a attract an object b , but we can resume this approach by saying that the longer a trend period is, the smaller the distance between each channels, for example if the price create a new highest then the lowest will move toward this new highest, each time coming closer. The philosophy behind this is that the longer a trend is the more probable it is that she will end.
The code reflect it this way :
here the parameter controlling the channel A (upper)
c = change(b) ? nz(c ) + alpha : change(a) ? 0 : nz(c )
this is traduced by : if channel b move then the parameter c become greater, if channel a move then reset the parameter , the parameter d do the same.
c is used to move the channel A, when c < 1 A is closer to the highest, when c = 1 A is in a central tendency point, when c > 1 A is closer to the lowest.
Slaving the Movement
It is possible to have a better control over the channels, this is done by making c and d always equal or lower than 1. Of course it could be another max value selected by the user.
In order to do that add c1 and d1 as parameter with c1 = c > 1 ? 1 : c , same with d1 but replace c by d.
Its safer to do this but i prefer how the channels act the other way, i will consider implementing this option in the future.
Conclusion
This channel indicator does not rely on past data thanks to recursion. The alpha variable at the start can also be adaptive, this let you make the channels adaptive even if such idea can add non desired results. Low length values can create effects where the lower channel can be greater than the higher one, this can be fixed directly in the code or using the method highlighted in the Slaving the Movement part.
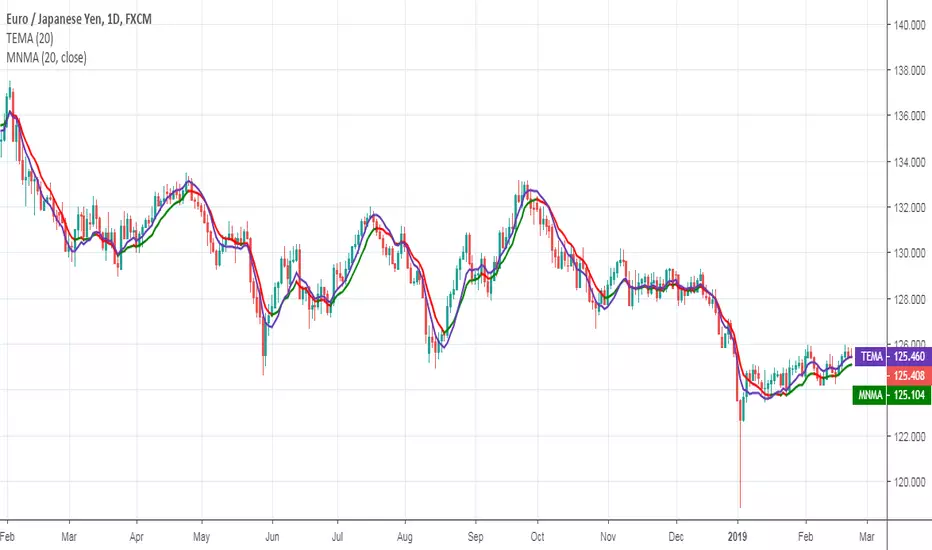
McNicholl Moving AverageThis type of moving average was originally developed by Dennis McNicholl (Futures Magazine, (October, 1998): "Better Bollinger Bands"). A kind of TEMA. He used it as a centerline of the new bands, called Better Bollinger Bands or DEnvelope. The Better Bollinger Bands is a modification of the well-known Bollinger Bands that has a better response for changes in volatility.
Filtered/Unfiltered Linear Regression BandsOptionally filtered linear regression bands/channel. Unfiltered : low lag.
Trend, support/resistance, overbought/sold and all that jazz....

RSI ATR ChannelDraws a channel based on ATR (Average True Range) and RSI. Detects band touches and colors the background appropriately.

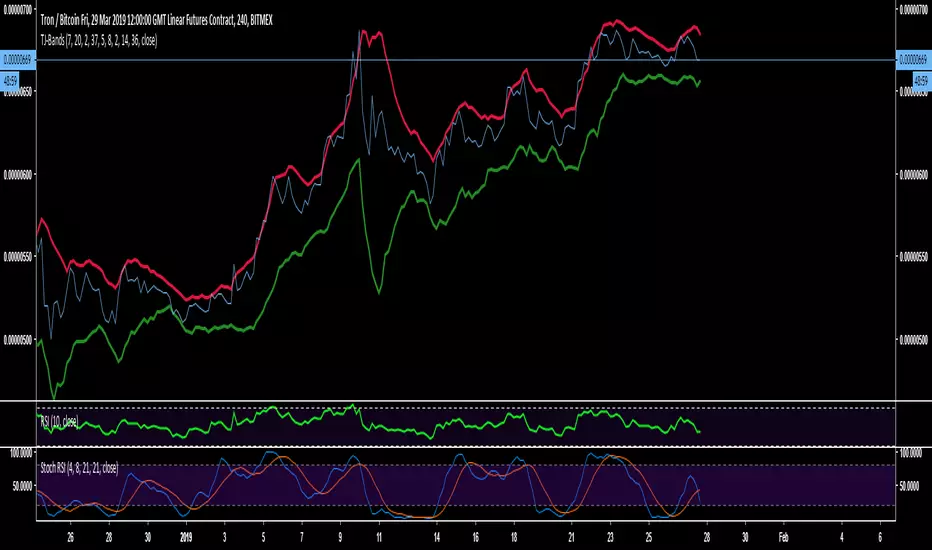
TJ-BandsDo you want to know
This indicator is a modified form of Bollinger Bands.
It works in a similar way like BB does. If you take a look at the "line" chart, you will clearly see, that a close outside these bands is very unlikely and works very well as a rejection line for the chart.
Since, the chart is likely to get rejected at the bands those have been indicated red at the top and green at the bottom.
The use is very simple, add it to your chart and there is nothing more to modify or change.
Like and Follow me and you will find this page interesting because I am a TA expert and professional day trader in crypto since 2012 that does daily updates and new posts about the hottest and most discussed coins.
Cheers, TJ
Shark K-Bands — SharkCIAInspired by everget's implementation of Kirshenbaum Bands.
This indicator was originally developed by Paul Kirshenbaum, a mathematician with a Ph .D. in economics from New York University.
It uses the standard error of linear regression lines of the closing price to determine band width. This has the effect of measuring volatility around the current trend, rather than measuring volatility for changes in trend.
Prior art:
Check out everget's scripts here: www.tradingview.com

Kirshenbaum BandsThis indicator was originally developed by Paul Kirshenbaum, a mathematician with a Ph.D. in economics from New York University.
It uses the standard error of linear regression lines of the closing price to determine band width. This has the effect of measuring volatility around the current trend, rather than measuring volatility for changes in trend.
Good luck!

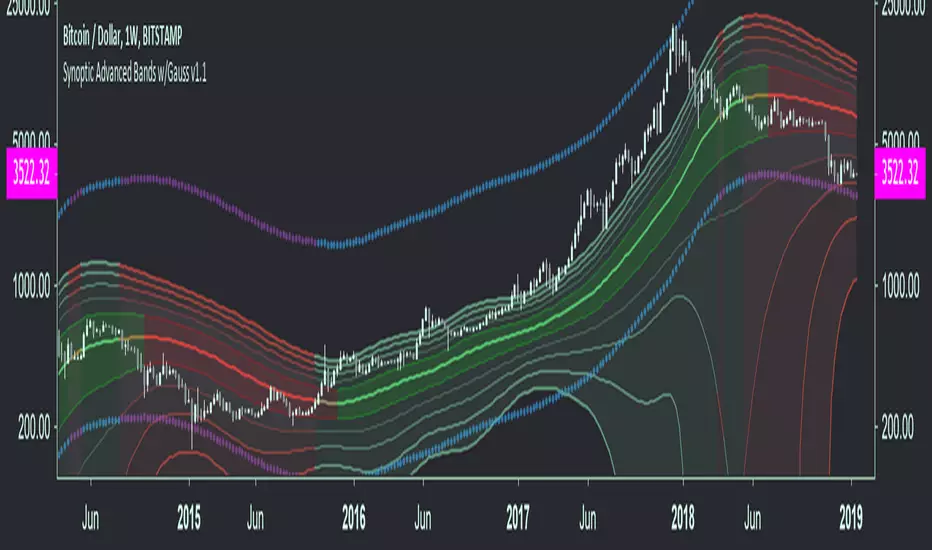
Synoptic Advanced Bands w/GaussAdvanced 9 value band engine with Gaussian option. Includes ALMA, DEMA, EMA, Gauss, HMA, KAMA, LSMA, RMA, SMA, SMMA, TEMA, VWMA, WMA as options for the band engine.
Features:
Three color themes built in, switch between them with a drop down box in the inputs tab, customize them on the style tab.
Change source, length for band engine.
Five band modes, including Bollinger Mode, Custom Mode, Fibonacci Mode, Gaussian Mode, and Normal Mode.
Factor setting for normal (equidistant) and compounding in band calculation.
Offset option
Gaussian core can be shown at all times, even when using a non-Gaussian band engine, and includes reduced lag, and fast response mode, as well as the option to adjust the core multiplier and poles for the Gaussian calculations.
Bollinger settings can be locked to the band settings or set independently for standard deviation.
All custom settings for ALMA, KAMA, LSMA, DEMA, TEMA available including some new ones.
Custom alerts can be set within the inputs tab, then activated through the regular alerts dialog.
40 programmable presets for band settings.
Over 1000 configurations possible for the main settings, many many more if counting minor adjustments.
Great for support/resistance, predicting major moves, trend change/direction, targets, assessing volatility etc.
Access available, please message for more info. If you already have access and need help with configuration, or have a bug to report please get in touch with me.
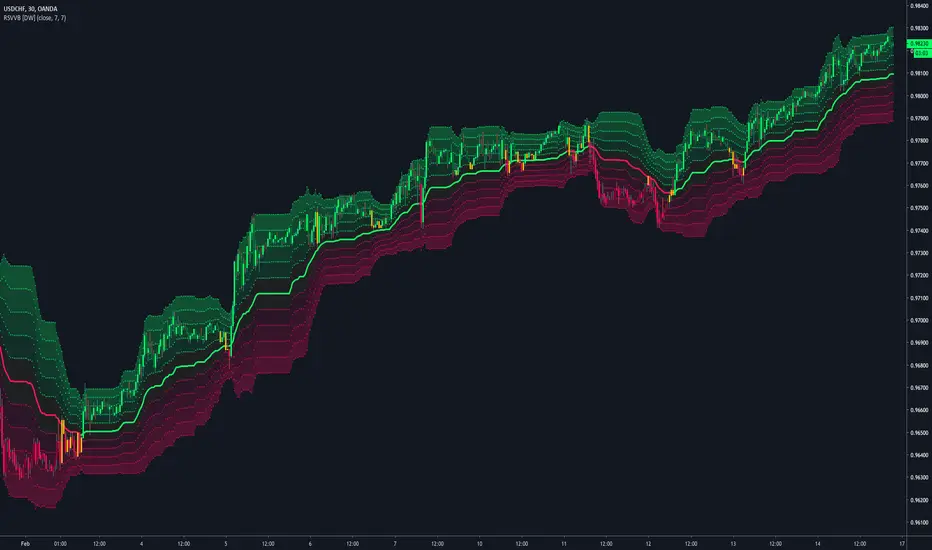
Relative Strength Volatility Variable Bands [DW]This is an experimental adaptive trend following study inspired by Giorgos Siligardos's Reverse Engineering RSI and Tushar S. Chande's Variable Moving Average.
In this study, reverse engineered RSI levels are calculated and used to generate a volatility index for VMA calculation.
First, price levels are calculated for when RSI will equal 70 and 30. The difference between the levels is taken and normalized to create the volatility index.
Next, an initial VMA is calculated using the created volatility index. The moving average is an exponential calculation that adjusts the sampling length as volatility changes.
Then, upper and lower VMAs are calculated by taking a VMA of prices above and below the initial VMA. The midline is produced by taking the median of the upper and lower VMAs.
Lastly, the band levels are calculated by multiplying the distance from the midline to the upper and lower VMAs by 1, 2, 3, 4, and 5.
Bar colors are included. They're based on the midline trend and price action relative to the upper and lower VMAs.
Bollinger Bands MTF [LonesomeTheBlue]With this script you can follow Bollinger Bands for current and higher time frame together. Higher time frame is calculated by script.
if current period
1m => higher period=5m
3m => higher period=5m
5m => higher period=15m
15m => higher period=1h
30m => higher period=1h
45m => higher period=1h
1h => higher period=4h
2h => higher period=4h
3h => higher period=4h
4h => higher period=1day
1day => higher period=1week

HLC Banded Quadratic RegressionHigh/Low/Close Banded Quadratic Regression is now available through this implementation, free for all to use. It's simple purpose is to plot multiple independent parabolic curvatures using a matrix equation that best fits the non-linear data sets of high, low, and close. Features include an available dark background disabled by default for the overlay chart, adjustable regression period, and a banding lines width adjustment. If you have any comments regarding this indicator, I will consider your thoughts and ideas presented below.

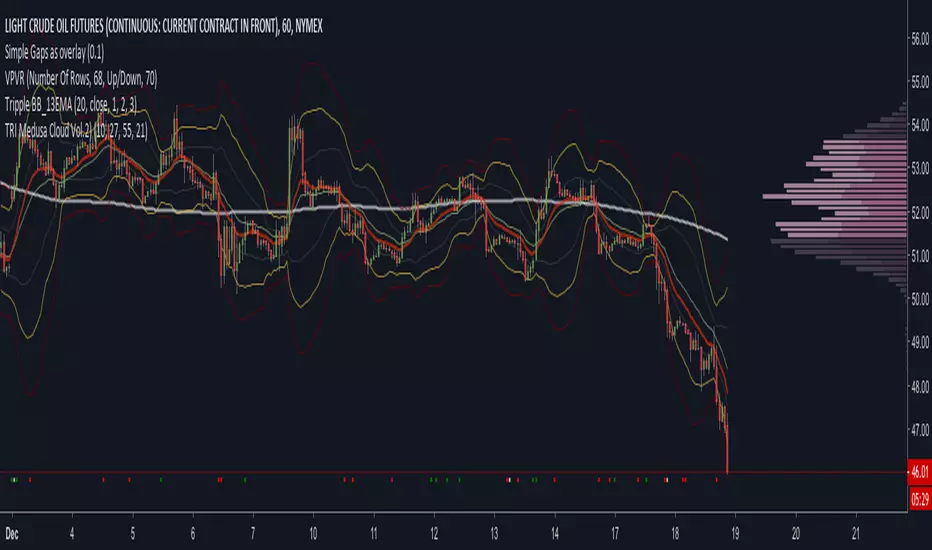
Tripple BB_13EMAHere is a script to use 3 types of Bollinger Bands.
It is like three resistances or ranges in wich the Chart generally likes to move. A 1, 2 and 3 Width BB. The Chart moves 90% between the yellow one.
As support for my study i use the 13 EMA. is the Chart over the 13 EMA and under the Yellow (2) BB the trend is bullish. Is t under the 13 EMA and over the Yellow BB the trend used to be bearish.
The opener the BB are the more Volatilaty and the more likely the Chart will not bounce against the Bands. It will more get stick to the yellow or red one (if it is between them it is a trend too) and will follow up or downwards.
Check it out

DYNAMIC SUP/RES 3.0Dynamic Support/Resistance 3.0
Features:
4x EMA
2x SMA
Horizontal support/resistance plot
Moving average support/resistance plot
Long/short signals + alerts
Close signals + alerts
Take profit signals + alerts
CryptoMedics Algorithmic Trading BandsCryptoMedics are happy to announce the release of our new Algorithmic trading bands!
The Bands can be used as dynamic support and resistance levels. Anything from scalping on the 1m chart to swing trading on the daily. The opportunities are endless.
Developed using tried and tested methods that hedge funds from wallstreet to smart individual traders have used for years now. Now all available to you.
Here is an example of scalping with it on the 3m chart on BCHZ18. If you would've used 10x leverage you would've made a total of 760%!
Examples:
Another example on XBTUSD using the bands to catch a swing trade
These results are undeniably good and I bet you can't find similar ones with any other indicator!

CryptoMedics Algorithmic Trading Bands CryptoMedics are happy to announce the release of our new Algorithmic trading bands!
The Bands are used as dynamic moving support and resistance levels and can be used for anything from scalping on low timeframes to swing trading larger moves.
An example of this would be if a coin pumped 20% and you're expecting it to go up more you wait for it to return to either the upper middle or one of the core bands and long it there.
The amount of usecases for this indicator is endless.
Developed using tried and proven methods that everyone from private individuals to wallstreet hedge funds have used. Now available to CryptoMedics subscribers.
The indicator works across any assets since it isn't based on any pair-specific data but rather more broad data that exists on all trading pairs.

ATR Entries & Stop Loss [Jigga]This is a simple script that displays multiples of ATR and shows you where the potential zones for longing and shorting are. The majority of people use ATR as a stop loss, so we can use it for our advantage and get in when they are stopped out. There is also a possibility to add a stop loss, so a trader can lose little when he is wrong and maximize profit when he is right. It works the best in ranging markets.
Do not forget to always use a proper stop loss and risk management.
Here you can see it in action:
BTC - BitMex - Range bound market

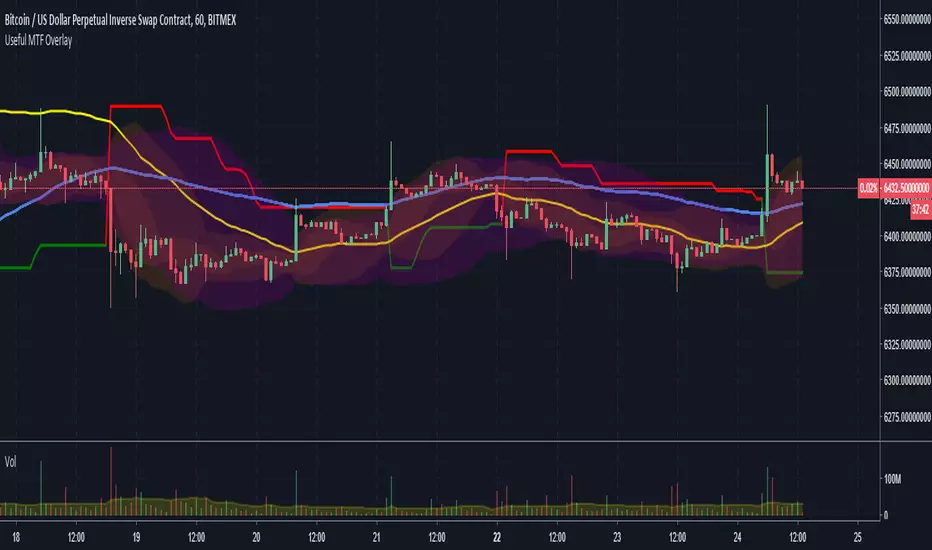
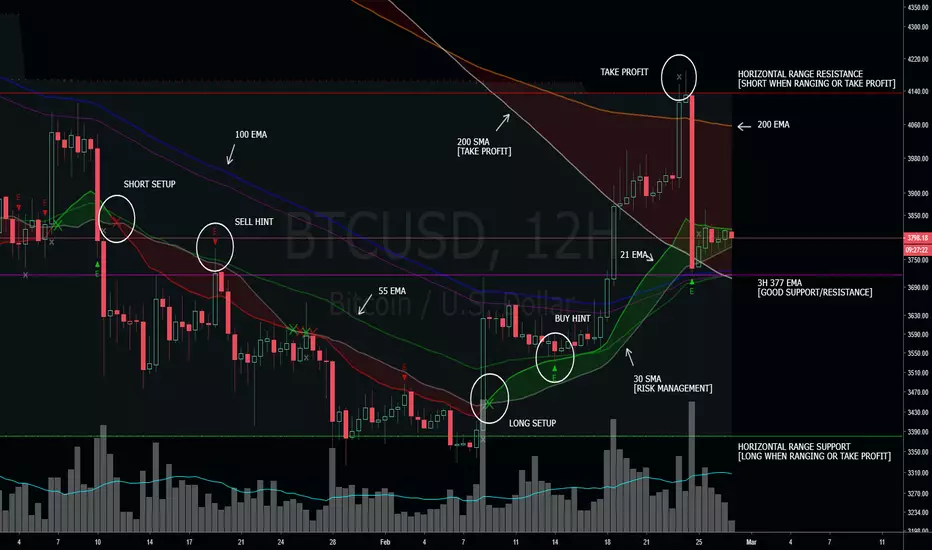
MTF Bollinger Bands, SuperTrend, TEMA Wave and ATR Stop LossThis script is a combination of useful overlay indicators that can be used for day trading or swing trading. You can use it for long term positions as well, but some tweaking may be required. I also added the multi time frame possibility for the majority of settings. This indicator gives you a lot of opportunities and trade setups. Default settings are made for day trading, using intraday time frames.
This script can display the following:
4 independent Bollinger Bands (MTF)
4 independent SuperTrends (MTF)
6 independent TEMAs (MTF)
ATR Stop loss for longs / shorts
Default settings display 3 Bollinger Bands, 2 TEMAs(I have found these two TEMAs particullarly useful, see screenshots below) and a signle SuperTrend.
Do not forget to always use a proper stop loss and risk management.
Here you can see the script in action in different markets:
BTC - BitMex - Setup before the drop from 7400 USD
BTC - BitMex - Setup before the drop from 8400 USD
BTC - BitMex - Setup before the pump to 7800 USD
BTC - BitMex - Setup before the pump to 6800 USD