TDZZ ETH 15min Vault: No-Loss Martin Gale StrategyStrategy Overview
The ETH 15min Vault is an enhanced, high-frequency Martin Gale strategy designed specifically for Ethereum on the 15-minute chart. Its core innovation lies in integrating pre-calculated margin management with a multi-layer exit system, transforming the traditional high-risk Martingale approach into a controlled, calculated growth engine. The strategy aims for sustainable compound growth of small capitals (e.g., 1000U) in ranging markets while systematically eliminating the risk of account blow-up.
Core Concept: The "No-Loss" Guarantee
Unlike conventional Martingale systems that risk infinite losses, this strategy pre-calculates and logically reserves the total margin required for all potential layers (configurable, e.g., up to 30) at the initial entry. This ensures sufficient capital is always available for the next averaging order, preventing liquidation due to margin shortage. Combined with intelligent, proactive take-profit and safety-net closures, it creates a theoretically "No-Loss" framework for the Martin Gale method.
Key Mechanisms
1、Smart Position Averaging:
Averaging distances expand geometrically (configurable multiplier), preventing rapid layer depletion during sharp drops.
Averaging order size increases progressively (configurable multiplier) to effectively lower the break-even point.
2、Dynamic Multi-Stage Exit Logic:
Rebound TP: Partially closes a position when price rebounds a certain percentage from its entry, locking in profits early during oscillations.
Cycle TP: Closes the remaining position upon reaching the primary profit target, which is dynamically recalculated after each average to reflect the new aggregate cost.
Safety-Net Close (Defense Mode): Activates after a defined number of averages. Triggers a full exit if price: a) rallies significantly from the lowest point, b) retraces from a recent high, or c) fails to make a new low within a set time. This forms the final protective layer for capital preservation.
Main Advantages
✅ True Risk Isolation: Transforms Martingale's "unlimited risk" into a "defined and manageable drawdown" via pre-calculated margins and safety-net exits.
✅ Active Profit Capture: The "Rebound TP" mechanism increases win rate and capital efficiency in ranging markets.
✅ Adaptive to Volatility: Adjustable parameters for averaging distance and size allow tuning for different market conditions.
✅ High-Frequency Compounding Potential: Operates on the 15-min timeframe, offering numerous opportunities to complete profit cycles in consolidating phases.
Configuration & Parameters
Key adjustable inputs include: Initial Capital %, Averaging Distance % and Multiplier, Order Size Multiplier, Max Layers, Take-Profit %, Rebound Close %, and all Defense Mode thresholds.
This strategy significantly reduces liquidation risk through its design but does not eliminate trading risk. Substantial drawdowns can occur during strong, sustained trends. "No-Loss" refers to prevention of margin-call liquidation, not guaranteed profitability. Always conduct thorough backtesting and forward testing in a simulated environment before committing real capital. Past performance is not indicative of future results. Trade responsibly.
Averaging

Liquitive Buy/Sell Dollar AveragerLiquitive Buy/Sell Dollar Averager Indicator
The "Liquitive Buy/Sell Dollar Averager" is a versatile trading tool designed for intraday and multi-timeframe analysis, combining advanced range-bound calculations, RSI normalization, volume spikes, and candle pattern recognition to identify optimal buy and sell conditions. This indicator is particularly suitable for traders employing strategies that focus on dollar-cost averaging, position scaling, and systematic buy/sell decision-making.
Key Features:
Adaptive RSI-Based Levels:
Dynamically calculates inner bounds (IB) and outer bounds (OB) using RSI and price ranges, helping to identify overbought and oversold conditions relative to the price action.
Normalizes RSI values to the price range for seamless visualization overlaid on the chart.
Volume and Candle Analysis:
Detects significant volume spikes relative to a moving average, signaling increased market activity.
Identifies spiking green/red candles to capture momentum-driven price movements.
Dynamic Support and Resistance:
Calculates and plots support and resistance levels based on recent swing highs and lows.
Median and boundary lines help visualize key price levels for decision-making.
Profitability Check:
Buy and Sell Signals:
Checks profitability thresholds based on percentage gains/losses.
Incorporates logic for "time to buy" and "time to sell" using target profit margins.
Implements average move percentage to define realistic thresholds for buy/sell actions.
Time-Based Trading Restrictions:
Configures trading logic to disallow trades after a specific time (e.g., 3:40 PM for intraday sessions).
Ensures logical entry and exit decisions are only made within active trading hours.
Color-Coded Visualization:
Background colors dynamically shift between green (bullish), red (bearish), and neutral, depending on RSI and price position relative to the inner bounds.
Opacity of the background adjusts based on normalized RSI differences to provide a visual cue of market strength.
Customizable Parameters:
Allows user input for key settings like lookback periods, RSI length, percent ranges, volume thresholds, and transparency levels, enabling flexible configuration tailored to individual strategies.
Actionable Alerts and Signals:
Plots "Open Position", "Add to Position", and "Close Position" markers directly on the chart, making it easy to follow systematic trading rules.
How It Works:
Buy Signals:
Triggered when price conditions, volume spikes, and RSI-based thresholds align with profitability metrics.
Designed for dollar-cost averaging, identifying opportunities to add to long positions or open new positions.
Sell Signals:
Evaluates profitability conditions to identify when to close or scale out of positions.
Incorporates real-time evaluation of market momentum and profitability.

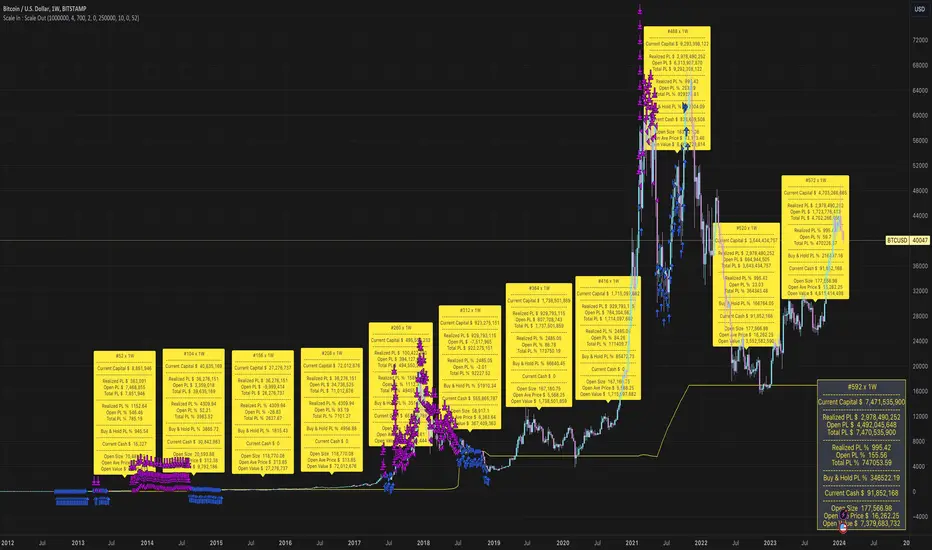
Scale In : Scale OutScale In : Scale Out strategy is an adaptation and extension of dollar-cost-averaging.
As the name implies it not only scales in - allocates a given percentage of available capital to buy at each bar - it also scales out - sells a given percentage of holdings at each bar when a target profit level is reached.
The strategy can potentially mitigate risks associated with market timing.
Although dollar-cost-averaging is often recommended as a strategy for building a position, the management of taking and retaining profits is not often addressed. This strategy demonstrates the potential benefits of managing both the building and (full or partial) liquidation of an investment.
We do not provide any mechanism for managing stop losses. We assume a scale in/out strategy will typically be applied to investing in assets with a high conviction thesis based on criteria external to the strategy. If the strategy does not perform, then the thesis may need to be re-evaluated, and the position liquidated. Even in this case, scaling out should still be considered.
Average purchase price 0.1 [PATREND]
Average purchase price
This tool calculates the average purchase and sell price and the profit/loss ratio for the selected symbol based on the user's inputs for the purchase and sell prices and the entry and exit amounts.
Using Average purchase price with DCA strategy
This tool can be used to track the performance of your dollar cost averaging (DCA) investment strategy.
This tool allows you to enter information about your purchase and sell transactions, such as the purchase and sell price and the entry and exit amount, and it calculates the average purchase and sell price and the profit/loss ratio based on this information.
When using a DCA strategy, you can enter information about your regular purchase and sell transactions and the tool will calculate the average purchase and sell price for you.
You can use this information to determine if your strategy is working well and make the necessary adjustments.
In addition, this tool can help you determine when you should increase or decrease the regular investment amounts that you make as part of your DCA strategy.
It can also show you the profit/loss ratio for each sell transaction that you made.
_________________________________
We hope you find it useful.
Don't hesitate to try this tool and customize its settings to meet your trading needs.
We look forward to seeing your opinions and comments.
______________________________________________________________________________________________________
Average purchase price
هذه الأداة تحسب متوسط سعر الشراء والبيع ونسبة الربح / الخسارة للرمز المحدد بناءً على إدخالات المستخدم لأسعار الشراء والبيع ومبالغ الدخول والخروج.
استخدام Average purchase price مع استراتيجية DCA
يمكن استخدام هذه الأداة لتتبع أداء استراتيجية الاستثمار المتوسط التكلفة الدولارية (DCA) الخاصة بك.
تتيح لك هذه الأداة إدخال معلومات عن عمليات الشراء والبيع الخاصة بك، مثل سعر الشراء والبيع وكمية الدخول والخروج، ويقوم بحساب متوسط سعر الشراء والبيع ونسبة الربح / الخسارة بناءً على هذه المعلومات.
عند استخدام استراتيجية DCA، يمكنك إدخال معلومات عن عمليات الشراء والبيع المنتظمة التي تقوم بها وستقوم الأداة بحساب متوسط سعر الشراء والبيع لك. يمكنك استخدام هذه المعلومات لتحديد ما إذا كانت استراتيجيتك تعمل بشكل جيد وإجراء التعديلات اللازمة.
بالإضافة إلى ذلك
يمكن لهذه الأداة مساعدتك في تحديد متى يجب عليك زيادة أو تقليل مبالغ الاستثمار المنتظمة التي تقوم بها كجزء من استراتيجية DCA. كما يمكنها أن تظهر لك نسبة الربح / الخسارة في كل عملية بيع قمت بها.
تصرف كخبير ترجمه مختص باسواق المال وترجم هذا النص للغه الانكليزيه بشكل دقيق
_________________________________
نأمل أن تجدوه مفيدًا لكم .
لا تترددوا في تجربة هذه الأداة وتخصيص إعداداتها لتلبية احتياجاتكم التداولية.
نتطلع إلى رؤية آرائكم وتعليقاتكم .

Average Price LineThis was published in substitute of the original AVG price line that was already implemented into TradingVIew.
Get the average price in the desired range you want.

Up & Down Trend Trading Strategy - BNB/USDT 15minThis strategy will focus on up trend trading and down trend trading based on several indicators such as;
for up trend
1. SAR indicator
2. Super trend indicator
3. Simple moving average for the period of 100
down trend
1. RSI Indicator
2. Money flow index
3. Relative volatility index
4. Balance of powder

Risk indicator 50DSMA/50WSMAIndicates buy and sell zones, intended to be used along with your scaling-in scaling-out strategy.
Example: sell 20% of holdings in first sell zone, sell another 20% in the second zone, etc.

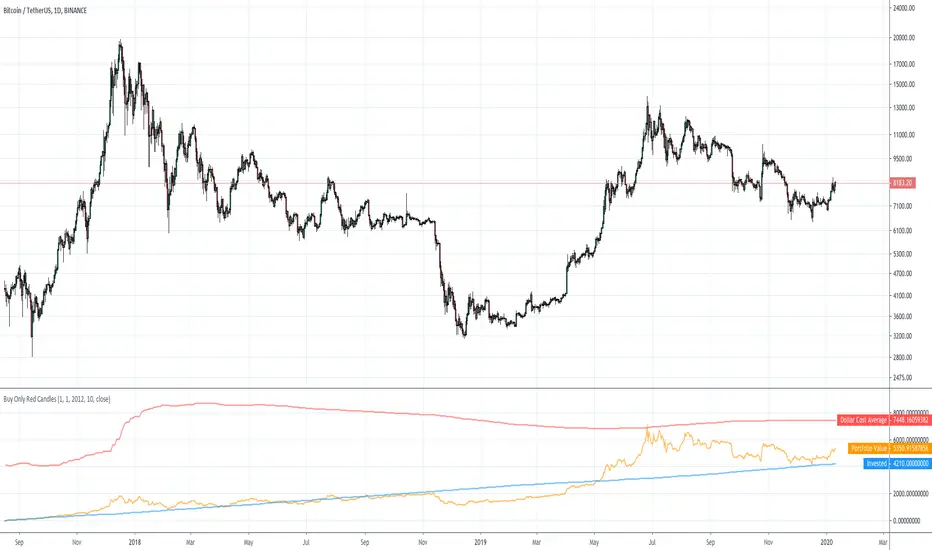
Dollar Cost Averaging Only Red CandlesThis just shows you the results if, for example, you bought the closing price each day that formed a red candle.
Works on other timeframes than daily.
In the options you can set your own start date, as well as the dollar amount to spend on each buy.
Displays your dollar cost average, total invested, and total portfolio value over time.
Average DownThis strategy has been published for a Pyramiding tutorial on the Backtest Rookies website.
For a full overview of the code and an introduction to Pyramiding check out our site.
Summary
The code example will create a simple script that allows us to average down whenever our portfolio is down x%. The idea will be to bring our average cost down so that we can still exit with a profit when conditions improve. With this in mind, the strategy shall also have a simple take profit exit at x% above our average price.
Inputs
Target Loss to Average Down (%) : This is the target percentage level will trigger us to average down. In other words, if we have a close below this level from our average buying price, we will average down.
Target Take Profit : A standard take profit percentage level. Use this to set how much profit you will target.
% Of Current Holdings to Buy : Is the number of shares/contracts we will aim to buy when we average down. 50 will mean we buy 50% of our current holdings. So if we have 100 shares, then we buy 50 when we average down.
SMA Period : Defines our SMA lookback period. Our strategy will enter the first/initial position when we have a close above our SMA level.
