Chaos Volatility Breakout (ATR + Breakout)-VMThis indicator is a volatility-based breakout trading tool inspired by principles from Chaos Theory, where small changes in momentum during high-energy market conditions can lead to large price movements.
Instead of predicting the market, it focuses on identifying “high-probability expansion zones”—moments when the market is under stress (high volatility) and price is breaking out of a recent range.
Média de Amplitude de Variação (ATR)

Pure xATR ProUncover the hidden rhythm of the market with Pure xATR Pro. This indicator is designed for serious traders who need to understand "Price Extension". It calculates the precise distance between the price and the baseline Moving Average (MA) relative to market volatility (ATR). Instead of guessing top and bottom, visualize exactly where the price stands in the cycle—from extreme panic selling to euphoric profit-taking.
Key Features:
4-Stage Market Zoning System:
Panic Zone (Oversold): Identifies extreme price drops (statistically rare deviations). Often presents high-reward mean reversion opportunities.
Buy Zone (Entry): The sweet spot for trend initiation.
Hold / Winner Zone: Detects strong momentum. Keeps you in the trade while the trend is healthy (Ride the trend).
Profit Taking Zone (Overbought): signals when the price is statistically overextended and liable to pullback.
Adaptive Volatility Logic:
Includes a dynamic algorithm that analyzes historical volatility (Lookback Period) to automatically adjust Overbought/Oversold percentiles, adapting to changing market conditions.
Professional Dashboard:
Real-time Status: Displays current Zone, Volatility State (Breakout/Normal), and Actionable Advice.
Risk Management: Auto-calculates Dynamic Stop Loss (based on Supertrend, ATR, or MA) and Fixed % Risk.
Multi-Level Targets: Automatically projects 3 profit targets (TP) based on ATR multiples.
Clean & Customizable Visuals:
Smart Highlighting: Background colors automatically highlight key zones (Panic/Buy/Hold/Profit).
Style Control: Full color customization available directly in the "Style" tab for a clutter-free input menu.
------------------
ค้นพบจังหวะที่แท้จริงของตลาดด้วย Pure xATR Pro อินดิเคเตอร์ระดับมืออาชีพที่ออกแบบมาเพื่อวิเคราะห์ "ระยะการยืดตัวของราคา" (Price Extension) โดยคำนวณระยะห่างระหว่างราคากับเส้นค่าเฉลี่ย (MA) เทียบกับความผันผวน (ATR) ช่วยให้คุณเห็นภาพชัดเจนว่าราคา ณ ปัจจุบันอยู่ในสถานะใด ตั้งแต่จุดที่คนเทขายด้วยความตกใจ (Panic) ไปจนถึงจุดที่ราคาแพงเกินไปและควรขายทำกำไร
ฟีเจอร์หลัก (Key Features):
ระบบแบ่งโซนตลาด 4 ระดับ (4-Stage Zoning):
Panic Zone (โซนของถูก/Oversold): จับจังหวะที่ราคาดิ่งลงแรงผิดปกติ ซึ่งมักเป็นจุดกลับตัวที่ให้ผลตอบแทนสูง (High Reward)
Buy Zone (โซนสะสม): จุดเริ่มต้นของเทรนด์ เป็นระยะปลอดภัยในการเข้าออเดอร์
Hold / Winner Zone (โซนรันเทรนด์): แยกแยะช่วงที่เทรนด์แข็งแกร่ง ให้คุณ "ถือสถานะต่อ" (Let Profit Run) ไม่ขายหมู
Profit Taking Zone (โซนขายทำกำไร): แจ้งเตือนเมื่อราคาวิ่งไปไกลเกินค่าเฉลี่ยทางสถิติ (Overextended) เพื่อพิจารณาขาย
ระบบปรับตัวตามความผันผวน (Adaptive Logic):
อัลกอริทึมอัจฉริยะที่คำนวณค่า Percentile ย้อนหลัง เพื่อปรับระดับ Overbought/Oversold ให้เหมาะสมกับสภาวะตลาดที่เปลี่ยนไปโดยอัตโนมัติ
หน้าปัดสถานะครบวงจร (Professional Dashboard):
แสดงสถานะปัจจุบัน (Action), ระดับความผันผวน, และคำแนะนำแบบ Real-time
Risk Management: คำนวณจุด Stop Loss ให้อัตโนมัติ (เลือกสูตรได้: Supertrend, ATR, หรือ MA)
Target Projection: คำนวณเป้าหมายทำกำไร (TP) ให้ล่วงหน้า 3 ระดับตามระยะ ATR
กราฟสะอาดตา ปรับแต่งง่าย (Clean Visuals):
Smart Highlight: ไฮไลท์สีพื้นหลังตามโซนต่างๆ อัตโนมัติ (Panic/Buy/Hold/Profit) ทำให้ดูเทรนด์ง่ายเพียงกวาดตา
Customizable: ปรับแต่งสีและความโปร่งใสได้อิสระผ่านแถบ "Style" เพื่อกราฟที่ดูเป็นระเบียบและไม่รกสายตา

Volatility Radar [upslidedown]💎 Overview
Volatility Radar visualizes extreme volatility conditions in a clean, intuitive oscillator format.
Unlike traditional momentum oscillators, it transforms average true range (ATR) behavior into a directional volatility structure, making it easier to spot moments when markets may be shifting into expansion, compression, or potential pivot zones.
💎 How to Use
The oscillator highlights moments when the internal volatility condition becomes active as well as when that condition breaks. These events may coincide with structural turning points, breakout conditions, or volatility expansions. While not a prediction tool, Volatility Radar helps traders identify moments worth paying closer attention to.
💎 Signal Markers
■ Square icons on top/bottom identify when the Volatility Radar condition is ACTIVE
▲▼ Triangle icons on top/bottom identify when the Volatility Radar condition BREAKS
📌 Chart Example:
💎 Oscillator Trends
One of the core features of Volatility Radar is its ability to highlight positive or negative volatility trends. The oscillator automatically colors its components to reflect uptrending vs. downtrending volatility structure, making trend context easier to interpret at a glance.
📌 Chart Example:
💎 Histogram Trends
For users who prefer a more compact or traditional visual style, Volatility Radar includes an optional histogram display mode. This mode provides a clean representation of the detected trend and can be helpful for validating price-action concepts within the broader volatility context.
📌 Chart Example:
💎 Volatility Moving Average
The yellow moving average line offers a volatility moving average that can aid in determining longer term trend strength.
Interpret the trend direction by observing whether the average is increasing/decreasing or above/below the zero line.
Reversals may be observed when values move into oversold territories.
Trend continuation may occur during periods when the average is near the zero line.
Evaluate opportunities when the moving average is "touched" or "pinged" by the radar line (setting available to highlight these crosses).
📌 Chart Example:
💎 Backtesting Support
Volatility Radar outputs external signals designed for use with automated backtesting on TradingView. It integrates with @jason5480’s open-source Template Trailing Strategy and its supporting signal libraries.

Aydan Scalper v2This indicator, called the Aydan Scalper, combines an 8-period EMA (plotted in green) and a 20-period EMA (plotted in red) to identify buy and sell signals based on their crossovers. When the green 8 EMA crosses above the red 20 EMA from below, it signals a buy opportunity. Conversely, when the green 8 EMA crosses below the red 20 EMA from above, it signals a sell opportunity. Additionally, an ATR (Average True Range) indicator is included to gauge market volatility. This combination helps scalpers make informed trading decisions on a one-minute chart.”

QFT MTF Range DetectorQFT MTF Range Detector — QuantumFlowTrader
Description:
The QFT MTF Range Detector is a multi-timeframe (MTF) tool designed to identify consolidation zones or ranging conditions across multiple intraday timeframes — from 1 minute up to 4 hours. This indicator is optimized for high-frequency trading environments such as scalping and day trading.
How it works:
For each selected timeframe, the indicator evaluates five key technical conditions:
- Low ADX (less than 17) – suggesting weak trend strength.
- Range width within a specific normalized threshold.
- Normalized ATR (volatility filter) in a defined range.
- RSI near the neutral zone (40–60) with low volatility.
- Price proximity to the mid-range (consolidation center).
Each condition contributes a score. If at least 3 out of 5 conditions are met, that timeframe is considered to be in a range (consolidation).
Visual output:
A compact table is displayed on the chart showing all selected timeframes:
Black box = Timeframe is in a range (consolidation).
Purple box = Not in a range (likely trending or volatile).
Timeframes are labeled (e.g., "4H", "15M") for clarity.
Customization:
Choose display corner (top/bottom, left/right).
Enable or disable table borders.
Set custom colors for range and non-range signals.
Use case:
Traders can quickly assess which timeframes are in a range, helping them:
Avoid choppy markets,
Time entries and exits better,
Confirm multi-timeframe alignment.
Note: This is not a buy/sell signal indicator. It is a market condition filter to enhance decision-making.

QuantumFlowTrader V1QuantumFlowTrader V1 — Adaptive Institutional Flow Framework
Overview
QuantumFlowTrader V1 is a precision-built visual tool that fuses institutional structure, dynamic volatility, and balance zones into one unified system.
It is designed to help traders align with the market’s internal flow without relying on lagging indicators or fixed settings.
Core Components
1. Adaptive EMA Clouds — Structural Flow
Layered exponential moving averages adapt to current conditions, clearly showing when market structure is aligned or in transition. Cloud color and intensity adjust automatically to reflect real-time directional bias.
2. Dynamic VWAP + Deviation Zones
Includes a self-adjusting VWAP with optional deviation bands (VWAP Deviation Zones) that reflect institutional fair-value areas — places where price often reacts, pauses, or mean-reverts.
The VWAP line shifts color based on price positioning.
3. Quantum ATR Engine — Multi-Layer Volatility Sync
A proprietary multi-ATR engine detects when volatility signals align in one direction across multiple sensitivities.
Arrows appear only on full directional agreement, signaling high-conviction flow moments.
4. Session Visualization + Arrow Filtering
Background shading highlights key trading sessions (Asia, London, USA).
You can optionally disable arrow signals during specific sessions for a cleaner view.
Features & Alerts
- Toggle EMA Clouds, VWAP, Deviation Zones, and ATR Arrows independently.
- Customize all colors, transparencies, and visual styles.
- Built-in alerts for bullish and bearish arrow signals.
Compatibility
Works on all assets: Forex, Crypto, Stocks, Indices, Futures.
Fully adaptive across all timeframes — intraday to swing.
No optimization needed — smart parameters adjust automatically.
Strategy Alignment Tip
QuantumFlowTrader V1 adapts to any trading strategy and acts as a directional compass for market flow.
It becomes especially powerful when combining multiple timeframes — for example, using the 1H and 15M charts to define trend alignment, and then executing entries on lower timeframes in the direction of that flow.
Note: Entry setups are defined by each trader’s individual system.
This indicator does not provide entry points — it highlights multi-timeframe alignment and directional bias.
To request access, contact via TradingView profile.

CapitalFlowResearch: N-ATRCapitalFlowsResearch: N-ATR — Normalised Volatility Regime Indicator
CapitalFlowsResearch: N-ATR transforms ATR into a normalised, directional volatility signal that oscillates within a fixed range. Instead of treating ATR as an absolute number—which varies widely across assets and market regimes—the tool rescales volatility into a consistent framework, allowing traders to compare conditions across instruments and timeframes without recalibrating settings.
The indicator identifies two core attributes simultaneously:
Volatility level relative to its recent environment
By normalising ATR, the script shows whether current volatility is high or low relative to its own historical context, not in arbitrary terms.
The direction of volatility pressure
A smoothing layer helps determine whether volatility is rising or falling, enabling a four-state volatility map (high → rising, high → falling, low → rising, low → falling).
These states are displayed via subtle background shading, giving a clear view of shifts in volatility regime without cluttering the chart.
A color-coded line plots the smoothed volatility signal itself, making transitions easy to spot and track over time.
Together, these features turn N-ATR into an effective volatility-regime compass—highlighting periods of compression, expansion, and volatility trend changes that often precede important market behaviour—while preserving the confidentiality of the underlying calculations.

CapitalFlowsResearch: Vol RangesCapitalFlowsResearch: Vol Ranges — Multi-Timeframe ATR Expansion Map
CapitalFlowsResearch: Vol Ranges creates a structured volatility “roadmap” by projecting expected price extensions across multiple timeframes using ATR-based ranges. Instead of relying on a single ATR reading, the tool pulls in higher-timeframe volatility measures—such as daily and monthly expansions—and uses them to build a set of reference levels that anchor the current market against where it should trade under normal volatility conditions.
The script does two things simultaneously:
Projects volatility-derived target bands
It computes a set of upper and lower expansion levels (e.g., +100%, +50%, –50%, –100%) around prior closing levels on different timeframes. These levels act as structural markers for expected movement, allowing traders to quickly recognise when price is behaving within typical bounds or pressing into statistically stretched territory.
Displays a live dashboard for interpretation
A fully configurable on-chart table displays:
Recent volatility readings
Today's reference ranges
Distance from current price to each expansion level
Whether today's movement is expanding or contracting relative to prior volatility
This gives traders a compact situational summary without cluttering the price chart.
Optional high-timeframe projection lines can also be plotted directly on the chart, updating once per new day or new month, making it easy to visually align intraday price action with broader volatility structure.
In practical terms, Vol Ranges functions as a multi-timeframe volatility compass—highlighting when markets are trading inside normal ranges, when they are beginning to stretch, and when they may be entering conditions supportive of momentum or reversal behaviour. All core mechanics remain abstracted, preserving the proprietary nature of the volatility framework.

Watermark | Bar Time | Average Daily RangeMulti Info Panel & Watermark
Multi Info Panel & Watermark is a utility indicator that displays several pieces of chart information in a single, customizable panel. It is designed to support intraday and swing analysis by making key data—such as symbol details, date, and average daily range—easy to see at a glance, as well as providing simple tools for notes and backtesting.
Features
Watermark / Custom Note
Optional text overlay that can be used as a watermark or personal note.
Can display a strategy name, reminder, or any other user-defined label on the chart.
Ticker Info
Shows information about the currently active symbol on the chart (for example, symbol name and other basic details depending on the inputs).
Helps keep track of which market or pair is being analyzed, especially when using multiple charts.
Current Date
Displays the current date directly on the chart.
Useful for screenshots, journaling, and documenting analysis.
Average Daily Range (ADR)
Calculates the average daily range of the active symbol over a user-defined number of recent days.
Helps visualize how much price typically moves in a day, which can support position sizing, target setting, or volatility awareness within your own trading approach.
Open Bar Time Marker
Marks the open time of a selected bar (for example, a session open or a specific reference bar).
Primarily intended as a visual aid for manual backtesting and reviewing historical price action.
Usage
Use the watermark and ticker info to keep your charts labeled and organized.
Refer to the ADR readout to understand typical daily volatility of the instrument you are studying.
Use the date and open bar time marker when creating screenshots, trade journals, or when replaying historical sessions for review.
This script does not generate trading signals and does not guarantee any performance or results. It is provided solely as an informational and visualization tool. Always combine it with your own analysis, risk management, and decision-making. Nothing in this indicator or description should be considered financial advice.

PDH/PDL Sweep & Rejection - sudoPDH/PDL Sweep + Rejection
This indicator identifies classic liquidity sweeps of the previous day's high or low, then confirms whether price rejected that level with force. It is built to highlight moments when the market takes liquidity and immediately snaps back in the opposite direction, a behavior often linked to failed breakouts, engineered stops, or clean reversals. The tool marks these events directly on the chart so you can see them without manually watching the daily levels.
What it detects
The indicator focuses on two events:
PDH sweep and rejection
Price breaks above the previous day's high, overshoots the level by a meaningful amount, and then closes back below the high.
PDL sweep and rejection
Price breaks below the previous day's low, overshoots, and then closes back above the low.
These are structural liquidity events, not random wicks. The script checks for enough overshoot and strong bar range to confirm it was a genuine stop grab rather than noise.
How it works
The indicator evaluates each bar using the following logic:
1. Previous day levels
It pulls yesterday's high and low directly from the daily timeframe. These act as the PDH and PDL reference points for intraday trading.
2. Overshoot measurement
After breaking the level, price must push far enough beyond it to qualify as a sweep. Instead of using arbitrary pips, the required overshoot is scaled relative to ATR. This keeps the logic stable across different assets and volatility conditions.
3. Range confirmation
The bar must be larger than normal compared to ATR. This ensures the sweep happened with momentum and not because of small, choppy price movement.
4. Rejection close
A valid signal only prints if price closes back inside the previous day's range.
For a PDH sweep, the bar must close below PDH.
For a PDL sweep, the bar must close above PDL.
This confirms a failed breakout and a rejection.
What gets placed on the chart
Red downward triangle above the bar: Previous Day High sweep and rejection
Lime upward triangle below the bar: Previous Day Low sweep and rejection
The markers appear exactly on the bar where the sweep and rejection occurred.
How traders can use this
Identify potential reversals
Sweeps often occur when algorithms target liquidity pools. When followed by a strong rejection, the market may be preparing for a reversal or rotation.
Avoid chasing breakouts
A clear sweep warns that a breakout attempt failed. This can prevent traders from entering at the worst possible location.
Time entries at extremes
The markers help you see where the market grabbed stops and immediately turned. These areas can become high quality entry zones in both trend continuation and countertrend setups.
Support liquidity based models
The indicator aligns naturally with trading frameworks that consider liquidity, displacement, failed breaks, and microstructure shifts.
Add confidence to confluence-based setups
Combine sweeps with displacement, FVGs, or higher timeframe levels to refine entry timing.
Why this indicator is helpful
It automates a pattern that traders often identify manually. Sweeps are easy to miss in fast markets, and this tool eliminates the need to constantly monitor daily levels. By marking only the events that show overshoot plus rejection plus significant range, it filters out the weak or false signals and leaves only meaningful liquidity events.

Displacement Pulse Markers - sudoThis indicator is designed to highlight sudden and meaningful bursts of price movement. These bursts are called displacement pulses. A pulse appears when price expands with force, closes near the extreme of its own bar, and breaks through a recent structural level. The indicator places small circles above or below the candle to signal these moments so that traders can quickly spot abnormal movement and potential shifts in market intent.
How it works
The indicator evaluates each bar for three conditions:
Range expansion relative to volatility
The bar must be larger than normal. It compares the bar range to ATR and requires that range to exceed a multiple of ATR. When this condition is met, the bar is considered a large or forceful bar.
Close location within the bar
The bar has to close near its own high or low. A close near the top suggests strong buying force. A close near the bottom suggests strong selling force. The user can adjust what percentage qualifies as near the top or bottom.
Break of recent structure
The bar must break a recent pivot level. For bullish pulses, the high of the bar must exceed the highest high of the past N bars. For bearish pulses, the low must break the lowest low of the past N bars. This confirms that the move did not merely expand but actually displaced prior structure.
When all conditions align
A bullish displacement pulse is marked with a small aqua circle below the bar.
A bearish displacement pulse is marked with a fuchsia circle above the bar.
The result is a clean on chart visualization of where price produced meaningful displacement.
How traders can use this
Spot abnormal momentum
Pulses can highlight areas where price behaves with more force than usual. These events often appear around news, liquidity sweeps, or algorithmic shifts.
Identify possible regime changes
A pulse that breaks structure while closing near the extreme may signal a transition from a ranging environment to a trending one. It does not predict direction but flags where displacement actually occurred.
Support narrative building
When combined with levels, zones, or other frameworks, pulses can confirm whether the market had enough strength to break through an area with conviction.
Filter trades or refine entries
Some traders may choose to trade in the direction of recent pulses during trending conditions. Others may only enter a trade after a pulse confirms that the market has shifted away from compression.
Track where the market is imbalanced
A pulse visually marks whether buyers or sellers were able to generate strong initiative movement. These points often become useful reference zones for continuation or rejection analysis.
Why this indicator is useful
It reduces complex logic into simple visual markers. Instead of scanning bar by bar for structural breaks, volatility expansions, and close strength, the indicator does this automatically and highlights only the bars that meet all criteria. This keeps the chart clean while still providing precision about where displacement actually occurred.

OTA ATR Stop BufferOTA ATR indicator calculates and displays the Daily Average True Range (ATR), and two customizable ATR percentage values in a clean table format. It provides values in ticks and points, helping traders set stop-loss buffers based on market volatility.

Hash SupertrendHash Supertrend is a visually enhanced Supertrend-based indicator designed by Hash Capital Research, tuned specifically for crypto trend trading on Solana (SOL) and Bitcoin (BTC). It combines institutional-style color coding, an optional session time filter, and production-ready alerts for systematic and discretionary traders alike.
What This Indicator Is
Hash Supertrend is a trend-following volatility band indicator built on TradingView’s native ta.supertrend() function.
It’s optimized and visually styled for:
High-volatility crypto pairs (especially SOL/USDT, SOL/USD, BTC/USDT, BTC/USD)
Timeframes typically used by crypto traders (from 5m scalping to 4H swing and 1D trend following)
The script is an indicator, not a strategy:
It does not place trades or show backtest results.
It provides clear trend states, flips, and alerts that you can plug into your own execution stack or manual trading.
Key Features
✅ Tuned for Crypto (Solana & Bitcoin)
Parameters are chosen to respond well to the volatility profile of SOL and BTC, reducing noise while still catching strong moves.
✅ Non-repainting Supertrend Core
Uses TradingView’s built-in ta.supertrend — values may move intrabar as the bar forms, but once a bar closes, the historical line and signals do not repaint.
✅ Fluorescent Trend Visualization
Bright green for bullish phases
Bright red for bearish phases
Adaptive color intensity based on user setting
✅ Glow Layer & Trend Zones
Glow effect around the Supertrend line for instant visual recognition
Optional filled zones between price and line for “trend cloud” style visualization
✅ Time Filter (Session Control)
Option to only mark signals during specific hours for those wanting to integrate with webhooks
Designed for traders who avoid certain sessions (e.g., low-liquidity hours)
✅ Signal Dots & Alerts
Tiny green dots for bullish flips
Tiny red dots for bearish flips
Professional, preconfigured alerts for:
Long Entry
Short Entry
Any Trend Change
Filtered signals outside trading hours (for monitoring only)
The core logic is built on:
ATR Length (ATR Length) Default: 16
Lower values (7–10): more sensitive, more signals, more noise
Higher values (12–20): smoother, fewer but stronger trend signals
Factor (Factor) Default: 3.11
Lower values (1.5–2.5): tighter bands, earlier entries, higher whipsaws
Higher values (3.0–4.0+): wider bands, later entries, stronger trend confirmation
The indicator reads direction from ta.supertrend and classifies:
Bullish Trend: direction < 0
Bearish Trend: direction > 0
A trend flip happens when direction changes sign:
longSignal: Supertrend flips from above price to below price (bearish → bullish)
shortSignal: Supertrend flips from below price to above price (bullish → bearish)

ATR Levels Trade PlanOverview
This indicator is a trade management tool designed to help traders visualize volatility-based targets and stop-losses instantly. By anchoring calculations to the Daily Opening Price and the Average True Range (ATR), it projects objective, mathematical support and resistance levels for the current session.
How It Works
The script detects the start of the trading day (or a manually defined period) and draws a vertical marker. From there, it projects horizontal lines representing key multiples of the ATR:
Green Line: Opening Price (The baseline).
Blue Lines (Targets): +0.5 ATR, +1.0 ATR, and +2.0 ATR. These serve as dynamic profit-taking zones based on current market volatility.
Orange Line (Stop Loss): -2.0 ATR. A standard volatility-based stop level.
Red Line (Emergency Exit): -3.0 ATR. A level indicating extreme adverse moves.
Multi-Ticker Database & Date Verification This version includes a built-in configuration menu capable of storing unique trade plans for up to 20 different stocks.
20-Slot Memory: You can pre-load the Ticker Symbol, Planned Open, and ATR for up to 20 individual assets in the settings.
Date/Period of Trade: Each slot includes a "Date" field (YYYYMMDD). This assigns the manual values to a specific trading session.
Default Behavior (Auto-Fallback): The indicator intelligently scans the database when you switch charts.
If the Ticker matches a slot AND the Date matches the current session, it loads your manual values.
If the Ticker is not in the database, or if the Date is expired (from a previous day), the script automatically defaults to the live Daily Open and standard ATR-14.
Key Features
Clean Visuals: Uses the Drawing API to plot lines only on the current/last bar, keeping historical price action clean and uncluttered.
Text Customization: Users can align text to the Right, Left, or Center, adjust the offset distance, and change text size to fit their chart layout.
Flexible Alerts: Includes a dedicated "Alert Configuration" menu. Users can toggle alerts on/off for individual lines (e.g., enable the Stop Loss alert but disable the +0.5 ATR alert). All enabled settings work via a single "Any alert() function call."
Settings
Stock Database: 20 configuration groups to input Ticker, Date, Open, and ATR.
Global/Fallback Values: Input custom Open/ATR prices (leave at 0 for automatic) to be used if the specific stock is not in the database.
Text & Alignment: Adjust label position, offset, and size.
Alert Configuration: Checkboxes to enable/disable alerts for specific price levels.
Methodology The levels are calculated using the standard formula: Level = Opening Price + (Multiplier * ATR)

ATR Based Stoploss LineThis indicator dynamically plots a horizontal stop-loss level using an RMA-based Average True Range (ATR). The stop value is calculated from the current closing price minus ATR (with optional multiplier) to provide a systematic risk reference during active price movement. A fixed line extends across recent bars for clear visualization, with the stop-loss price displayed at the midpoint of that line for intuitive charting. This tool should be strictly used for breakout environments, aligned with your risk management protocol, and always confirmed with volume analysis before execution. The intent is to drive disciplined entries, strengthen downside protection, and support robust trade management in volatile market conditions.

Brahmastra PremiumBrahmastra Trade System is a complete institutional trading engine designed for traders who want precision entries, clean trends, and automated risk management.
It combines multi-timeframe confirmation, ATR-based volatility logic, trend structure, and angle analytics—giving you a highly reliable and visually clean trading framework.
🔥 Key Features
✅ 1. Institutional Trend Engine (Triple Confirmation):
The trend is detected using:
Fast MA (5)
Slow SMA/EMA (51)
Custom ATR Trend (SuperTrend-like algorithm)
This three-layer confirmation ensures you only trade when the trend is solid, real, and clean.
✅ 2. Multi-Timeframe Breakout Confirmation (1-Minute)
Most retail breakouts are fake.
This indicator validates entries using lower timeframe 5-minute candle closes.
✔ Helps avoid traps
✔ Ensures genuine breakout momentum
✔ Great for intraday & swing traders
✅ 3. Smart Entry & Exit Signals
Clear on-chart signals:
Bullish Entry (Triangle Up)
Bearish Entry (Triangle Down)
Buy Exit
Sell Exit
Exit logic uses:
Fast MA breakdown
ATR trend reversal
This catches trend reversals early and protects profits.
✅ 4. Automatic SL + TP1/TP2/TP3 Projection (ATR-Based)
On every entry, Brahmastra automatically plots:
Stop Loss (SL),Target 1,Target 2,Target 3
Targets are based on volatility (ATR), not random lines. This gives:
✔ Stable stops
✔ Dynamic targets
✔ Accurate risk–reward mapping
✅ 5. Smart Trailing Stop Loss (TSL)
TSL activates only after TP1 hits.
Buy trades → TSL moves upward
Sell trades → TSL moves downward
The trailing SL never moves backward → flawless institutional money management.
✅ 6. Volume-Powered Candle Coloring
Candles change color based on:
Trend direction
Volume intensity
Makes momentum extremely easy to read:
High volume bull → Neon green
High volume bear → Neon red
✅ 7. Multi-Angle Trendline System (3 Layers)
Brahmastra auto-draws support/resistance trendlines for:
L1 (Scalp) – Short trend
L2 (Swing) – Medium trend
L3 (Macro) – Larger trend
Each trendline is analyzed for angle strength:
🚀 Parabolic (Dangerous / Vertical)
💪 Strong Trend (Ideal)
😴 Weak / Accumulation (Sideways)
This helps you see whether the market is:
About to explode
Losing strength
Moving sideways
⚠️ Disclaimer
This indicator is an advanced trading tool, NOT financial advice.
Always backtest, understand the logic, and trade responsibly.

Real Relative Strength Indicator### What is RRS (Real Relative Strength)?
RRS is a volatility-normalized relative strength indicator that shows you – in real time – whether your stock, crypto, or any asset is genuinely beating or lagging the broader market after adjusting for risk and volatility. Unlike the classic “price ÷ SPY” line that gets completely fooled by volatility regimes, RRS answers the only question that actually matters to professional traders:
“Is this ticker moving better (or worse) than the market on a risk-adjusted basis right now?”
It does this by measuring the excess momentum of your ticker versus a benchmark (SPY, QQQ, BTC, etc.) and then dividing that excess by the average volatility (ATR) of both instruments. The result is a clean, centered-around-zero oscillator that works the same way in calm markets, crash markets, or parabolic bull runs.
### How to Use the RRS Indicator (Aqua/Purple Area Version) in Practice
The indicator is deliberately simple to read once you know the rules:
Positive area (aqua) means genuine outperformance.
Negative area (purple) means genuine underperformance.
The farther from zero, the stronger the leadership or weakness.
#### Core Signals and How to Trade Them
- RRS crossing above zero → one of the highest-probability long signals in existence. The asset has just started outperforming the market on a risk-adjusted basis. Enter or add aggressively if price structure agrees.
- RRS crossing below zero → leadership is ending. Tighten stops, take partial or full profits, or flip short if you trade both sides.
- RRS above +2 (bright aqua area) → clear leadership. This is where the real money is made in bull markets. Trail stops, add on pullbacks, let winners run.
- RRS below –2 (bright purple area) → clear distribution or capitulation. Avoid new longs, consider short entries or protective puts.
- Extreme readings above +4 or below –4 (background tint appears) → rare, very high-conviction moves. Treat these like once-a-month opportunities.
- Divergence (not plotted here, but easy to spot visually): price making new highs while the aqua area is shrinking → distribution. Price making new lows while the purple area is shrinking → hidden buying and coming reversal.
#### Best Settings by Style and Asset Class
For stocks and ETFs: keep benchmark as SPY (or QQQ for tech-heavy names) and length 14–20 on daily/4H charts.
For crypto: change the benchmark to BTCUSD (or ETHUSD) immediately — otherwise the reading is meaningless. Length 10–14 works best on 1H–4H crypto charts because volatility is higher.
For day trading: drop length to 10–12 and use 15-minute or 5-minute charts. Signals are faster and still extremely clean.
#### Highest-Edge Setups (What Actually Prints Money)
- RRS crosses above zero while price is still below a major moving average (50 EMA, 200 SMA, etc.) → early leadership, often catches the exact bottom of a new leg up.
- RRS already deep aqua (+3 or higher) and price pulls back to support without RRS dropping below +1 → textbook add-on or re-entry zone.
- RRS deep purple and suddenly turns flat or starts curling up while price is still falling → hidden accumulation, usually the exact low tick.
That’s it. Master these few rules and the RRS becomes one of the most powerful edge tools you will ever use for rotation trading...

ATR Trade Plan ToolOverview
This indicator is a trade management tool designed to help traders visualize volatility-based targets and stop-losses instantly. By anchoring calculations to the Daily Opening Price and the Average True Range (ATR), it projects objective, mathematical support and resistance levels for the current session.
How It Works
The script detects the start of the trading day (or a manually defined period) and draws a vertical marker. From there, it projects horizontal lines representing key multiples of the ATR:
Green Line: Opening Price (The baseline).
Blue Lines (Targets): +0.5 ATR, +1.0 ATR, and +2.0 ATR. These serve as dynamic profit-taking zones based on current market volatility.
Orange Line (Stop Loss): -2.0 ATR. A standard volatility-based stop level.
Red Line (Emergency Exit): -3.0 ATR. A level indicating extreme adverse moves.
Key Features
Auto or Manual Mode: By default, the script automatically fetches the Daily Open and ATR-14. However, users can manually input a specific Opening Price or ATR value in settings to simulate trade plans or override automatic data.
Clean Visuals: Uses the Drawing API to plot lines only on the current/last bar, keeping historical price action clean and uncluttered.
Text Customization: Users can align text to the Right, Left, or Center, adjust the offset distance, and change text size to fit their chart layout.
Flexible Alerts: Includes a dedicated "Alert Configuration" menu. Users can toggle alerts on/off for individual lines (e.g., enable the Stop Loss alert but disable the +0.5 ATR alert). All enabled settings work via a single "Any alert() function call."
Settings
Values: Input custom Open/ATR prices (leave at 0 for automatic).
Text & Alignment: Adjust label position, offset, and size.
Alert Configuration: Checkboxes to enable/disable alerts for specific price levels.
Methodology The levels are calculated using the standard formula: Level = Opening Price + (Multiplier * ATR)

[CT] ATR Ratio MTFThis indicator is an enhanced, multi-timeframe version of the original “ATR ratio” by RafaelZioni. Huge thanks to RafaelZioni for the core concept and base logic. The script still combines an ATR-based ratio (Z-score style reading of where price sits within its recent ATR envelope) with an ATR Supertrend, but expands it into a more flexible trade-decision and visual context tool.
The ATR ratio is normalized so you can quickly see when price is pressing into extended bullish or bearish territory, while the Supertrend defines directional bias and a dynamic support-resistance trail. You can choose any higher timeframe in the settings, allowing you to run the ATR ratio and Supertrend from a larger anchor timeframe while trading on a lower chart.
Upgrades include a full Pine Script v6 rewrite, multi-timeframe support for both the ATR ratio and Supertrend, user-controlled colors for the Supertrend in bull and bear modes, and optional bar coloring so price bars automatically reflect Supertrend direction. Entry, pyramiding and take-profit logic from the original script are preserved, giving you a familiar framework with more control over timeframe, visuals and trend bias.
This indicator is designed to give you a clean directional framework that blends volatility, trend, and timing into one view. The ATR ratio side of the script shows you where price sits inside a recent ATR-based envelope. When the ATR ratio pushes up and sustains above the bullish threshold, it signals that price is trading in an extended, momentum-driven zone relative to recent volatility. When it drops and holds below the bearish threshold, it shows the opposite: sellers have pushed price down into an extended bearish zone. The optional background coloring simply makes these bullish and bearish environments easier to see at a glance.
On top of that, the Supertrend and bar colors tell you what side of the market to favor. The Supertrend is calculated from ATR on whatever timeframe you choose in the settings. If you set the MTF input to a higher timeframe, the Supertrend and ATR ratio become your higher time frame bias while you trade on a lower chart. When price is above the MTF Supertrend, the line uses your bullish color and, if bar coloring is enabled, candles adopt your bullish bar color. That is your “long only” environment: you generally look for buys when price is above the Supertrend and the ATR ratio is either turning up from neutral or already in a bullish zone. When price is below the MTF Supertrend, the line uses your bearish color and candles can shift to your bearish bar color; that is where you focus on shorts, especially when the ATR ratio is rolling over or holding in the bearish zone.
The built-in long and short conditions are meant as signal prompts, not rigid rules. Long signals fire when the ATR ratio crosses up through a positive level while the Supertrend is bullish. Short signals fire when the ATR ratio crosses down through a negative level while the Supertrend is bearish. The script tracks how many longs or shorts have been taken in sequence (pyramiding) and will only allow a new signal up to the limit you set, so you can control how aggressively you stack positions in a trend. The take-profit logic then watches the percentage move from your last entry and flags “TP” when that move has reached your take-profit percent, helping you standardize exits instead of eyeballing them bar by bar.
In practice you typically start by choosing your anchor timeframe for the MTF setting, for example a 1-hour or 4-hour Supertrend and ATR ratio while watching a 5-minute or 15-minute chart. You then use the Supertrend direction and bar colors as your bias filter, only taking signals in the direction of the trend, and you use the ATR ratio behavior to judge whether you are entering into strength, fading an extreme, or trading inside a neutral consolidation. Over time this gives you a consistent way to answer three questions on every chart: which side am I allowed to trade, how extended is price within its recent volatility, and where are my structured entries and exits based on that framework.

Bottom Up - Reverso ProReverso Pro by Bottom Up - Excess is the signal. Reversion is the edge.
Reverso is a mean reverting indicator that identifies market excesses and signals reversals for highly probable retracements to an average value.
Reverso's algorithm is extremely precise because it also takes into account the historical volatility of the instrument and constantly recalibrates itself dynamically without repainting.
This tool is suitable for mean-reversion traders who want to study EMA reactions, understand market trends, and refine entry/exit strategies based on price-memory dynamics.
Why Reverso Pro is different (This isn’t just another indicator)
Zero repainting – What you see is what you get. No tricks, no redraws, ever.
Dynamically adapts to the historical volatility of the instrument — works the same on Forex, stocks, indices, or some random crypto.
Constant real-time recalibration — adjusts instantly to volatility regime changes.
Fully adjustable sensitivity — From machine-gun signals for brutal scalping to only the most extreme deviations for monster-probability swing trades.
Native multi-timeframe control — Choose the timeframe used for signal calculation (5 min, 1H, daily, or custom). Reverso bends to your style.
When a Reverso signal fires:
Price has reached a statistically extreme deviation from its historical memory.
The probability of a snapback to the mean is at its peak.
It’s time to go counter-trend with the lowest risk and the highest reward possible.
Customization Options
You can use it on any timeframe and instrument.
You can customize also the timeframe over which the signals are processed to suit very fast scalping trading or to intercept slower and longer movements for swing trading.
The sensitivity of the indicator can also be customized to emit multiple signals or identify only the most extreme levels of deviation from the mean.
Add to chart. Turn on alerts. Happy trading!
Bottom Up - The Ecosystem Designed for Traders
bottomup.finance

ATR + infoIt shows the ATR, the stop loss and stop profit levels, and the amount to invest based on capital and the risk you are willing to take.

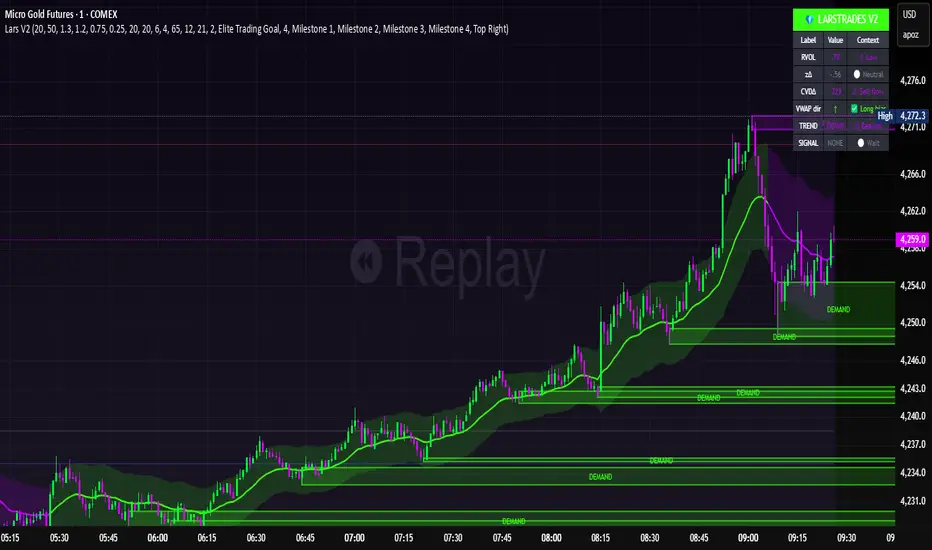
LarsTrades Order Flow ZonesLarsTrades Order Flow Zones
**Important:
-Futures charts only!
-Trust the default settings
-best on 2min or lower timeframe.
-if indicator error in replay mode: exit, ctrl+r - it will reset.
This indicator builds a full trade workflow from raw order flow imbalances. It finds aggressive buy and sell imbalances, promotes the strongest ones into key levels, and manages each level through its entire life cycle. Every level becomes a visual zone on the chart that updates in real time as the market moves.
It is built for short-term traders who want clarity, speed, and a structured decision process based on imbalances instead of guesswork.
If you rely on order flow, imbalance zones, or systematic retest setups, this tool helps you stay consistent and understand the story behind each move.
BT Volume & Volatility Spike
The BT Spike Indicator is aimed at identifying significant spikes in trading volume and price volatility on cryptocurrency or futures charts. It helps traders spot potential reversal or momentum shifts by combining volume analysis with volatility measures. The core logic revolves around detecting when volume surges above its historical average while volatility (measured via ATR) also spikes, signaling unusual market activity that could precede breakouts, pullbacks, or trend changes.
Key features include:
Inputs: Customizable parameters like lookback periods for averages (e.g., 14-bar EMA for volume), ATR length (default 14), and spike thresholds (e.g., volume multiplier of 2x the average).
Visuals: Plots bars or shapes on the chart for spike detections (e.g., green for bullish spikes, red for bearish), with optional alerts for real-time notifications.
Versions: We iterated on it, adding features like better alert conditions and visual signals, but rolled back to a simplified v0.1 for reliability, removing some experimental bug-prone elements like multi-timeframe checks.
BT Spike is a volume & volatility signal meant to alert traders that a move could begin soon, and is a supplementary tool to highlight confluence for existing high-probability setups.
