FSH ATR MTF MonitorThe FSH ATR MTF Monitor tracks the Average True Range (ATR) and current range across six customizable timeframes, displaying the results in a table. When a timeframe’s range exceeds its ATR, the range value turns yellow, signaling heightened volatility. This multi-timeframe tool helps traders assess market conditions and plan entries or exits.
Key Features:
- Monitors ATR and range for up to six timeframes simultaneously.
- Customizable ATR length and timeframe inputs.
- Highlights ranges exceeding ATR in yellow for quick identification.
- Table display with toggle option for flexibility.
How to Use:
1. Add the indicator to your chart.
2. Adjust the ATR length and timeframes in the inputs as needed.
3. Watch for yellow range values to spot volatility spikes across timeframes.
4. Toggle the table off if not needed.
Ideal for scalpers, swing traders, or anyone analyzing volatility across multiple timeframes.
Média de Amplitude de Variação (ATR)

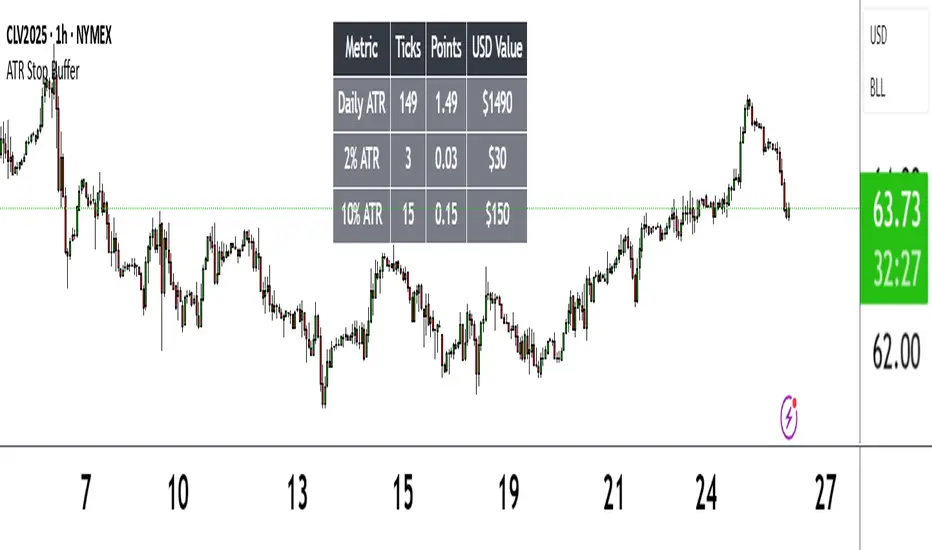
ATR Stop BufferThe ATR Stop Buffer indicator calculates the Daily Average True Range (ATR) and converts it into ticks based on the symbol's minimum price movement. It then displays the full ATR, 2% of ATR, and 10% of ATR in a clean table format, rounded up for simplicity. This tool is ideal for traders who want to set volatility-based stop-loss levels or buffers for their trades.
Key Features:
- Uses a 14-period Daily ATR for robust volatility measurement.
- Converts ATR into ticks for precise application across different instruments.
- Table display with toggle option for flexibility.
- Perfect for risk management and trade planning.
How to Use:
1. Add the indicator to your chart.
2. Use the table values to adjust your stop-loss distances (e.g., 2% ATR for tight stops, 10% ATR for wider buffers).
3. Toggle the table off if you only need the values occasionally.
Note: Works best on instruments with defined tick sizes (e.g., futures, forex, stocks).
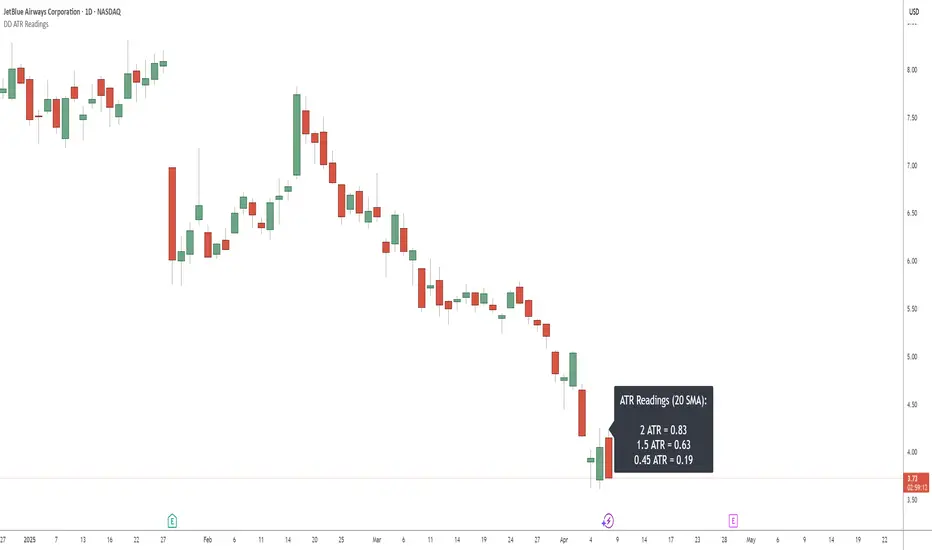
DD ATR ReadingsThe DD ATR Readings indicator displays customizable Average True Range (ATR) multiplier values directly on your chart. Unlike standard ATR indicators that only show a line, this indicator calculates and displays the exact numeric values for three different ATR multipliers, giving you precise volatility measurements for your trading decisions.
It's specifically created for people taking the "Deep Dip Buy" stock trading course, and attempts to provide a ready-to-go solution to allow easy position size calculations as per the course, with the required ATR values visible at a glance.
The default values of 2.0, 1.5 and 0.45 are the same values used by the course instructor in his charting software, but you can change these values to any multiplier you choose.
Any input from students or the instructor is welcome to improve this indicator so it offers more value to those looking to learn how to trade.
Features
Displays three customizable ATR multiplier values (default: 2.0, 1.5, and 0.45 from the course)
Uses either SMA or EMA for ATR calculation (20-period default)
Fully customizable label appearance (position, color, size)
Real-time value updates as you move through the chart
Clean, unobtrusive display that doesn't clutter your chart with additional lines
Customization Options
ATR Length: Number of bars used in the ATR calculation (default: 20)
ATR Multipliers: Three customizable multiplier values
SMA/EMA: Choose your preferred moving average type for ATR calculation
Label Style: Multiple positioning options for the text display
Colors and Size: Fully customizable appearance
Multi-Timeframe ATR MonitorThis indicator displays a table of ATR values across multiple user-defined timeframes (1m, 3m, 5m, 15m, 60m, daily by default) and tracks the session range since 18:00. Customize the timeframes and ATR length via inputs.
RSI + ADX + ATR Combo Indicator: RSI + ADX + ATR Combo Filter
This indicator is a confluence filter tool that combines RSI, ADX, and ATR into a single, easy-to-read chart overlay. It is designed to help traders identify low-volatility, non-trending zones with balanced momentum—ideal for strategies that rely on breakouts or reversals.
🔍 Core Components:
RSI (Relative Strength Index)
Standard RSI with custom upper and lower bounds (default: 60 and 40).
Filters out extreme overbought/oversold regions and focuses on price consolidation zones.
ADX (Average Directional Index)
Measures trend strength.
When ADX is below a custom threshold (default: 20), it indicates a weak or range-bound trend.
ATR (Average True Range)
Represents volatility.
Low ATR values (default threshold: 2.5) are used to filter out high-volatility environments, helping refine entries.
🟣 Signal Logic:
A signal is highlighted with a background color when all three conditions are met:
RSI is between lower and upper bounds (e.g., 40 < RSI < 60) ✅
ADX is below the trend threshold (e.g., ADX < 20) ✅
ATR is below the volatility threshold (e.g., ATR < 2.5) ✅
These combined conditions suggest a low-volatility, low-trend strength, and balanced momentum zone—perfect for anticipating breakouts or strong directional moves.

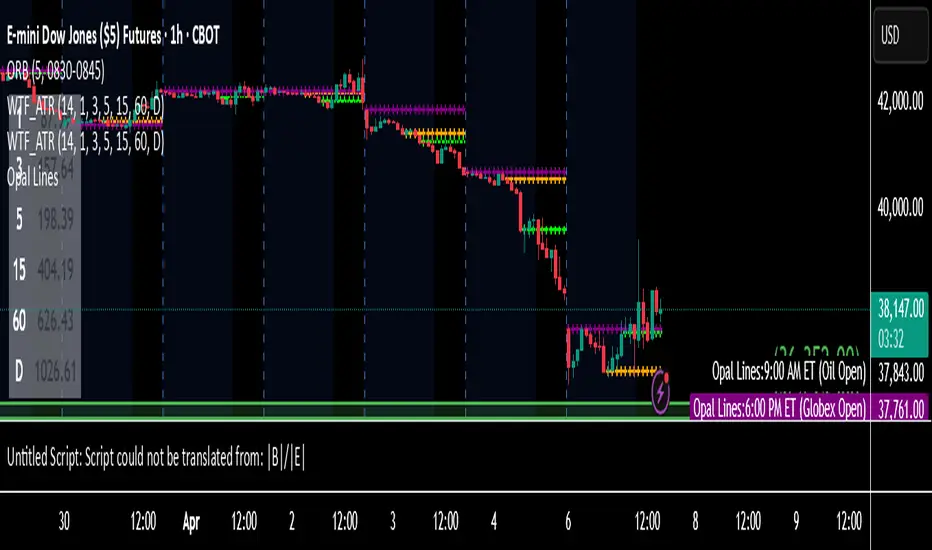
Open Range Candle [TradeWithRon]This Open Range Break indicator is a tool designed to help traders identify and visualize key price levels using the Opening Range Breakout (ORB) strategy. This indicator dynamically plots critical levels such as the high, low, and middle of a predefined range, along with Fibonacci retracement levels for further analysis. It also features several customization options to fit various trading styles.
Key Features:
Session Setup: Allows the user to set the time offset in GMT - or + to adjust the ORB session to their local time zone.
The default ORB session is set at 9:45 AM but can be adjusted based on user preferences.
Warning: Only supports 5-minute and 15-minute timeframes.
Visual Customization:
Line Styles: Users can choose from Solid, Dotted, or Dashed lines to represent key price levels.
Color Adjustments: Customizable colors for the high, middle, and low levels of the range, as well as Fibonacci levels and vertical lines.
Labeling Options: The labels can be customized in terms of size and color, helping to keep the chart clean and clear.
Fibonacci Retracement Levels: Fibonacci retracement levels are automatically drawn between the high and low of the range. Users can toggle these on or off and customize the offset to suit different trading instruments.
Time-Based Visuals: A vertical line is drawn at the start of the ORB session, providing a clear visual marker of where the breakout starts. This is useful for pinpointing key trade setups.
The indicator supports both 5-minute and 15-minute timeframes.
EMA Integration: The user can enable an Exponential Moving Average (EMA) on any chosen timeframe with adjustable parameters such as the length and color, providing additional trend context.
Dynamic Labeling: The indicator labels the high, middle, and low points of the ORB with custom text. These labels are updated in real-time as new data becomes available.
Limit on Lines and Labels: The indicator allows for a limit on the number of lines and labels drawn to maintain a clean chart, preventing unnecessary clutter as more ORB levels are plotted.
Daily Bias Information: The indicator assesses the daily trend bias (bullish or bearish) based on the relationship between the open and close prices for the last three daily candles, providing context for the current trading session.
Countdown Timer: The remaining time until the end of the current session is displayed in a countdown format, which helps traders to time their entries and exits more precisely.
How To Use:,
- Set the Timeframe to 15 minutes.
- Adjust the Time Zone Offset if needed, based on your local time zone.
- Enable the Show ORB feature for the first 15-minute candle to be drawn as the opening range. - The indicator will automatically mark the high, middle, and low points of the range.
Identify Breakout Points:
Bullish Breakout: If the price breaks above the high of the 15-minute opening range, this indicates a potential bullish breakout. The indicator will plot a vertical line marking the breakout point for further confirmation.
Bearish Breakout: If the price breaks below the low of the 15-minute opening range, this signals a potential bearish breakout. Again, the indicator will plot the breakout point with a vertical line for easy identification.
🔶 Disclaimer
Use with Caution: This indicator is provided for educational and informational purposes only and should not be considered as financial advice. Users should exercise caution and perform their own analysis before making trading decisions based on the indicator's signals.
Not Financial Advice: The information provided by this indicator does not constitute financial advice, and the creator (Tradewithron) shall not be held responsible for any trading losses incurred as a result of using this indicator.
Backtesting Recommended: Traders are encouraged to backtest the indicator thoroughly on historical data before using it in live trading to assess its performance and suitability for their trading strategies.
Risk Management: Trading involves inherent risks, and users should implement proper risk management strategies, including but not limited to stop-loss orders and position sizing, to mitigate potential losses.
No Guarantees: The accuracy and reliability of the indicator's signals cannot be guaranteed, as they are based on historical price data and past performance may not be indicative of future

Chonky ATR Levels 2.0Show ATR based high/low projections.
Choose a custom ATR calculation in the indicator's settings.
The default is a 20day RMA based ATR.
----------How projections are calculated----------
To project the ATR High, the ATR value is added to the low of the current candle that matches the ATR's timeframe.
To project the ATR Low, the ATR value is subtracted from the high of the current candle that matches the ATR's timeframe.
Example:
If a 20day RMA ATR is used:
- the ATR High will be the current day's low + the ATR value.
- the ATR Low will be the current day's high - the ATR value.
*However*, if the price action exceeds either ATR projection, the opposite ATR level will be fixed to the extreme of the period.
See the AUDUSD screenshot above for an example.
The ATR Low was exceeded, so the ATR High projection is capped at the high of day.
If the ATR High is exceeded, the ATR Low would be capped at the low of day.

Rachas ATR AssistHey Traders!
This indicator is a simple, it uses Average True Range (ATR) data from the daily chart and the current timeframe to estimate potential range and volatility.
This indicator compares the daily ATR to the current daily wick range (from low to high), helping you gauge how much "room" might be left for price movement within the day. Alongside that, it shows the ATR over the last 14 candles and 5 candles on your current chart for intraday volatility awareness—ideal for setting stops, targets, or position sizing.
Gauge Daily Potential Movement:
The "Day Range Difference" cell shows how much of the expected daily range (based on ATR) is still unfilled. If the market has moved less than the average, there's still potential for expansion. If it's close to or above the ATR, expect a slowdown or reversal.
Position Sizing & Stop Losses:
Use the 14-period ATR and 5-period ATR on your current timeframe to understand recent volatility. This helps in choosing logical stop loss levels and adjusting position sizes based on market conditions.
Volatility Awareness:
Knowing the average daily range and how much of it has been used lets you avoid entering trades too late in the move or placing stops in overly tight spots.
Table Position & Font:
You can adjust the table location (top/bottom left/right) and font size to best fit your chart layout.

Order Block Indicator | DTDHello trader comuunity!
I'm uploading a basic script that I felt necessary to make to help me with some gaps in my day trading. I personally am a visual trader that benefits greatly from automating some the ideas I have in my head. There are awesome builders out there and me creating this script isn't a knock on what's currently available to us, but something I wanted to be able to manage. I am opening up what I've found extremely helpful to my own trading to the community.
Here we have a very simple ATR-based order block (OB) finder. It's not anything original, but I do find consistent opportunities when combined with other tools I use to measure the market. It takes into consideration the previous 25 candles to determine if the OB is significant enough to mark. I use the average of 25 because I simply like it. I use the 25 EMA as part of my "trending" templates and find it to be a hybrid timeframe of sorts. You can find macro and micro trade locations by switching timeframes.
The main elements of the script are:
1. ATR based tracking | A bullish OB is defined as a down close candle that is eclipsed by an up-close candle that closes above its high and sustained for 2 consecutive candles. Inversely, a bearish OB is defined by an up-close candle immediately followed by a down-close candle that closes below the low of the up-close candle and sustains for 2 consecutive candles.
2. Coloring the OB | Though up-close and down-close define bearish and bullish levels, with this script I basically make OBs to switch colors based on where price is relative to the block. So a bullish block can become bearish and bearish can become bullish. Each block also has a dashed midpoint.
3. Order Block Mitigation | When price retests an OB by closing inside of it and retracing back out, that is considered mitigation. You will see price tap into it, but continues to track as a valid block, it's because it didn't close inside the block. This is subject to change in the future, but it's how the script functions for now.
______________
There are nuances to the script that you will see as you use it. Sometimes mitigated OBs act as levels to consider as well. When multiple blocks overlap I consider that a high traffic area. I would never suggest to use an indicator by itself for trade ideas, but blocks that align on multiple timeframes are good to consider.
At the end of the day it's a support and resistance measure. I'll comment an update with a snapshot of the indicator with another proprietary indicator I've made that provides ample intraday trading opportunities.
Cheers,
DTD

Rolling ATR Momentum
Rolling ATR Momentum Indicator – User Manual
---
🔍 Overview
The Rolling ATR Momentum Indicator is a simple yet powerful tool designed to detect shifts in market volatility. It compares the current Average True Range (ATR) with the ATR from a previous point in time to measure how market volatility is changing.
This indicator is especially useful for:
- Spotting the beginning or fading of a momentum phase
- Filtering out low-volatility market conditions
- Enhancing timing for entries and exits in trending or breakout trades
---
📊 Key Components
✅ ATR Delta (Rolling)
- Definition: `ATR Delta = Current ATR - Past ATR`
- Inputs:
- ATR Period (default: 14): The base ATR calculation window
- Lookback Period (default: 5): How many bars ago to compare ATR
- Interpretation:
- Positive ATR Delta (Green Line): Market volatility is increasing
- Negative ATR Delta (Red Line): Market volatility is decreasing
📈 Zero Line
- A horizontal baseline at zero helps you easily see when ATR momentum shifts from negative to positive (or vice versa).
🟩/🟥 Background Color
- Green Background: ATR Delta is positive (rising volatility)
- Red Background: ATR Delta is negative (falling volatility)
🔵 Optional: ATR Reference Lines
- You can optionally display raw Current ATR and Past ATR by changing their visibility settings.
---
✅ How to Use It
Entry Timing (Futures/Options)
- Use ATR Delta as a filter:
- Only take trades when ATR Delta is positive → confirms momentum is building
- Avoid trades when ATR Delta is negative → market might be slow, sideways, or losing steam
Breakout Anticipation
- A rising ATR Delta after a tight range or consolidation can suggest that a breakout is underway
Stop-loss Strategy
- Use high ATR periods for wider stops (to avoid noise)
- Use low ATR periods for tighter stops or skip trading
---
🧠 Pro Tips
- This indicator doesn’t predict direction—combine with trend or price structure tools (like EMA, PPMA, candlesticks)
- Works best in trending or breakout environments
- Add it to multi-timeframe layouts to see volatility buildup on higher timeframes
---
⚙️ Settings
| Parameter | Description |
|----------|-------------|
| ATR Period | Length of the ATR calculation (default 14) |
| Lookback Period | How many bars back to compare ATR values |
---
🧭 Best For:
- Index futures (Nifty, BankNifty)
- Option buyers needing volatility confirmation
- Intraday & swing traders looking to trade momentum setups
---
Use the Rolling ATR Momentum indicator as your volatility radar—simple, clean, and highly effective for staying on the right side of market energy.
End of Manual

Rolling ATR Momentum - EnhancedATR Rolling Momentum Indicator – User Manual
---
🔍 Overview
The ATR Rolling Momentum Indicator is a dynamic volatility tool built on the Average True Range (ATR). It not only tracks increasing or decreasing momentum but also provides early warnings and confirmation signals for potential breakout moves. It’s especially powerful for futures and options traders looking to align with expanding price action.
---
📊 Core Components
✅ ATR Delta (Rolling ATR)
- Definition: Difference between current ATR and past ATR (user-defined lookback).
- Use: Tells whether volatility is expanding (positive delta) or contracting (negative delta).
- Visual: Green line for rising momentum, red for declining.
🟣 ATR Delta Slope
- Definition: Measures acceleration in momentum.
- Use: Helps identify early signs of breakout buildup.
- Visual: Purple line. Watch for slope turning up from below.
🟡 Volatility Squeeze (Yellow Dot)
- Definition: Current ATR is significantly lower than its 20-period average.
- Use: Indicates the market is coiling—possible breakout ahead.
🔼 Momentum Start (Green Triangle)
- Definition: ATR Delta slope turns from negative to positive.
- Use: Early warning to prepare for volatility expansion.
🔷 Breakout Confirmation (Blue Label Up)
- Definition: ATR Delta exceeds its high of the last 10 candles.
- Use: Confirms volatility breakout—trade opportunity if direction aligns.
🟩/🟥 Background Color
- Green Background: Momentum rising (positive ATR delta)
- Red Background: Momentum falling (negative ATR delta)
- Yellow Tint: Active squeeze zone
---
✅ How to Use It (Futures/Options Focus)
Step-by-Step:
1. Squeeze Detected (Yellow Dot) → Stay alert. Market is coiling.
2. Green Triangle Appears → Momentum is starting to rise.
3. Background Turns Green → Confirmed rising momentum.
4. Blue Label Appears → Confirmed breakout (enter trade if trend aligns).
Directional Bias:
- Use your main chart setup (price action, EMAs, trendlines, etc.) to decide direction (Call or Put, Long or Short).
- ATR Momentum only tells you how strong the move is—not which way.
---
⚙️ Inputs & Settings
- ATR Period: Default 14 (core volatility measure)
- Rolling Lookback: Used to calculate delta (default 5)
- Slope Length: Used to measure acceleration (default 3)
- Squeeze Factor: Default 0.8 — lower = more sensitive squeeze detection
- Breakout Lookback: Checks ATR delta against last X bars (default 10)
---
🧠 Pro Tips
- Works great when paired with EMA stacks, price structure, or breakout patterns.
- Avoid taking trades based only on squeeze or momentum—combine with chart confirmation.
- If background turns red after a breakout, it may be losing momentum—book partials or tighten stops.
---
🧭 Ideal For:
- Nifty/BankNifty Futures
- Option directional trades (call/put buying)
- Index scalping and momentum swing setups
---
Use this tool as your volatility compass—it won't tell you where to go, but it'll tell you when the wind is strong enough to move fast.
End of Manual

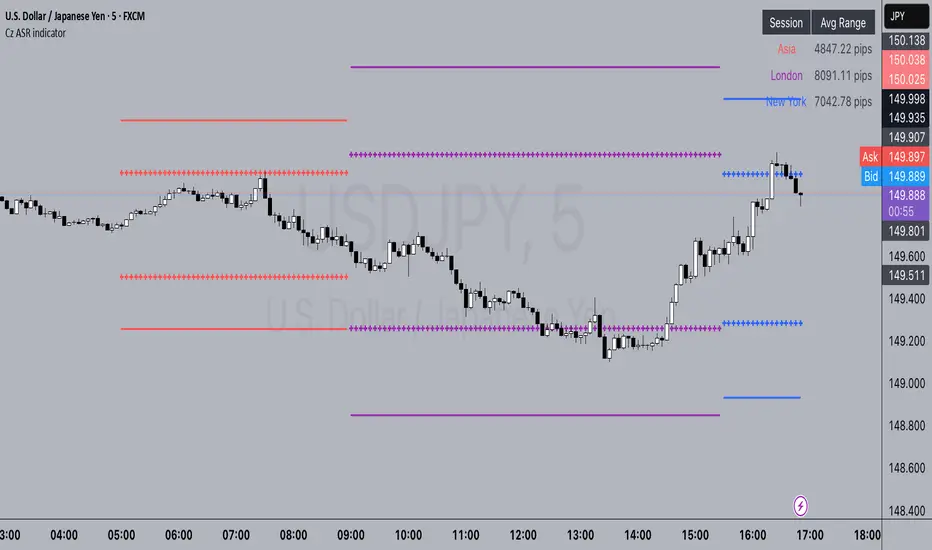
Cz ASR indicatorAverage session range indicator built by me. Great tool to gauge volatility and intraday reversal zones. Great for FX as there is an included table that shows range in pips; however, this can be applied across all assets as a volatility measure.
How it works:
The script measures the range of sessions, including Asia, London, and New York. The lookback period could be adjusted so you can find what length works best and is most accurate. This is then averaged out to provide the ASR. This provides us with an upper and lower bound of which the price could potentially fluctuate in based on the past session ranges. I have also added the 50% ASR, which is also a super useful metric for reversals or continuations.
There is also a configurable UTC so that you can adjust the indicator so it can accurately measure the range within certain sessions.
Note - different session start and stop times vary from market to market. I have set the code to the standard forex market opens however, if you wish to change the time ,you are able to do so by editing the variables in the script
Enjoy :)
ATR - Asymmetric Turbulence Ribbon🧭 Asymmetric Turbulence Ribbon (ATR)
The Asymmetric Turbulence Ribbon (ATR) is an enhanced and reimagined version of the standard Average True Range (ATR) indicator. It visualizes not just raw volatility, but the structure, momentum, and efficiency of volatility through a multi-layered visual approach.
It contains two distinct visual systems:
1. A zero-centered histogram that expresses how current volatility compares to its historical average, with intensity and color showing speed and conviction
2. A braided ribbon made of dual ATR-based moving averages that highlight transitions in volatility behavior—whether volatility is expanding or contracting
The name reflects its purpose: to capture asymmetric, evolving turbulence in market behavior, through structure-aware volatility tracking.
_______________________________________________________________
🔧 Inputs (Fibonacci defaults)
ATR Length
Lookback period for ATR calculation (default: 13)
ATR Base Avg. Length
Moving average period used as the zero baseline for histogram (default: 55)
ATR ROC Lookback
Number of bars to measure rate of change for histogram color mapping (default: 8)
Timeframe Override
Optionally calculate ATR values from a higher or fixed timeframe (e.g., 1D) for macro-volatility overlay
Show Ribbon Fill
Toggles colored fill between ATR EMA and HMA lines
Show ATR MAs
Toggles visibility of ATR EMA and HMA lines
Show Crossover Markers
Shows directional triangle markers where ATR EMA and HMA cross
Show Histogram
Toggles the entire histogram display
_______________________________________________________________
📊 Histogram Component: Volatility Energy Profile
The histogram shows how far the current ATR is from its moving average baseline, centered around zero. This lets you interpret volatility pressure—whether it's expanding, contracting, or preparing to reverse.
To complement this, the indicator also plots the raw ATR line in aqua. This is the actual average true range value—used internally in both the histogram and ribbon calculations. By default, it appears as a slightly thicker line, providing a clear reference point for comparing historical volatility trends and absolute levels.
Use the baseline ATR to:
- Compare real-time volatility to previous peaks or troughs
- Monitor how ATR behaves near histogram flips or ribbon crossovers
- Evaluate volatility phases in absolute terms alongside relative momentum
The ATR line is particularly helpful for users who want to keep tabs on raw volatility values while still benefiting from the enhanced visual storytelling of the histogram and ribbon systems.
Each histogram bar is colored based on the rate of change (ROC) in ATR: The faster ATR rises or falls, the more intense the color. Meanwhile, the opacity of each bar is adjusted by the effort/result ratio of the price candle (body vs. range), showing how much price movement was achieved with conviction.
Color Interpretation:
🔴 Red
Strong volatility expansion
Market entering or deepening into a volatility burst
Seen during breakouts, panic moves, or macro shock events
Often accompanied by large real candle bodies
🟠 Orange
Moderate volatility expansion
Heating up phase, often precedes breakouts
Common in strong trending environments
Signals tightening before acceleration
🟡 Yellow
Mild volatility increase
Transitional state—energy building, not yet exploding
Appears in early trend development or pullbacks
🟢 Green
Mild volatility contraction
ATR cooling off
Seen during consolidation, reversion, or range balance
Good time to assess upcoming directional setups
🔵 Aqua
Moderate compression
Volatility is clearly declining
Signals consolidation within larger structure
Pre-breakout zones often form here
🔵 Deep Blue
Strong volatility compression
Market is coiling or dormant
Can signal upcoming squeeze or fade environment
Often followed by sharp expansion
Opacity scaling:
Brighter bars = efficient, directional price action (strong bodies)
Faded bars = indecision, chop, absorption, or wick-heavy structure
Together, color and opacity give a 2D view of market volatility: Hue = the type and direction of volatility
Opacity = the quality and structure behind it
Use this to gauge whether volatility is rising with conviction, fading into neutrality, or compressing toward breakout potential.
_______________________________________________________________
🪡 Ribbon Component: Volatility Rhythm Structure
The ribbon overlays two moving averages of ATR:
EMA (yellow) – faster, more reactive
HMA (orange) – smoother, more rhythmic
Their relationship creates the ribbon logic:
Yellow fill (EMA > HMA)
Short-term volatility is increasing faster than the longer-term rhythm
Signals active expansion and engagement
Orange fill (HMA > EMA)
Volatility is decaying or leveling off
Suggests possible exhaustion, pullback, or range
Crossover triangle markers (optional, off by default to avoid clutter) identify the moment of shift in volatility phase.
The ribbon reflects the shape of volatility over time—ideal for mapping cyclical energy shifts, transitional states, and alignment between current and average volatility.
_______________________________________________________________
📐 Strategy Application
Use the Asymmetric Turbulence Ribbon to:
- Detect volatility expansions before breakouts or directional runs
- Spot compression zones that precede structural ruptures
- Visually separate efficient moves from noisy market activity
- Confirm or fade trade setups based on underlying energy state
- Track the volatility environment across multiple timeframes using the override
_______________________________________________________________
🎯 Ideal Timeframes
Designed to function across all timeframes, but particularly powerful on intraday to daily ranges (1H to 1D)
Use the timeframe override to anchor your chart in higher-timeframe volatility context, like daily ATR behavior influencing a 1H setup.
_______________________________________________________________
🧬 Customization Tips
- Increase ATR ROC Lookback for smoother color transitions
- Extend ATR Base Avg Length for more macro-driven histogram centering
- Disable the histogram for ribbon-only rhythm view
- Use opacity and color shifts in the histogram to detect stealth energy builds
- Align ATR phases with structure or order flow tools for high-quality setups

Average True Range with MultiplierRelease Summary – ATR with Risk Management Tool (v6)
This script introduces an enhanced Average True Range (ATR) indicator with a user-defined multiplier and integrated risk management table. Users can choose from multiple smoothing methods (SMA, EMA, RMA, WMA) and dynamically calculate risk parameters including:
ATR and ATR × Multiplier
Dollar risk based on account size (1% default)
Position sizing (lot size)
Stop Loss and Take Profit levels (3× reward)
A built-in customizable table displays all calculated values for quick reference. The indicator is fully configurable and designed for precision risk management directly on the chart.

Breaking Structures (javieresfeliz)This TradingView script is designed to identify market structure changes, using a break of highs and lows approach, as well as technical indicators such as ATR, RSI, and EMAs (Exponential Moving Averages). It is aimed at detecting bullish and bearish trends, signaling possible entry and exit points based on various factors. It also offers additional confirmations to avoid false signals and provides a clear visualization of buy and sell signals.
Main Features:
Indicators Used:
ATR (Average True Range): Used to calculate a volatility range, which helps set stop-loss levels and price targets based on the current market volatility.
EMAs (50 and 200): Exponential Moving Averages (EMAs) are used to determine the short-term and long-term trends. The 50-period EMA is used to identify the short-term trend, while the 200-period EMA is used to identify the long-term trend.
RSI (Relative Strength Index): Used to identify overbought or oversold conditions in the market, providing additional buy or sell signals.
Volume: Used to confirm the validity of a signal. An increase in volume can confirm a structure break and provide more reliability to the signal.
Break of Structure Detection (BOS):
Bullish Break: Generated when the price surpasses previous highs.
Bearish Break: Generated when the price falls below previous lows.
Change of Character (CHOCH):
Bullish Trend: Defined by a close above the open and above the 50 EMA.
Bearish Trend: Defined by a close below the open and below the 50 EMA.
Buy and Sell Conditions:
Buy (Long): Activated when several conditions are met, including a bullish change of character, a bullish structure break, the price closing above the previous value plus a multiple of the ATR, and additional confirmations from RSI and volume.
Sell (Short): Activated when several conditions are met, including a bearish change of character, a bearish structure break, the price closing below the previous value minus a multiple of the ATR, with additional confirmations from RSI and volume.
Entry and Exit Signals:
Long Entry (Buy): Executed when the buy conditions are met.
Short Entry (Sell): Executed when the sell conditions are met.
Position Close: Positions are closed when the price crosses below (for long positions) or above (for short positions) the 50 EMA.
Historical Highs and Lows Lines:
The script draws lines of historical highs and lows from the last 288 and 60 periods to show key support and resistance levels on the chart.
Signal Table Across Multiple Timeframes:
The script displays a table in the top-right corner of the chart with indicators like the EMA trend, RSI value, and MACD histogram for timeframes of 1 minute, 5 minutes, 30 minutes, 1 hour, 4 hours, daily, and weekly.
Precautions:
Does not guarantee profits: Although the script is designed to detect structure breaks and possible trend changes, it does not guarantee 100% profitable signals. The market is always subject to risk and unpredictable volatility.
Requires adjustments for each asset: Parameters such as ATR length and EMA lengths should be adjusted according to the asset being analyzed and market conditions.
Use of additional confirmations: To reduce false signals, the script uses additional confirmations like RSI and volume, but it is always recommended to perform additional analysis before making trading decisions.
Changing trends: The change of character (CHOCH) can be a useful indicator, but it can give false signals in highly volatile markets or during prolonged consolidations.
Relies on historical data: This script relies on historical data to identify highs and lows. It does not consider fundamental events that may significantly impact the market.
Requires constant monitoring: Although the signals are automated, it is important to monitor open positions and make adjustments if market conditions change.
Risk of false signals: In low liquidity markets or consolidations, structure breaks can be false, so it’s recommended to pay attention to any additional confirmation signals or use a proper risk management strategy.

Volatility Layered Supertrend [NLR]We’ve all used Supertrend, but do you know where to actually enter a trade? Volatility Layered Supertrend (VLS) is here to solve that! This advanced trend-following indicator builds on the classic Supertrend by not only identifying trends and their strength but also guiding you to the best trade entry points. VLS divides the main long-term trend into “Strong” and “Weak” Zones, with a clear “Trade Entry Zone” to help you time your trades with precision. With layered trends, dynamic profit targets, and volatility-adaptive bands, VLS delivers actionable signals for any market.
Why I Created VLS Over a Plain Supertrend
I built VLS to address the gaps in traditional Supertrend usage and make trade entries clearer:
Single-Line Supertrend Issues: The default Supertrend sets stop-loss levels that are too wide, making it impractical for most traders to use effectively.
Unclear Entry Points: Standard Supertrend doesn’t tell you where to enter a trade, often leaving you guessing or entering too early or late.
Multi-Line Supertrend Enhancement: Many traders use short, medium, and long Supertrends, which is helpful but can lack focus. In VLS, I include Short, Medium, and Long trends (using multipliers 1 to 3), and add multipliers 4 and 5 to track extra long-term trends—helping to avoid fakeouts that sometimes occur with multiplier 3.
My Solution: I focused on the main long-term Supertrend and split it into “Weak Zone” and “Strength Zone” to show the trend’s reliability. I also defined a “Trade Entry Zone” (starting from the Mid Point, with the first layer’s background hidden for clarity) to guide you on where to enter trades. The zones include Short, Medium, and Long Trend layers for precise entries, exits, and stop-losses.
Practical Trading: This approach provides realistic stop-loss levels, clear entry points, and a “Profit Target” line that aligns with your risk tolerance, while filtering out false signals with longer-term trends.
Key Features
Layered Trend Zones: Short, Medium, Long, and Extra Long Trend layers (up to multipliers 4 and 5) for timing entries and exits.
Strong & Weak Zones: See when the trend is reliable (Strength Zone) or needs caution (Weak Zone).
Trade Entry Zone: A dedicated zone starting from the Mid Point (first layer’s background hidden) to show the best entry points.
Dynamic Profit Targets: A “Profit Target” line that adjusts with the trend for clear goals.
Volatility-Adaptive: Uses ATR to adapt to market conditions, ensuring reliable signals.
Color-Coded: Green for uptrends, red for downtrends—simple and clear.
How It Works
VLS enhances the main long-term Supertrend by dividing it into two zones:
Weak Zone: Indicates a less reliable trend—use tighter stop-losses or wait for the price to reach the Trade Entry Zone.
Strength Zone: Signals a strong trend—ideal for entries with wider stop-losses for bigger moves.
The “Trade Entry Zone” starts at the Mid Point (last layer’s background hidden for clarity), showing you the best area to enter trades. Each zone includes Short, Medium, Long, and Extra Long Trend sublevels (up to multipliers 4 and 5) for precise trade timing and to filter out fakeouts. The “Profit Target” updates dynamically based on trend direction and volatility, giving you a clear goal.
How to Use
Spot the Trend: Green bands = buy, red bands = sell.
Check Strength: Price in Strength Zone? Trend’s reliable—trade confidently. In Weak Zone? Use tighter stops or wait.
Enter Trades: Use the “Trade Entry Zone” (from the Mid Point upward) for the best entry points.
Use Sublevels: Short, Medium, Long, and Extra Long layers in each zone help fine-tune entries and exits.
Set Targets: Follow the Profit Target line for goals—it updates automatically.
Combine Tools: Pair with RSI, MACD, or support/resistance for added confirmation.
Settings
ATR Length: Adjust the ATR period (default 10) to change sensitivity.
Up/Down Colors: Customize colors—green for up, red for down, by default.

ATRs in Days📌 ATR in Days
This script tracks how price moves in relation to ATR over multiple days, providing a powerful volatility framework for traders.
🔹 Key Features:
✅ 4 ATRs in 5 Days – Measures if a stock has moved 4x its ATR within the last 5 days, identifying extreme volatility zones.
✅ Daily ATR Calculation – Tracks average true range over time to gauge market conditions.
✅ Clear Table Display – Real-time ATR readings for quick decision-making.
✅ Intraday & Swing Trading Compatible – Works across multiple timeframes for day traders & swing traders.
📊 How to Use:
Look for stocks that exceed 4 ATRs in 5 days to spot extended moves.
Use ATR as a reversion or continuation signal depending on market structure.
🚀 Perfect for traders looking to quantify volatility & structure trades effectively!

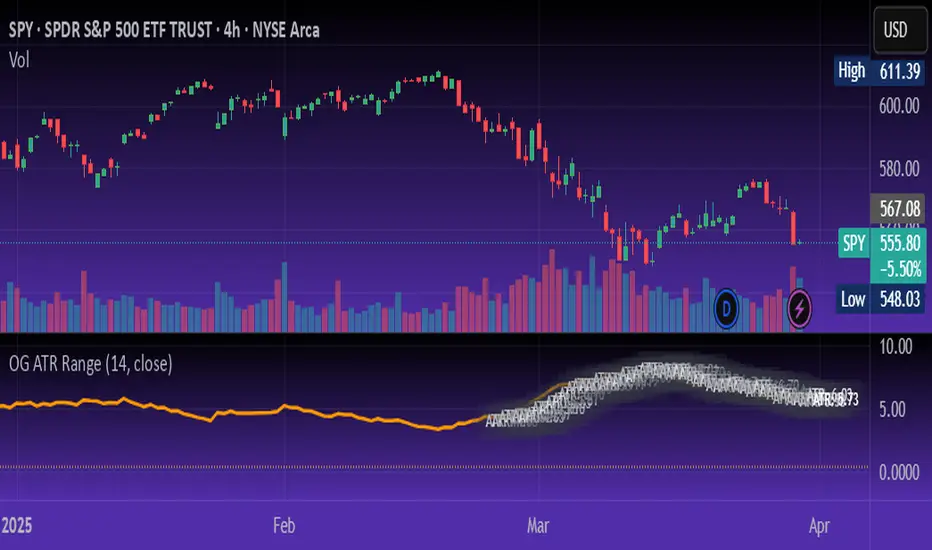
OG ATR RangeDescription:
The OG ATR Tool is a clean, visualized version of the Average True Range indicator for identifying volatility, stop-loss levels, and realistic price movement expectations.
How it works:
Calculates the average range (in points/pips) of recent candles.
Overlays ATR bands to help define breakout potential or squeeze zones.
Can be used to size trades or set dynamic stop-loss and target levels.
Best for:
Intraday traders who want to avoid unrealistic targets.
Volatility-based setups and breakout strategies.
Creating position sizing rules based on instrument volatility.
Pro Tip: Combine with your trend indicators to set sniper entries and exits that respect volatility.
ATR & PTR TableThe ATR & PTR Table Indicator displays a dynamic table that provides Average True Range (measures market volatility over 1D, 1W, and 1M timeframes), Price trading range (difference between the high and low prices over the same periods) & percentage of the typical range that has been traded. This indicator will help traders identify potential breakout zones and assess volatility across multiple timeframes.
This had been optimized to show ATR and PTR on every time frame. The (1D) represents ATR on whatever timeframe you are currently on.

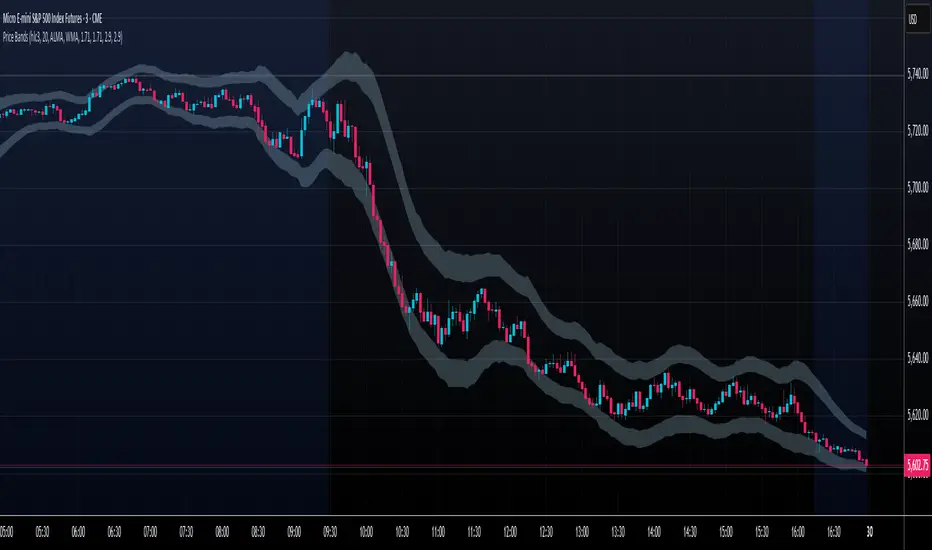
Price Extreme BandsPrice Extreme Bands Description
This indicator calculates and displays Price Extreme Bands based on an Exponential Moving Average (EMA) and True Range Average True Range (TR ATR). It utilizes a custom "Super Smoother" function to smooth the bands, providing a clearer representation of potential price extremes without sacrificing accuracy.
Usage
Built for specifically for intraday timeframes, this indicator identifies short term price extremes and volatility ranges. Traders can observe when price moves towards the outer bands, suggesting strong momentum or potential overbought/oversold conditions. The filled zones highlight areas of increased volatility which can used as exit criteria for a trade, possible reversal points in ranging markets or price ranges where price momentum could slow in trending markets.
Key Features
Length Input: Controls the length of the EMA and TR ATR calculations.
Multiplier Inputs: Uses two fixed multipliers (1.71 and 2.50) to create bands.
Super Smoother: Applies a custom smoothing function to the bands for reduced noise.
Fill Zones: Fills the areas between the inner and outer bands to highlight potential volatility ranges.
Calculation:
1. EMA (Basis): Calculates the Exponential Moving Average of the selected source.
2. TR ATR: Calculates the True Range and then smoothes it using RMA (Rolling Moving Average).
3. Bands: Calculates upper and lower bands using the EMA and ATR, with multipliers of 1.71 and 2.50.
4. Super Smoother: Applies a smoothing function to the calculated bands.
Visuals:
Basis Line: Plots the EMA (basis) (invisible by default).
Inner Bands (1.71 Multiplier): Plots the smoothed bands with a distinct color (e.g., orange) (invisible by default).
Outer Bands (2.50 Multiplier): Plots the smoothed bands with a different color (e.g., purple) (invisible by default).
Fill Zones: Fills the region between the inner and outer upper bands and the inner and outer lower bands with a translucent color (e.g. light blue).
// Note: The plot lines are invisible by default. To view the basis, upper and lower band lines, adjust the visibility settings in the indicator's settings.
Uniqueness: Ready of the box. Code and parameters built specifically for 1m to 15m timeframes provides users with an indicator to easily identify price extremes. The use of TR ATR and addition of the Super Smoother calculation create a easier visualization and implementation compared to existing price band options.
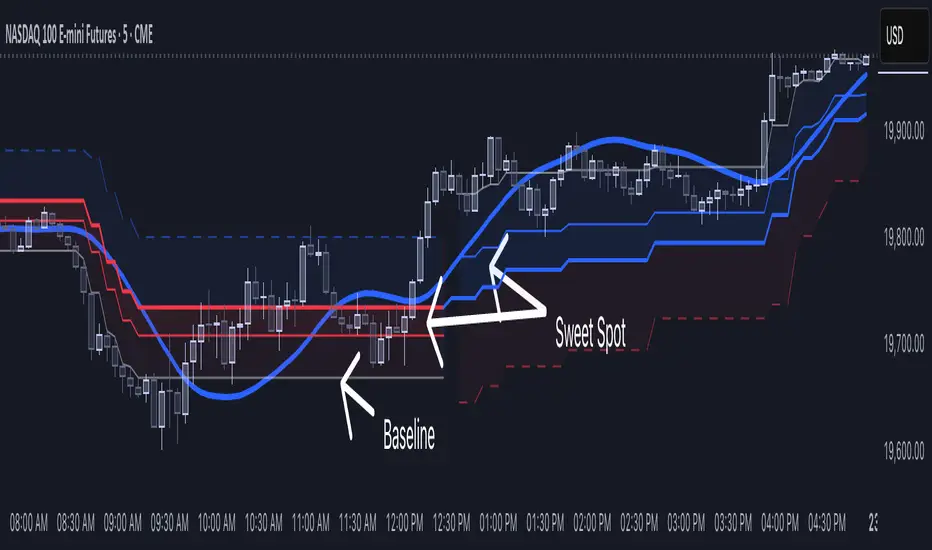
[NLR] - SweetSpot ZonesThe Sweet Spot Zone helps you find the best spots to enter a trade, inspired by the " Follow Line Indicator " by Dreadblitz (big thanks to him!). It draws a colored zone on your chart to show ideal entry points, with a Base Point to keep you on track.
What It Does
Blue Zone: Uptrend—buy when the price dips into the zone.
Red Zone: Downtrend—sell or short when the price climbs into the zone.
Base Point: A gray line showing the key level the zone is built on.
How to Use It
Look for the colored zone:
- Blue: Buy if the price dips into the zone but stays above the Base Point.
- Red: Sell/short if the price climbs into the zone but stays below the Base Point.
Important: Avoid entering trade beyond base point - you might see low returns and face big drawdowns.
Confirm with other signals (like RSI/MACD) before entering.
Settings
ATR Length (10): How far back it looks to calculate price movement.
ATR Multiplier (2.5): How wide the zone is.
Error Margin (5.0): Keeps the zone steady during small price wiggles.
Uptrend/Downtrend Colors: Change the zone colors if you’d like!
Credits
Inspired by the "Follow Line Indicator" by Dreadblitz—check out his work for more great ideas!
Smart Stop-Loss (SSL)Smart Stop-Loss (SSL) Indicator
Overview
The Smart Stop-Loss (SSL) indicator is an advanced risk management tool designed to help traders set dynamic stop-loss levels based on market structure, volatility, and momentum. Unlike traditional fixed stop-loss methods, SSL adapts to changing market conditions, helping to avoid premature exits while protecting capital during true reversals.
Key Features
1. Volatility-Based Adjustments
- Uses Average True Range (ATR) to measure market volatility
- Automatically widens stop-loss during volatile periods and tightens during calm markets
- Customizable ATR multiplier (default: 1.5x) to adjust sensitivity
2. Market Structure Integration
- Identifies significant swing highs and lows to establish support/resistance levels
- Places stop-loss levels beyond these structural points to avoid common stop hunts
3. Fair Value Gap (FVG) Detection
- Identifies imbalances in order flow that often lead to strong directional moves
- Bullish FVG: A gap up where the current high is below previous low
- Bearish FVG: A gap down where the current low is above previous high
4. Smart Stop-Loss Tightening
- Automatically tightens stop-loss when FVGs are mitigated (filled)
- Uses RSI as a momentum filter to prevent premature adjustments
- Creates a trailing effect that locks in profits as trades move favorably
How to Use
For Long Positions:
1. **Entry**: Look for bullish FVG formations (green step line appears)
2. **Stop-Loss Placement**: Set your stop at or slightly below the green step line
3. **Stop Adjustment**: When price closes above the FVG zone and RSI > 50, the stop will automatically tighten
4. **Exit**: Exit the position when price closes below the green line or when your profit target is reached
For Short Positions:
1. **Entry**: Look for bearish FVG formations (red step line appears)
2. **Stop-Loss Placement**: Set your stop at or slightly above the red step line
3. **Stop Adjustment**: When price closes below the FVG zone and RSI < 50, the stop will automatically tighten
4. **Exit**: Exit the position when price closes above the red line or when your profit target is reached
Real-World Examples
Example 1: Trend Continuation
In an uptrend, when a bullish FVG appears, it often indicates institutional buying pressure. The SSL will place a stop below the swing low with an ATR buffer. As price continues upward and mitigates the FVG, the SSL tightens to protect profits while allowing the trend to continue.
Example 2: Avoiding Premature Exits
During normal market fluctuations, traditional fixed stops might get triggered too early. The SSL's adaptive nature accounts for volatility, keeping you in profitable trades longer by positioning stops beyond noise levels.
Example 3: Protecting Against Reversals
When a true reversal occurs, the momentum filter (RSI) will confirm the change in direction, allowing the SSL to maintain wider protection rather than prematurely tightening in a false move.
Tips for Best Results
1. **Timeframe Selection**: Works best on 1H, 4H and daily charts where market structure is more reliable
2. **Combine with Trend Analysis**: Use in conjunction with trend identification tools
3. **ATR Adjustment**: Increase the ATR multiplier for more volatile instruments
4. **Alert Setup**: Configure the built-in alerts to notify you when stop levels are breached
5. **Visual Confirmation**: The labels show exact stop values to help with order placement
Disclaimer
This indicator is provided for informational and educational purposes only. While it uses advanced techniques to determine potential stop-loss levels, no indicator can predict market movements with certainty. Always manage your risk appropriately and never risk more than you can afford to lose. Past performance is not indicative of future results. The developer of this indicator accepts no liability for trading losses incurred from its use. Always test thoroughly on demo accounts before using in live trading.

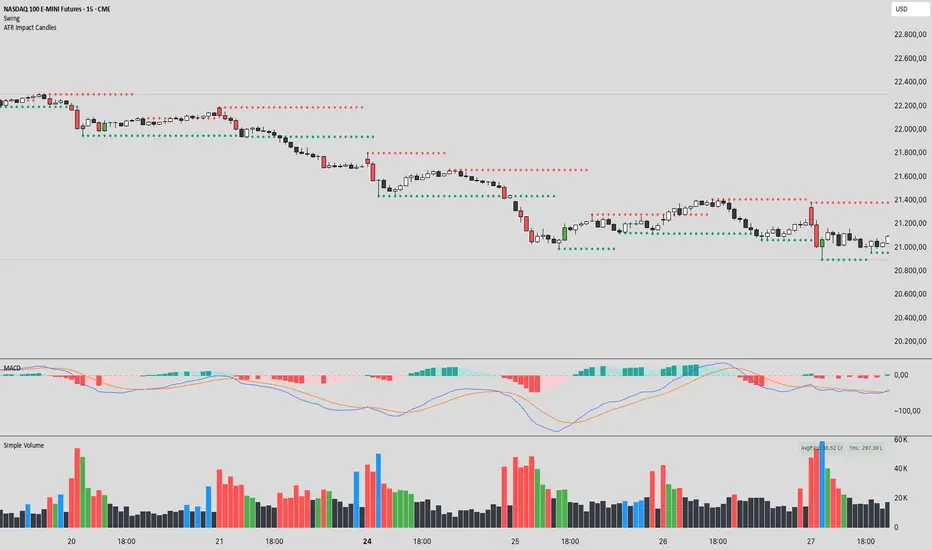
ATR Impact CandlesATR Impact Candles: Simplify Your Trading with Pure Price Action
You don’t need dozens of cluttered indicators to catch what really matters. With ATR Impact Candles, you get a powerful, single-tool solution that cuts through the noise by focusing on what truly drives the market: price action and volatility. This indicator highlights only those candlesticks that pack a punch—showing you when the market’s range is exceptionally strong relative to its recent behavior. Whether you’re a scalper or a swing trader, ATR Impact Candles empowers you to time your entries and exits with confidence, letting you trade based on real market momentum.
⸻
Indicator Overview
The indicator is designed for TradingView and is implemented in Pine Script (version 5). Its primary purpose is to highlight specific candles that meet a defined volatility condition based on the Average True Range (ATR). Instead of modifying every candle’s appearance, the indicator only changes the color of those “signal” candles that exceed a user-defined multiple of the ATR. The rest of the candles remain in their traditional black and white appearance—preserving the classic candlestick chart look.
⸻
Key Features
1. ATR-Based Signal Identification:
• ATR Calculation:
The indicator calculates the ATR using a configurable lookback period (default is 14 periods). The ATR is a common volatility measure that reflects the average range of price movement.
• Threshold Condition:
A candle is flagged as a signal if its range (high minus low) meets or exceeds a specified multiple (the “ATR Factor”) of the ATR. By default, this factor is set to 2, meaning any candle whose range is at least twice the ATR is considered significant.
2. Dynamic Candle Coloring:
• Signal Candles:
• When a candle meets the ATR threshold condition:
• Up Candles: are colored green.
• Down Candles: are colored red.
• Non-Signal Candles:
• Candles that do not meet the threshold condition retain their classic appearance:
• Up candles are white.
• Down candles are black.
3. User Configurability:
• ATR Period:
Traders can adjust the ATR period to tailor the volatility measure to different markets or timeframes.
• ATR Factor:
The multiple of the ATR that defines a signal candle is also configurable, giving flexibility to experiment with different thresholds for what constitutes “significant” price movement.
• Overlay Display:
The indicator runs in overlay mode on the chart, meaning it directly affects the appearance of the candlestick bars without interfering with other chart elements.
4. Additional Visual Aid:
• Threshold Line Plot:
The script optionally plots a line representing the ATR multiplied by the chosen factor. This line serves as a visual benchmark on the chart, allowing traders to see at what level the ATR threshold lies relative to the price action.
⸻
How It Works
1. ATR Calculation:
The indicator first calculates the Average True Range (ATR) for the defined period. This value is updated for each new candle.
2. Range Comparison:
For each candle, the indicator calculates the range (high - low) and compares it to the threshold, which is the ATR multiplied by the user-defined factor.
3. Conditional Coloring:
• If the Candle’s Range ≥ (ATR * Factor):
• The candle is marked as a “signal candle.”
• Its color is set to green if it is an up candle (close is greater than or equal to open) or red if it is a down candle.
• Otherwise:
• The candle retains its classic look, with up candles in white and down candles in black.
4. Chart Display:
By applying these rules to every candle, the indicator visually emphasizes those moments when the market shows unusually large price movements relative to its recent average volatility. This helps traders quickly spot potential breakouts or reversals.
⸻
Practical Applications
• Volatility Breakouts:
Identify candles that may signal the start of a breakout or strong reversal.
• Risk Management:
Adjust stop-loss levels or position sizes when unusually volatile candles are detected.
• Signal Confirmation:
Combine with other technical indicators or chart patterns to reinforce entry or exit decisions.
⸻
ATR Impact Candles is your essential, no-nonsense tool for filtering out market noise and focusing solely on significant price action. Simplify your trading decisions and harness the power of volatility with one clear, effective indicator.