KIMATIX VWAP/EMA System (by ASCE)**KIMATIX VWAP/EMA System (by ASCE)**
A precision-built intraday framework for momentum, structure, and liquidity timing.
**Why this indicator exists**
Most traders see movement, but not context. They enter too late, chase momentum, or fade reversals without understanding where institutional players react.
This tool solves that problem by combining two of the most powerful structural concepts in intraday price discovery:
Trend alignment through EMAs
Liquidity reaction zones through VWAPs
Together, they provide directional clarity, timing, and trade location.
**Core Components**
**Three Trend EMAs**
• **EMA 7** – Microtrend and momentum speed
• **EMA 23** – Intraday trend leadership
• **EMA 50** – Higher-timeframe structure anchor
This trio shows how price accelerates, slows, flips bias, or compresses.
**Three Volume-Weighted Average Prices**
• **Daily VWAP** – Primary scalper reference point
• **Weekly VWAP** – Bias filter and intermediate balance zone
• **Monthly VWAP** – High-impact “magnet” where major reactions occur
VWAP represents the fair value where volume is distributed.
When price taps, rejects, or reclaims these levels, liquidity flow shifts — ideal for scalp-to-swing entries.
**What it helps you see**
• When price is aligned with or diverging from trend
• Where momentum will expand or fail
• Which levels larger participants defend
• Where the highest-probability reaction zones form
This is not a signal tool — it is a structure and decision-making framework used by professional intraday traders.
**How to use it**
1. **Trade with VWAP alignment** – expect reactions at daily/weekly/monthly VWAPs
2. **Follow EMA flow** – when EMAs compress or flip, momentum changes
3. **Look for price interaction** – rejection, reclaim, or breakthrough of a VWAP often leads to fast moves
Ideal for scalping, day-trading, futures, FX, indices, crypto, and metals.
**Customization**
Colors for each EMA and each VWAP can be personalized, allowing alignment with your charting workflow.
**Final Notes**
This system gives you the *context* most traders miss — where trend meets liquidity.
Use it as a roadmap to understand where price *should* react and when momentum is likely to shift.
Média de Amplitude de Variação (ATR)

Combined: Net Volume, RSI & ATR# Combined: Net Volume, RSI & ATR Indicator
## Overview
This custom TradingView indicator overlays **Net Volume** and **RSI (Relative Strength Index)** on the same chart panel, with RSI scaled to match the visual range of volume spikes. It also displays **ATR (Average True Range)** values in a table.
## Key Features
### Net Volume
- Calculates buying vs selling pressure by analyzing lower timeframe data
- Displays as a **yellow line** centered around zero
- Automatically selects optimal timeframe or allows manual override
- Shows net buying pressure (positive values) and selling pressure (negative values)
### RSI (Relative Strength Index)
- Traditional 14-period RSI displayed as a **blue line**
- **Overlays directly on the volume chart** - scaled to match volume spike heights
- Includes **70/30 overbought/oversold levels** (shown as dotted red/green lines)
- Adjustable scale factor to fine-tune visual sizing relative to volume
- Optional **smoothing** with multiple moving average types (SMA, EMA, RMA, WMA, VWMA)
- Optional **Bollinger Bands** around RSI smoothing line
- **Divergence detection** - identifies regular bullish/bearish divergences with labels
### ATR (Average True Range)
- Displays current ATR value in a **table at top-right corner**
- Configurable period length (default: 50)
- Multiple smoothing methods: RMA, SMA, EMA, or WMA
- Helps assess current market volatility
## Use Cases
- **Momentum & Volume Confirmation**: See if RSI trends align with net volume flows
- **Divergence Trading**: Automatically spots when price makes new highs/lows but RSI doesn't
- **Volatility Assessment**: Monitor ATR for position sizing and stop-loss placement
- **Overbought/Oversold + Volume**: Identify exhaustion when RSI hits extremes with volume spikes
## Customization
All components can be toggled on/off independently. RSI scale factor allows you to adjust how prominent the RSI line appears relative to volume bars.

Brahmastra Basic1. Core Purpose and Strategy
This is a multi-timeframe (MTF) indicator designed to identify high-probability entry points for a specific trend-following options selling strategy. It works by confirming a trend on higher timeframes (Daily and Hourly) before waiting for a precise entry trigger on a lower timeframe (15-Minute).
The core principle is confluence: ensuring that the Daily trend bias and the Hourly trend momentum are aligned before looking for a trade. This filters out many false signals that can occur when trading on a single timeframe.
IMPORTANT: This indicator MUST be applied to a 15-minute chart to function correctly.
2. How to Read the Visual Signals on Your Chart
The indicator provides several visual cues to guide you through the trading setup from start to finish.
A. Candle Colors: The "Setup is Ready" Signal
The primary signal to start paying attention is the change in candle color.
Aqua Candles: The market is in a Bullish Alignment. This means both the Daily and Hourly trends are bullish. You should now be preparing for a Put Sell entry. The very first aqua candle in a sequence is your "alert candle."
Yellow Candles: The market is in a Bearish Alignment. This means both the Daily and Hourly trends are bearish. You should now be preparing for a Call Sell entry. The very first yellow candle in a sequence is your "alert candle."
B. Entry Signals: The "Execute Trade" Signal
These signals appear only after the alert candle's level has been breached.
Green "PUT SELL" Label (below candle): This is your signal to enter a Put Sell (or a long position). It appears on the close of the 15-minute candle that breaks above the high of the first aqua alert candle.
Red "CALL SELL" Label (above candle): This is your signal to enter a Call Sell (or a short position). It appears on the close of the 15-minute candle that breaks below the low of the first yellow alert candle.
C. Exit Signals: The "Close Position" Signal
Red 'X' (above candle): This is the signal to close your Put Sell position. It appears when the primary daily trend has reversed to bearish.
Green 'X' (below candle): This is the signal to close your Call Sell position. It appears when the primary daily trend has reversed to bullish.
D. Background & EMA Lines: The "Context"
EMA Lines: The indicator plots two key EMAs from the higher timeframes onto your 15-minute chart so you can see the context.
Orange Line: Daily 5 EMA
Blue Line: Hourly 51 EMA
Faint Background Color: After an entry signal appears, the background will remain faintly colored (green for a bullish trade, red for a bearish trade) to remind you that you are in a hypothetical position.
3. The Step-by-Step Strategy Logic
Here is the precise set of rules the indicator follows to generate its signals:
For a PUT Sell (Bullish Trade):
Alignment Check: The indicator first confirms that:
The Daily Close is above the Daily 5 EMA.
AND the Hourly Close is above the Hourly 51 EMA.
Alert Phase: As soon as this alignment is true, the 15-minute candles turn aqua. The indicator internally notes the high of the very first aqua candle.
Entry Trigger: The indicator waits for a 15-minute candle to close above the high of that first alert candle. When this happens, the green "PUT SELL" label is plotted.
Exit Condition: The position is held until the Daily Close crosses back below the Daily 5 EMA. When this happens, the red 'X' exit signal is plotted.
For a CALL Sell (Bearish Trade):
Alignment Check: The indicator first confirms that:
The Daily Close is below the Daily 5 EMA.
AND the Hourly Close is below the Hourly 51 EMA.
Alert Phase: As soon as this alignment is true, the 15-minute candles turn yellow. The indicator internally notes the low of the very first yellow candle.
Entry Trigger: The indicator waits for a 15-minute candle to close below the low of that first alert candle. When this happens, the red "CALL SELL" label is plotted.
Exit Condition: The position is held until the Daily Close crosses back above the Daily 5 EMA. When this happens, the green 'X' exit signal is plotted.

ATR Levels by TabbyATR levels refer to the horizontal lines plotted on a chart based on the Average True Range (ATR) indicator, which measures market volatility, not direction, by showing average price movement over time, helping traders set dynamic stops, targets (like 1x, 2x ATR), and identify potential breakouts or consolidation areas by observing if price moves are larger or smaller than the average range.
TradeAxis Trendlines [XAUUSD]Rule-based trendline framework for XAUUSD built specifically for intraday trendline traders on TradingView.
This script automatically maps filtered trendlines and uses several internal algorithms to evaluate and organize key structures. The indicator includes a range of settings so you can test what works best for your own approach, and it also provides a pre-tested configuration as a recommended starting point.
Important notes:
• Designed and tested for XAUUSD, 15-minute timeframe.
• The script does not execute trades or manage orders – it only plots structure.
• This is not financial or investment advice. All trading decisions and risk remain your responsibility.
This is an invite-only script.

Chaos Volatility Breakout (ATR + Breakout)-VMThis indicator is a volatility-based breakout trading tool inspired by principles from Chaos Theory, where small changes in momentum during high-energy market conditions can lead to large price movements.
Instead of predicting the market, it focuses on identifying “high-probability expansion zones”—moments when the market is under stress (high volatility) and price is breaking out of a recent range.

Pure xATR ProUncover the hidden rhythm of the market with Pure xATR Pro. This indicator is designed for serious traders who need to understand "Price Extension". It calculates the precise distance between the price and the baseline Moving Average (MA) relative to market volatility (ATR). Instead of guessing top and bottom, visualize exactly where the price stands in the cycle—from extreme panic selling to euphoric profit-taking.
Key Features:
4-Stage Market Zoning System:
Panic Zone (Oversold): Identifies extreme price drops (statistically rare deviations). Often presents high-reward mean reversion opportunities.
Buy Zone (Entry): The sweet spot for trend initiation.
Hold / Winner Zone: Detects strong momentum. Keeps you in the trade while the trend is healthy (Ride the trend).
Profit Taking Zone (Overbought): signals when the price is statistically overextended and liable to pullback.
Adaptive Volatility Logic:
Includes a dynamic algorithm that analyzes historical volatility (Lookback Period) to automatically adjust Overbought/Oversold percentiles, adapting to changing market conditions.
Professional Dashboard:
Real-time Status: Displays current Zone, Volatility State (Breakout/Normal), and Actionable Advice.
Risk Management: Auto-calculates Dynamic Stop Loss (based on Supertrend, ATR, or MA) and Fixed % Risk.
Multi-Level Targets: Automatically projects 3 profit targets (TP) based on ATR multiples.
Clean & Customizable Visuals:
Smart Highlighting: Background colors automatically highlight key zones (Panic/Buy/Hold/Profit).
Style Control: Full color customization available directly in the "Style" tab for a clutter-free input menu.
------------------
ค้นพบจังหวะที่แท้จริงของตลาดด้วย Pure xATR Pro อินดิเคเตอร์ระดับมืออาชีพที่ออกแบบมาเพื่อวิเคราะห์ "ระยะการยืดตัวของราคา" (Price Extension) โดยคำนวณระยะห่างระหว่างราคากับเส้นค่าเฉลี่ย (MA) เทียบกับความผันผวน (ATR) ช่วยให้คุณเห็นภาพชัดเจนว่าราคา ณ ปัจจุบันอยู่ในสถานะใด ตั้งแต่จุดที่คนเทขายด้วยความตกใจ (Panic) ไปจนถึงจุดที่ราคาแพงเกินไปและควรขายทำกำไร
ฟีเจอร์หลัก (Key Features):
ระบบแบ่งโซนตลาด 4 ระดับ (4-Stage Zoning):
Panic Zone (โซนของถูก/Oversold): จับจังหวะที่ราคาดิ่งลงแรงผิดปกติ ซึ่งมักเป็นจุดกลับตัวที่ให้ผลตอบแทนสูง (High Reward)
Buy Zone (โซนสะสม): จุดเริ่มต้นของเทรนด์ เป็นระยะปลอดภัยในการเข้าออเดอร์
Hold / Winner Zone (โซนรันเทรนด์): แยกแยะช่วงที่เทรนด์แข็งแกร่ง ให้คุณ "ถือสถานะต่อ" (Let Profit Run) ไม่ขายหมู
Profit Taking Zone (โซนขายทำกำไร): แจ้งเตือนเมื่อราคาวิ่งไปไกลเกินค่าเฉลี่ยทางสถิติ (Overextended) เพื่อพิจารณาขาย
ระบบปรับตัวตามความผันผวน (Adaptive Logic):
อัลกอริทึมอัจฉริยะที่คำนวณค่า Percentile ย้อนหลัง เพื่อปรับระดับ Overbought/Oversold ให้เหมาะสมกับสภาวะตลาดที่เปลี่ยนไปโดยอัตโนมัติ
หน้าปัดสถานะครบวงจร (Professional Dashboard):
แสดงสถานะปัจจุบัน (Action), ระดับความผันผวน, และคำแนะนำแบบ Real-time
Risk Management: คำนวณจุด Stop Loss ให้อัตโนมัติ (เลือกสูตรได้: Supertrend, ATR, หรือ MA)
Target Projection: คำนวณเป้าหมายทำกำไร (TP) ให้ล่วงหน้า 3 ระดับตามระยะ ATR
กราฟสะอาดตา ปรับแต่งง่าย (Clean Visuals):
Smart Highlight: ไฮไลท์สีพื้นหลังตามโซนต่างๆ อัตโนมัติ (Panic/Buy/Hold/Profit) ทำให้ดูเทรนด์ง่ายเพียงกวาดตา
Customizable: ปรับแต่งสีและความโปร่งใสได้อิสระผ่านแถบ "Style" เพื่อกราฟที่ดูเป็นระเบียบและไม่รกสายตา

Volatility Radar [upslidedown]💎 Overview
Volatility Radar visualizes extreme volatility conditions in a clean, intuitive oscillator format.
Unlike traditional momentum oscillators, it transforms average true range (ATR) behavior into a directional volatility structure, making it easier to spot moments when markets may be shifting into expansion, compression, or potential pivot zones.
💎 How to Use
The oscillator highlights moments when the internal volatility condition becomes active as well as when that condition breaks. These events may coincide with structural turning points, breakout conditions, or volatility expansions. While not a prediction tool, Volatility Radar helps traders identify moments worth paying closer attention to.
💎 Signal Markers
■ Square icons on top/bottom identify when the Volatility Radar condition is ACTIVE
▲▼ Triangle icons on top/bottom identify when the Volatility Radar condition BREAKS
📌 Chart Example:
💎 Oscillator Trends
One of the core features of Volatility Radar is its ability to highlight positive or negative volatility trends. The oscillator automatically colors its components to reflect uptrending vs. downtrending volatility structure, making trend context easier to interpret at a glance.
📌 Chart Example:
💎 Histogram Trends
For users who prefer a more compact or traditional visual style, Volatility Radar includes an optional histogram display mode. This mode provides a clean representation of the detected trend and can be helpful for validating price-action concepts within the broader volatility context.
📌 Chart Example:
💎 Volatility Moving Average
The yellow moving average line offers a volatility moving average that can aid in determining longer term trend strength.
Interpret the trend direction by observing whether the average is increasing/decreasing or above/below the zero line.
Reversals may be observed when values move into oversold territories.
Trend continuation may occur during periods when the average is near the zero line.
Evaluate opportunities when the moving average is "touched" or "pinged" by the radar line (setting available to highlight these crosses).
📌 Chart Example:
💎 Backtesting Support
Volatility Radar outputs external signals designed for use with automated backtesting on TradingView. It integrates with @jason5480’s open-source Template Trailing Strategy and its supporting signal libraries.

Aydan Scalper v2This indicator, called the Aydan Scalper, combines an 8-period EMA (plotted in green) and a 20-period EMA (plotted in red) to identify buy and sell signals based on their crossovers. When the green 8 EMA crosses above the red 20 EMA from below, it signals a buy opportunity. Conversely, when the green 8 EMA crosses below the red 20 EMA from above, it signals a sell opportunity. Additionally, an ATR (Average True Range) indicator is included to gauge market volatility. This combination helps scalpers make informed trading decisions on a one-minute chart.”

QFT MTF Range DetectorQFT MTF Range Detector — QuantumFlowTrader
Description:
The QFT MTF Range Detector is a multi-timeframe (MTF) tool designed to identify consolidation zones or ranging conditions across multiple intraday timeframes — from 1 minute up to 4 hours. This indicator is optimized for high-frequency trading environments such as scalping and day trading.
How it works:
For each selected timeframe, the indicator evaluates five key technical conditions:
- Low ADX (less than 17) – suggesting weak trend strength.
- Range width within a specific normalized threshold.
- Normalized ATR (volatility filter) in a defined range.
- RSI near the neutral zone (40–60) with low volatility.
- Price proximity to the mid-range (consolidation center).
Each condition contributes a score. If at least 3 out of 5 conditions are met, that timeframe is considered to be in a range (consolidation).
Visual output:
A compact table is displayed on the chart showing all selected timeframes:
Black box = Timeframe is in a range (consolidation).
Purple box = Not in a range (likely trending or volatile).
Timeframes are labeled (e.g., "4H", "15M") for clarity.
Customization:
Choose display corner (top/bottom, left/right).
Enable or disable table borders.
Set custom colors for range and non-range signals.
Use case:
Traders can quickly assess which timeframes are in a range, helping them:
Avoid choppy markets,
Time entries and exits better,
Confirm multi-timeframe alignment.
Note: This is not a buy/sell signal indicator. It is a market condition filter to enhance decision-making.

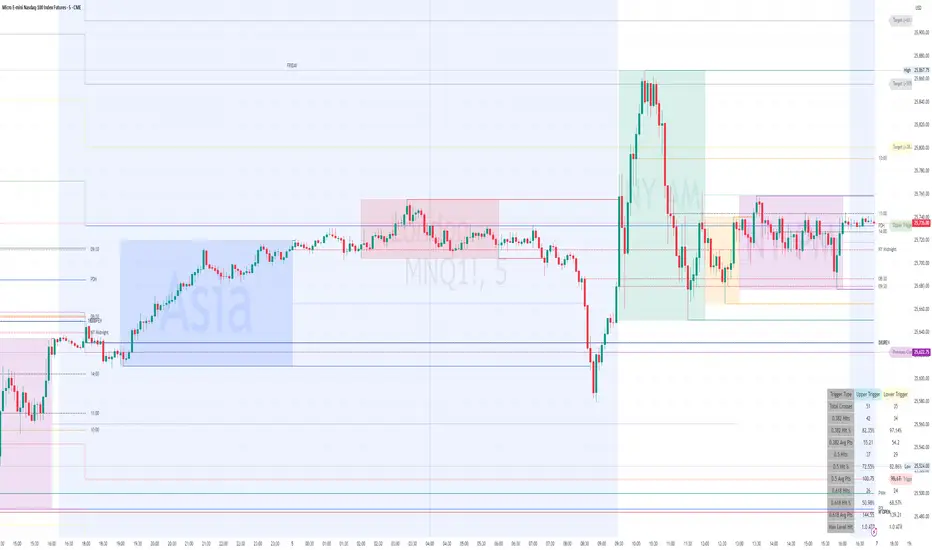
QuantumFlowTrader V1QuantumFlowTrader V1 — Adaptive Institutional Flow Framework
Overview
QuantumFlowTrader V1 is a precision-built visual tool that fuses institutional structure, dynamic volatility, and balance zones into one unified system.
It is designed to help traders align with the market’s internal flow without relying on lagging indicators or fixed settings.
Core Components
1. Adaptive EMA Clouds — Structural Flow
Layered exponential moving averages adapt to current conditions, clearly showing when market structure is aligned or in transition. Cloud color and intensity adjust automatically to reflect real-time directional bias.
2. Dynamic VWAP + Deviation Zones
Includes a self-adjusting VWAP with optional deviation bands (VWAP Deviation Zones) that reflect institutional fair-value areas — places where price often reacts, pauses, or mean-reverts.
The VWAP line shifts color based on price positioning.
3. Quantum ATR Engine — Multi-Layer Volatility Sync
A proprietary multi-ATR engine detects when volatility signals align in one direction across multiple sensitivities.
Arrows appear only on full directional agreement, signaling high-conviction flow moments.
4. Session Visualization + Arrow Filtering
Background shading highlights key trading sessions (Asia, London, USA).
You can optionally disable arrow signals during specific sessions for a cleaner view.
Features & Alerts
- Toggle EMA Clouds, VWAP, Deviation Zones, and ATR Arrows independently.
- Customize all colors, transparencies, and visual styles.
- Built-in alerts for bullish and bearish arrow signals.
Compatibility
Works on all assets: Forex, Crypto, Stocks, Indices, Futures.
Fully adaptive across all timeframes — intraday to swing.
No optimization needed — smart parameters adjust automatically.
Strategy Alignment Tip
QuantumFlowTrader V1 adapts to any trading strategy and acts as a directional compass for market flow.
It becomes especially powerful when combining multiple timeframes — for example, using the 1H and 15M charts to define trend alignment, and then executing entries on lower timeframes in the direction of that flow.
Note: Entry setups are defined by each trader’s individual system.
This indicator does not provide entry points — it highlights multi-timeframe alignment and directional bias.
To request access, contact via TradingView profile.

ATR + ATR last 3d + correction-end (Tradac Level 2)1. Value: ATR 14 Standard.
2. Value: Highest value of the last (X) hours. This can be adjusted to the specific market, for
example, from today's 6:00 PM to the 6:00 PM candle 3 days prior.
To do this, multiply the number of daily candles from the market by 3 and enter the value.
3. Value: Significant high + ATR of the reference candle. This value is only displayed if there are
at least 5 correction candles to its right.
4. Value: Significant low + ATR of the reference candle. This value is only displayed if there are
five correction candles to its right.

CapitalFlowResearch: N-ATRCapitalFlowsResearch: N-ATR — Normalised Volatility Regime Indicator
CapitalFlowsResearch: N-ATR transforms ATR into a normalised, directional volatility signal that oscillates within a fixed range. Instead of treating ATR as an absolute number—which varies widely across assets and market regimes—the tool rescales volatility into a consistent framework, allowing traders to compare conditions across instruments and timeframes without recalibrating settings.
The indicator identifies two core attributes simultaneously:
Volatility level relative to its recent environment
By normalising ATR, the script shows whether current volatility is high or low relative to its own historical context, not in arbitrary terms.
The direction of volatility pressure
A smoothing layer helps determine whether volatility is rising or falling, enabling a four-state volatility map (high → rising, high → falling, low → rising, low → falling).
These states are displayed via subtle background shading, giving a clear view of shifts in volatility regime without cluttering the chart.
A color-coded line plots the smoothed volatility signal itself, making transitions easy to spot and track over time.
Together, these features turn N-ATR into an effective volatility-regime compass—highlighting periods of compression, expansion, and volatility trend changes that often precede important market behaviour—while preserving the confidentiality of the underlying calculations.

CapitalFlowsResearch: Vol RangesCapitalFlowsResearch: Vol Ranges — Multi-Timeframe ATR Expansion Map
CapitalFlowsResearch: Vol Ranges creates a structured volatility “roadmap” by projecting expected price extensions across multiple timeframes using ATR-based ranges. Instead of relying on a single ATR reading, the tool pulls in higher-timeframe volatility measures—such as daily and monthly expansions—and uses them to build a set of reference levels that anchor the current market against where it should trade under normal volatility conditions.
The script does two things simultaneously:
Projects volatility-derived target bands
It computes a set of upper and lower expansion levels (e.g., +100%, +50%, –50%, –100%) around prior closing levels on different timeframes. These levels act as structural markers for expected movement, allowing traders to quickly recognise when price is behaving within typical bounds or pressing into statistically stretched territory.
Displays a live dashboard for interpretation
A fully configurable on-chart table displays:
Recent volatility readings
Today's reference ranges
Distance from current price to each expansion level
Whether today's movement is expanding or contracting relative to prior volatility
This gives traders a compact situational summary without cluttering the price chart.
Optional high-timeframe projection lines can also be plotted directly on the chart, updating once per new day or new month, making it easy to visually align intraday price action with broader volatility structure.
In practical terms, Vol Ranges functions as a multi-timeframe volatility compass—highlighting when markets are trading inside normal ranges, when they are beginning to stretch, and when they may be entering conditions supportive of momentum or reversal behaviour. All core mechanics remain abstracted, preserving the proprietary nature of the volatility framework.

NYAM Trend PullbackThis is an trend-following strategy designed for trades taken during New York Morning. It aims to capture trend continuations by entering positions when price aligns with the dominant trend relative to a Exponential Moving Average (EMA).
If price is above the EMA then it is bullish and enters long, and if its below the EMA it is bearish and enters a short.

Watermark | Bar Time | Average Daily RangeMulti Info Panel & Watermark
Multi Info Panel & Watermark is a utility indicator that displays several pieces of chart information in a single, customizable panel. It is designed to support intraday and swing analysis by making key data—such as symbol details, date, and average daily range—easy to see at a glance, as well as providing simple tools for notes and backtesting.
Features
Watermark / Custom Note
Optional text overlay that can be used as a watermark or personal note.
Can display a strategy name, reminder, or any other user-defined label on the chart.
Ticker Info
Shows information about the currently active symbol on the chart (for example, symbol name and other basic details depending on the inputs).
Helps keep track of which market or pair is being analyzed, especially when using multiple charts.
Current Date
Displays the current date directly on the chart.
Useful for screenshots, journaling, and documenting analysis.
Average Daily Range (ADR)
Calculates the average daily range of the active symbol over a user-defined number of recent days.
Helps visualize how much price typically moves in a day, which can support position sizing, target setting, or volatility awareness within your own trading approach.
Open Bar Time Marker
Marks the open time of a selected bar (for example, a session open or a specific reference bar).
Primarily intended as a visual aid for manual backtesting and reviewing historical price action.
Usage
Use the watermark and ticker info to keep your charts labeled and organized.
Refer to the ADR readout to understand typical daily volatility of the instrument you are studying.
Use the date and open bar time marker when creating screenshots, trade journals, or when replaying historical sessions for review.
This script does not generate trading signals and does not guarantee any performance or results. It is provided solely as an informational and visualization tool. Always combine it with your own analysis, risk management, and decision-making. Nothing in this indicator or description should be considered financial advice.

Pro Bollinger Bands Strategy [Breno]This strategy excels in highly volatile financial instruments, including cryptocurrencies, high-beta stocks, commodity futures, and certain exchange-traded funds (ETFs) that exhibit clear mean-reversion characteristics around their Bollinger Bands. The system's ability to utilize scaling (position averaging) and an ATR-based stop loss makes it particularly effective in markets with significant price swings, allowing the trader to capture profits from price extremes while managing increased volatility-related risk.
Core Strategy Logic
This Strategy implements a comprehensive trend-following and mean-reversion strategy primarily leveraging the Bollinger Bands (BB) indicator for entry and exit signals, complemented by an Average True Range (ATR)-based Stop Loss mechanism and an optional EMA filter. It is designed with robust features for capital management, including configurable leverage and a sophisticated position averaging (scaling) system.
Long Entry: A long position is initiated when the closing price crosses over the Lower Bollinger Band (ta.crossover(close,lowerBB)). This signals a potential mean-reversion opportunity following a price dip.
Short Entry: A short position is initiated when the closing price crosses under the Upper Bollinger Band (ta.crossunder(close,upperBB)). (Note: Short entries are disabled by default in the script inputs).
Exit Conditions (Profit Target): Long positions aim to exit upon interaction with the Upper Bollinger Band. Users can select from three exit methods:
"Close When Touch": Exits when close≥upperBB.
"Close Above then Below": Exits when the previous close was above the upper band, and the current close is below it (a reversal signal).
"High Above": Exits when high>upperBB. The strategy features an optional profitOnly setting, which restricts all exits to only occur if the trade is currently in profit (i.e., close is above the strategy.position_avg_price for longs).
Key Features and Customization
Bollinger Bands & Filters -
Customizable BB Parameters: The Length and Deviation of the Bollinger Bands are fully adjustable, allowing users to fine-tune the sensitivity of the entry and exit signals.
Optional EMA Filter: An optional EMA Filter can be enabled to align entries with the prevailing trend, where a Long entry is only permitted if close≥EMA(EmaFilterRange).
Risk and Capital Management -
Equity Allocation: Position size is dynamically calculated based on a Percentage of Equity (capitalPerc) combined with the set Leverage multiplier.
Dynamic Stop Loss (ATR-Based):
An optional Stop Loss (SL) is calculated using a multiple (slAtrInput) of the Average True Range (ATR).
The SL is set relative to the entry price upon trade activation, providing a volatility-adjusted risk management layer.
Position Averaging (Scaling): The script supports the addition of multiple units (pyramiding) to an existing position based on three user-selected criteria:
"No": No averaging.
"Percent": Adds to the position if the price has dropped by a set percentage (addPct) from the average price.
"ATR": Adds to the position if the current price is significantly below a calculated ATR-based support level from the average price.

PDH/PDL Sweep & Rejection - sudoPDH/PDL Sweep + Rejection
This indicator identifies classic liquidity sweeps of the previous day's high or low, then confirms whether price rejected that level with force. It is built to highlight moments when the market takes liquidity and immediately snaps back in the opposite direction, a behavior often linked to failed breakouts, engineered stops, or clean reversals. The tool marks these events directly on the chart so you can see them without manually watching the daily levels.
What it detects
The indicator focuses on two events:
PDH sweep and rejection
Price breaks above the previous day's high, overshoots the level by a meaningful amount, and then closes back below the high.
PDL sweep and rejection
Price breaks below the previous day's low, overshoots, and then closes back above the low.
These are structural liquidity events, not random wicks. The script checks for enough overshoot and strong bar range to confirm it was a genuine stop grab rather than noise.
How it works
The indicator evaluates each bar using the following logic:
1. Previous day levels
It pulls yesterday's high and low directly from the daily timeframe. These act as the PDH and PDL reference points for intraday trading.
2. Overshoot measurement
After breaking the level, price must push far enough beyond it to qualify as a sweep. Instead of using arbitrary pips, the required overshoot is scaled relative to ATR. This keeps the logic stable across different assets and volatility conditions.
3. Range confirmation
The bar must be larger than normal compared to ATR. This ensures the sweep happened with momentum and not because of small, choppy price movement.
4. Rejection close
A valid signal only prints if price closes back inside the previous day's range.
For a PDH sweep, the bar must close below PDH.
For a PDL sweep, the bar must close above PDL.
This confirms a failed breakout and a rejection.
What gets placed on the chart
Red downward triangle above the bar: Previous Day High sweep and rejection
Lime upward triangle below the bar: Previous Day Low sweep and rejection
The markers appear exactly on the bar where the sweep and rejection occurred.
How traders can use this
Identify potential reversals
Sweeps often occur when algorithms target liquidity pools. When followed by a strong rejection, the market may be preparing for a reversal or rotation.
Avoid chasing breakouts
A clear sweep warns that a breakout attempt failed. This can prevent traders from entering at the worst possible location.
Time entries at extremes
The markers help you see where the market grabbed stops and immediately turned. These areas can become high quality entry zones in both trend continuation and countertrend setups.
Support liquidity based models
The indicator aligns naturally with trading frameworks that consider liquidity, displacement, failed breaks, and microstructure shifts.
Add confidence to confluence-based setups
Combine sweeps with displacement, FVGs, or higher timeframe levels to refine entry timing.
Why this indicator is helpful
It automates a pattern that traders often identify manually. Sweeps are easy to miss in fast markets, and this tool eliminates the need to constantly monitor daily levels. By marking only the events that show overshoot plus rejection plus significant range, it filters out the weak or false signals and leaves only meaningful liquidity events.

Displacement Pulse Markers - sudoThis indicator is designed to highlight sudden and meaningful bursts of price movement. These bursts are called displacement pulses. A pulse appears when price expands with force, closes near the extreme of its own bar, and breaks through a recent structural level. The indicator places small circles above or below the candle to signal these moments so that traders can quickly spot abnormal movement and potential shifts in market intent.
How it works
The indicator evaluates each bar for three conditions:
Range expansion relative to volatility
The bar must be larger than normal. It compares the bar range to ATR and requires that range to exceed a multiple of ATR. When this condition is met, the bar is considered a large or forceful bar.
Close location within the bar
The bar has to close near its own high or low. A close near the top suggests strong buying force. A close near the bottom suggests strong selling force. The user can adjust what percentage qualifies as near the top or bottom.
Break of recent structure
The bar must break a recent pivot level. For bullish pulses, the high of the bar must exceed the highest high of the past N bars. For bearish pulses, the low must break the lowest low of the past N bars. This confirms that the move did not merely expand but actually displaced prior structure.
When all conditions align
A bullish displacement pulse is marked with a small aqua circle below the bar.
A bearish displacement pulse is marked with a fuchsia circle above the bar.
The result is a clean on chart visualization of where price produced meaningful displacement.
How traders can use this
Spot abnormal momentum
Pulses can highlight areas where price behaves with more force than usual. These events often appear around news, liquidity sweeps, or algorithmic shifts.
Identify possible regime changes
A pulse that breaks structure while closing near the extreme may signal a transition from a ranging environment to a trending one. It does not predict direction but flags where displacement actually occurred.
Support narrative building
When combined with levels, zones, or other frameworks, pulses can confirm whether the market had enough strength to break through an area with conviction.
Filter trades or refine entries
Some traders may choose to trade in the direction of recent pulses during trending conditions. Others may only enter a trade after a pulse confirms that the market has shifted away from compression.
Track where the market is imbalanced
A pulse visually marks whether buyers or sellers were able to generate strong initiative movement. These points often become useful reference zones for continuation or rejection analysis.
Why this indicator is useful
It reduces complex logic into simple visual markers. Instead of scanning bar by bar for structural breaks, volatility expansions, and close strength, the indicator does this automatically and highlights only the bars that meet all criteria. This keeps the chart clean while still providing precision about where displacement actually occurred.

ATR 14 RMA Tradac Level 2This indicator displays the standard ATR value as the first value.
The second value refers to the highest ATR value of the last 3 days on the hourly chart.
For this, the value "72" (24 hours x 3 days) is used in the settings.
For the 4-hour chart, 30 hours should be set to display the value of the last 5 days.
It can be used as a support level in the Tradac Level 2 training.

OTA ATR Stop BufferOTA ATR indicator calculates and displays the Daily Average True Range (ATR), and two customizable ATR percentage values in a clean table format. It provides values in ticks and points, helping traders set stop-loss buffers based on market volatility.

Hash SupertrendHash Supertrend is a visually enhanced Supertrend-based indicator designed by Hash Capital Research, tuned specifically for crypto trend trading on Solana (SOL) and Bitcoin (BTC). It combines institutional-style color coding, an optional session time filter, and production-ready alerts for systematic and discretionary traders alike.
What This Indicator Is
Hash Supertrend is a trend-following volatility band indicator built on TradingView’s native ta.supertrend() function.
It’s optimized and visually styled for:
High-volatility crypto pairs (especially SOL/USDT, SOL/USD, BTC/USDT, BTC/USD)
Timeframes typically used by crypto traders (from 5m scalping to 4H swing and 1D trend following)
The script is an indicator, not a strategy:
It does not place trades or show backtest results.
It provides clear trend states, flips, and alerts that you can plug into your own execution stack or manual trading.
Key Features
✅ Tuned for Crypto (Solana & Bitcoin)
Parameters are chosen to respond well to the volatility profile of SOL and BTC, reducing noise while still catching strong moves.
✅ Non-repainting Supertrend Core
Uses TradingView’s built-in ta.supertrend — values may move intrabar as the bar forms, but once a bar closes, the historical line and signals do not repaint.
✅ Fluorescent Trend Visualization
Bright green for bullish phases
Bright red for bearish phases
Adaptive color intensity based on user setting
✅ Glow Layer & Trend Zones
Glow effect around the Supertrend line for instant visual recognition
Optional filled zones between price and line for “trend cloud” style visualization
✅ Time Filter (Session Control)
Option to only mark signals during specific hours for those wanting to integrate with webhooks
Designed for traders who avoid certain sessions (e.g., low-liquidity hours)
✅ Signal Dots & Alerts
Tiny green dots for bullish flips
Tiny red dots for bearish flips
Professional, preconfigured alerts for:
Long Entry
Short Entry
Any Trend Change
Filtered signals outside trading hours (for monitoring only)
The core logic is built on:
ATR Length (ATR Length) Default: 16
Lower values (7–10): more sensitive, more signals, more noise
Higher values (12–20): smoother, fewer but stronger trend signals
Factor (Factor) Default: 3.11
Lower values (1.5–2.5): tighter bands, earlier entries, higher whipsaws
Higher values (3.0–4.0+): wider bands, later entries, stronger trend confirmation
The indicator reads direction from ta.supertrend and classifies:
Bullish Trend: direction < 0
Bearish Trend: direction > 0
A trend flip happens when direction changes sign:
longSignal: Supertrend flips from above price to below price (bearish → bullish)
shortSignal: Supertrend flips from below price to above price (bullish → bearish)

Ghost Robo Plus [Bit2Billions]Ghost Robo Plus — Rule-Based Trade Management System
*An advanced, rule-based trading strategy for structured entries, exits, and complete trade management using Heikin-Ashi logic.*
Ghost Robo Plus simplifies trade execution by automating entry, stop-loss, and multiple take-profit levels, all visualized cleanly on your chart. It supports position sizing, backtesting, alerts, and real-time trade tracking, making it easy for traders to test strategies, validate ideas, and follow trades without chart clutter.
Key Features
1. Heikin-Ashi Entry System
* Generates clear long/short signals based on Heikin-Ashi candle crossovers.
* Structured entry logic ensures precise timing aligned with trend direction.
2. Multiple Exit Modes (Switch Anytime)
* ATR Mode: TP1/TP2/TP3 and SL based on ATR distance calculations.
* Trailing Mode: Dynamic trailing logic for trend-following continuation.
* Options Mode: Original options-style behavior preserved for flexible testing.
3. Multi–Take-Profit Structure
* Three configurable take-profit levels (TP1, TP2, TP3) with adjustable percentage splits.
* Enables partial profit-taking with structured scaling.
4. ATR-Based Calculations
* All TP and SL levels are derived from ATR length, profit factors, and stop factors.
* Volatility-adjusted trade placement ensures adaptive risk/reward.
5. Visual Trade Manager
* Automatically draws Entry, Stop Loss, and TP lines directly on chart.
* Includes on-chart labels for Entry, SL, TP, and mini entry/exit markers.
* Visuals update automatically per trade, removing clutter or leftover objects.
6. Alerts
* Built-in alerts for:
* Long entry
* Short entry
* TP/SL exits
* Any trade event (unified alert option)
7. Position Sizing & Commission Support
* Percent-of-equity sizing (10% default, fully adjustable).
* Supports TradingView strategy commission settings for realistic backtesting.
What Ghost Robo Plus Solves
* Automates TP/SL drawings and scaling for faster analysis.
* Lets traders test multiple exit styles without rewriting logic.
* Ensures clear, consistent on-chart visualization for every trade.
* Provides a structured workflow for backtesting and strategy validation.
* Eliminates chart clutter with synchronized, auto-updating visual elements.
Inputs & High-Level Settings
* TPS Mode: ATR / Trailing / Options
* Risk Settings: ATR length, profit factor, stop factor
* TP Splits: Adjustable TP1/TP2/TP3 percentages
* Position Sizing: Percent of equity (default 10%)
* Visual Controls: Auto-managed lines & labels
* Alerts: Entry/exit event triggers
Recommended Timeframes & Markets
* Recommended starting timeframes: 15m and higher (15m, 1H, 4H, Daily). Works on intraday but benefits from cleaner HTF structure.
* Suitable for liquid FX pairs, major crypto, indices and liquid equities.
* On illiquid or low-volume instruments, the volume-split and total-volume filters should be tightened, or higher timeframes should be used.
What Ghost Suite Solves
* Helps reduce manual charting work
* Speeds up analysis with automated visual tools
* Cuts through chart noise for improved clarity
* Provides consistent, rule-based visualization for workflows
Inputs & Settings
* Default settings pre-configured
* Simple Show/Hide toggles for modules
* Minimal exposed fields for ease of use
Recommended Timeframes & Markets
* Works best on 15M, 1H, 4H, Daily, and higher
* Suitable across forex, crypto, indices, and liquid equities
* Pivot-based modules may show noise on illiquid assets
Performance & Limitations
* May draw many objects → disable unused modules for speed
* Refresh the chart if historical buffer issues occur
* TradingView platform limitations handled internally
License & Legal
* Proprietary © 2025
* Redistribution, resale, or disclosure prohibited
* Independently developed with proprietary extensions
* Any resemblance to other tools may result from public-domain concepts
Respect & Transparency
* Built on widely recognized public trading concepts.
* Developed with respect for the TradingView community.
* Any overlaps or similarities can be addressed constructively.
Disclaimer
* Educational purposes only
* Not financial advice
* Trading carries risk — always use paper testing and proper risk management
FAQs
* Source code is not public
* Works best on 15m, 1H, 4H, Daily, Weekly charts
* Modules can be hidden/shown with toggles
* Alerts can be set up manually by users
* Supports multiple markets: forex, crypto, indices, and equities
About Ghost Trading Suite
Author: BIT2BILLIONS
Project: Ghost Trading Suite © 2025
Indicators: Ghost Matrix, Ghost Protocol, Ghost Cipher, Ghost Shadow
Strategies: Ghost Robo, Ghost Robo Plus
Pine Version: V6
The Ghost Trading Suite is designed to simplify and automate many aspects of chart analysis. It helps traders identify market structure, divergences, support and resistance levels, and momentum efficiently, reducing manual charting time.
The suite includes several integrated tools — such as Ghost Matrix, Ghost Protocol, Ghost Cipher, Ghost Shadow, Ghost Robo, and Ghost Robo Plus — each combining analytical modules for enhanced clarity in trend direction, volatility, pivot detection, and momentum tracking.
Together, these tools form a cohesive framework that assists in visualizing market behavior, measuring momentum, detecting pivots, and analyzing price structure effectively.
This project focuses on providing adaptable and professional-grade tools that turn complex market data into clear, actionable insights for technical analysis.
Crafted with 💖 by BIT2BILLIONS for Traders. That's All Folks!
Changelog
v1.0 — Initial Release
* Added Heikin-Ashi–based long/short entry system.
* Introduced three exit modes: ATR, Trailing, and Options.
* Added full multi-TP support with configurable TP1/TP2/TP3 quantities.
* Implemented ATR-based TP/SL calculations for ATR mode.
* Added on-chart visuals for Entry, SL, and TP levels with dynamic cleanup.
* Introduced queue-safe line/label manager to avoid object clutter.
* Added alerts for entries, exits, and general signals.
* Enabled position sizing, backtesting, and commission settings.
* Polished internal logic with a clean, auditable structure for reliability.
